When a Linux server feels slow, CPU usage is an obvious place to look—but one percentage rarely explains the problem. A machine can show high utilization while completing useful work, a modest CPU percentage while tasks wait on storage, or a rising load average because runnable processes are competing for limited cores. The right CPU monitoring command in Linux depends on whether you are checking overall capacity, individual processes, per-core imbalance, wait time, or a trend.
This guide builds a practical workflow from commands already present on most systems, plus the widely available sysstat utilities when you need more detail. It is intended for developers and small teams that want useful evidence without deploying a heavy monitoring platform.
Start by defining the symptom and time window
Before running commands, record what is actually slow: an API route, an SSH session, a background job, a database query, or the whole host. Note when it started, whether it is continuous or intermittent, and whether a deployment, traffic change, backup, or scheduled task happened nearby. CPU evidence is most useful when it can be aligned with a user-visible symptom.
A single interactive snapshot may miss a five-minute spike that occurred an hour ago. Use live commands during an active problem, but also collect small timestamped samples for later comparison. Always interpret percentages against the number of logical CPUs, the workload, and any virtual-machine or container limits.
Check load and core count with uptime and nproc
nproc
uptime
cat /proc/loadavg
nproc reports the processing units available to the current process. uptime shows one-, five-, and fifteen-minute load averages. Load is not the same as CPU utilization: on Linux it includes runnable tasks and tasks in uninterruptible sleep, commonly associated with I/O. A load of 4 has a very different meaning on a two-core host than on a sixteen-core host.
Compare the three windows. A one-minute value much higher than the fifteen-minute value suggests recent growth; a lower one-minute value can indicate recovery. Treat load as a direction and queue-pressure signal, then use the next commands to identify whether CPU execution, I/O wait, or another bottleneck is responsible.
Use top for a live system overview
toptop combines load, task states, CPU modes, memory, and process activity. Focus on the CPU line rather than only the first process. User time (us) often represents application work, system time (sy) kernel work, idle (id) unused capacity, I/O wait (wa) time waiting for storage, and steal (st) time taken by the hypervisor from a virtual CPU.
Press 1 in many top implementations to see individual CPUs. One saturated core with others mostly idle can point to a single-threaded task, CPU affinity, interrupt concentration, or a lock that prevents useful parallelism. Use P to sort processes by CPU, but observe several refreshes; a short-lived command can momentarily appear at the top without causing a sustained problem.
Get a repeatable process list with ps
ps -eo pid,ppid,user,comm,%cpu,%mem,etime,state --sort=-%cpu | head -n 16This ps view is easier to save in a ticket or report than an interactive screen. The elapsed time helps distinguish a long-running worker from a new process, while state can reveal runnable or blocked tasks. The %CPU value is based on process lifetime and accounting conventions, so it is not a perfect instantaneous sample. Use it to rank candidates, then confirm behavior over an interval.
For threaded applications, inspect threads as well:
ps -eLo pid,tid,psr,comm,stat,%cpu --sort=-%cpu | head -n 20The processor column (psr) shows the CPU on which a thread last ran. This can expose one busy application thread even when the parent process summary hides the distribution.
Separate CPU work from waiting with vmstat
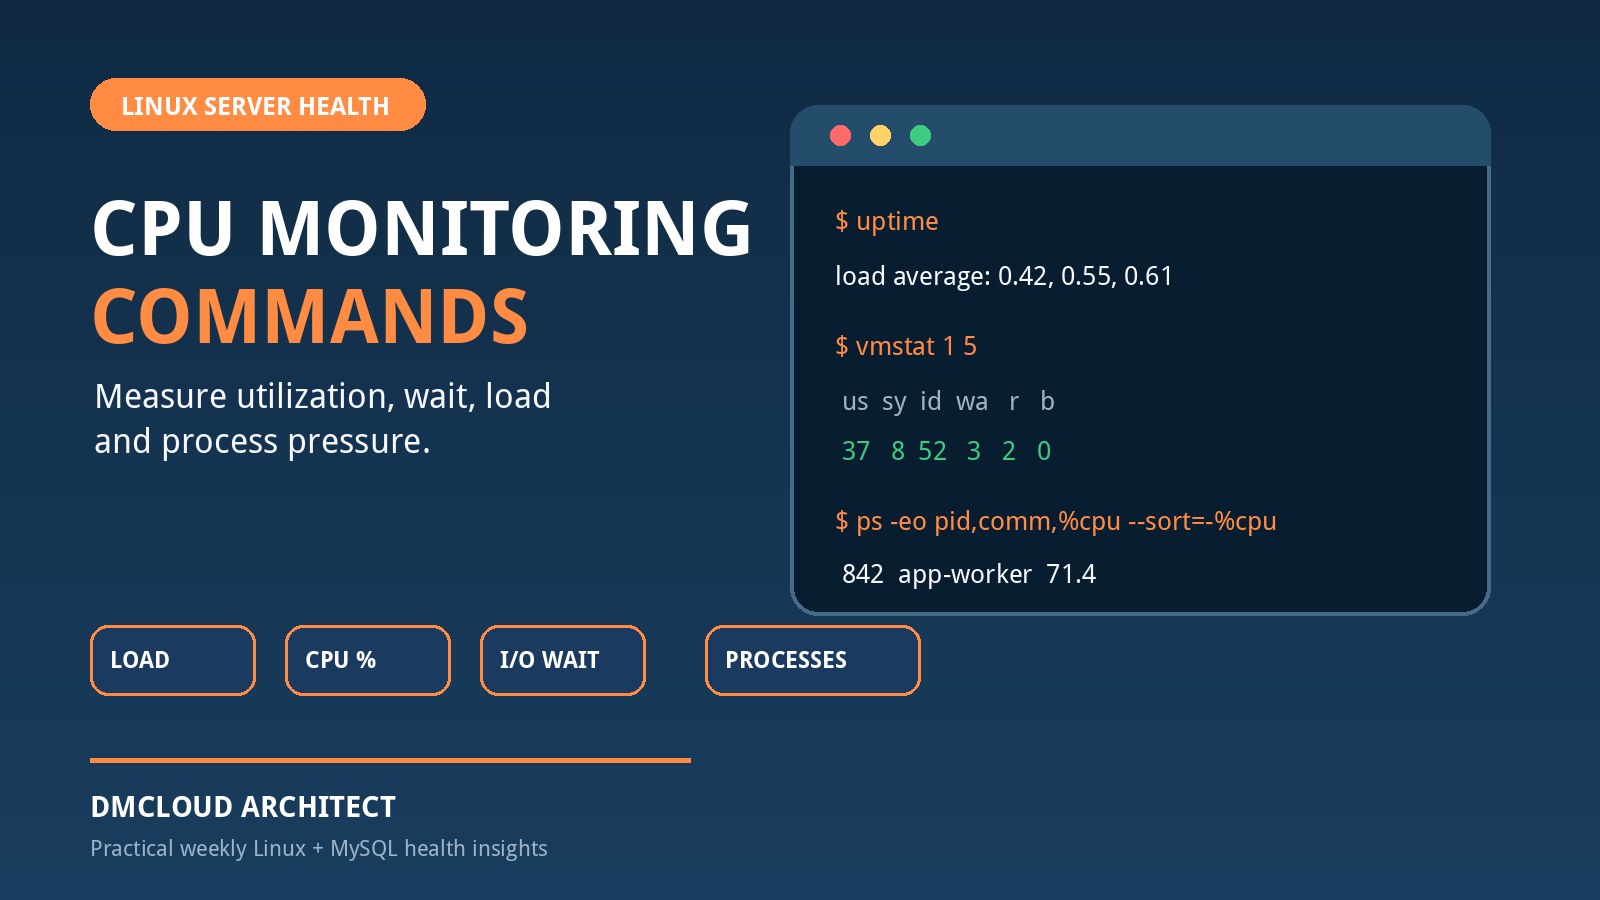
vmstat 1 10With an interval and count, vmstat produces repeated samples. Ignore the first line when comparing one-second activity because it commonly represents averages since boot. In later lines, watch the runnable queue (r), blocked tasks (b), user and system CPU, idle time, and I/O wait.
- High user time and a persistent runnable queue: application work may be consuming available CPU.
- High system time: investigate kernel-heavy activity such as networking, storage, context switching, or excessive system calls.
- High I/O wait with blocked tasks: storage or a dependent I/O path may be the real bottleneck.
- High steal time: a virtual host may not be receiving the CPU time it expects.
These are investigation leads, not universal thresholds. Compare them with a normal period on the same host and workload.
Measure per-core utilization with mpstat
If the sysstat package is installed, mpstat gives a clean interval view:
mpstat -P ALL 1 5The aggregate row shows overall CPU modes, and the per-CPU rows reveal imbalance. This is useful for finding a pinned process, an overloaded core, or high steal or wait on a virtual machine. Do not install packages during an incident without following the host's change process; top, vmstat, and /proc/stat can still provide a useful first diagnosis.
Attribute interval CPU usage with pidstat
pidstat -u 1 10
pidstat -u -p ALL 5 3pidstat, also provided by sysstat, samples process CPU over an interval instead of relying on a lifetime average. It separates user and system CPU and can report the CPU used by each task. Once a process stands out, correlate its timestamps with application logs, request volume, job schedules, and database activity before changing priority or stopping it.
A busy process may be the victim rather than the cause. For example, an application can consume extra CPU because requests retry after a downstream failure, because a cache miss rate increased, or because malformed input triggers expensive parsing. Preserve enough context to explain why the work increased.
Read /proc/stat for monitoring without extra tools
The first line of /proc/stat contains cumulative CPU time counters:
grep '^cpu ' /proc/statBecause the counters are cumulative, calculate utilization from the difference between two readings. The following Bash CPU monitoring script takes a five-second sample and prints a timestamped busy percentage:
#!/usr/bin/env bash
set -euo pipefail

read_cpu() {
  read -r _ user nice system idle iowait irq softirq steal _ < /proc/stat
  idle_all=$((idle + iowait))
  total=$((user + nice + system + idle + iowait + irq + softirq + steal))
  printf '%s %s\n' "$idle_all" "$total"
}

read -r idle1 total1 < <(read_cpu)
sleep 5
read -r idle2 total2 < <(read_cpu)

delta_idle=$((idle2 - idle1))
delta_total=$((total2 - total1))
if (( delta_total <= 0 )); then
  echo "Unable to calculate CPU interval" >&2
  exit 1
fi

busy=$(awk -v i="$delta_idle" -v t="$delta_total" \
  'BEGIN { printf "%.1f", 100 * (t - i) / t }')
printf '%s cpu_busy_pct=%s load=%s\n' \
  "$(date -Is)" "$busy" "$(cut -d' ' -f1-3 /proc/loadavg)"
This script measures aggregate busy time; it does not by itself explain user, system, wait, or per-process behavior. Keep its output as a trend signal and collect a bounded diagnostic snapshot when it rises. Note that treating I/O wait as idle in this calculation is deliberate: it distinguishes CPU execution from time when the CPU could not run useful work because tasks were waiting.
Make cron CPU monitoring safe and useful
For lightweight cron CPU monitoring on Linux, write one compact line to a dedicated log at a modest interval. Use an absolute script path, a controlled PATH, log rotation, and a lock if overlap is possible. Avoid launching expensive process dumps every minute.
*/5 * * * * /usr/local/sbin/cpu-sample.sh >> /var/log/cpu-samples.log 2>&1A better escalation pattern is to collect cheap utilization and load samples routinely, then capture vmstat, top processes, and per-core data only after a sustained condition. Add a cooldown so the same event does not create hundreds of files. Do not automatically kill a process based on one percentage; alert or report the evidence and investigate the workload first.
Account for containers and virtual machines
Inside a container, host CPU totals can be misleading if cgroup quotas restrict the workload. Review the container runtime's limits and the applicable cgroup CPU files, then compare the workload against its quota rather than assuming all host cores are available. In virtual machines, sustained steal time can indicate contention outside the guest. In both cases, record whether the evidence comes from the application container, guest OS, or physical host.
Use pressure information when available
cat /proc/pressure/cpuLinux Pressure Stall Information reports how much time tasks were delayed because CPU resources were unavailable. The some line describes periods when at least one task was stalled; the full line has limited meaning for CPU because a runnable task can generally make progress. Pressure complements utilization by showing whether contention delayed work. Compare short and longer averages with application latency and queue depth.
A practical CPU investigation sequence
- Record the symptom, timestamp, affected service, and recent changes.
- Run
nprocanduptimeto frame load against available CPUs. - Use
topormpstat -P ALLto classify user, system, wait, steal, and per-core behavior. - Run
vmstat 1 10to compare runnable and blocked tasks over an interval. - Use
psorpidstatto identify processes or threads doing the work. - Correlate the same period with application, database, storage, and deployment evidence.
- Change one thing through the normal change process, retain a rollback path, and repeat the same measurement.
This sequence prevents a common mistake: reacting to a high number without knowing whether it represents healthy throughput, CPU saturation, storage waiting, virtualization contention, or a workload change.
Turn command output into a weekly trend
CPU monitoring without tools does not have to mean monitoring without history. A useful weekly review can summarize peak and typical busy CPU, load relative to core count, sustained I/O wait or steal, the busiest recurring processes, and changes aligned with releases or scheduled jobs. Retain aggregated values rather than unbounded command output, and avoid storing command arguments that may contain sensitive data.
Trend comparison is more valuable than a generic threshold. If the same batch moves from 35% to 70% CPU over six weeks, or the runnable queue grows while request volume stays flat, the team has an early performance signal. That evidence supports a focused decision: optimize code, adjust a schedule, investigate a dependency, or plan capacity before users experience a failure.
Want CPU and server-health trends summarized without another dashboard?
DMCloud Architect turns Linux and MySQL signals into practical weekly reports, helping developers and small teams spot sustained changes before they become incidents.