Small teams often need to know whether their servers are healthy, but they do not have time to study several dashboards every morning. Easy server reporting solves a different problem from real-time alerting: it turns routine Linux, database, backup, and capacity checks into a short operational summary that a developer or business owner can understand and act on.
The best report is not the one with the most metrics. It is the one that reliably answers four questions: what is healthy, what changed, what needs attention, and what should happen next. A low-maintenance process can provide those answers each week without creating a second monitoring platform to administer.
Separate urgent alerts from routine reporting
Real-time alerts and scheduled reports serve different purposes. An alert should interrupt someone when immediate action is justified: a service is unavailable, a filesystem is nearly full, backups are failing repeatedly, or a certificate is about to expire. A weekly report should reveal slower changes that are easy to miss between incidents.
Examples include disk use increasing by two percentage points each week, MySQL queries gradually taking longer, backup duration expanding as data grows, or a server spending more time under memory pressure. None of these signals may justify a 2:00 a.m. notification. Together, however, they can identify the next operational problem while there is still time to address it calmly.
Keeping the two channels separate also reduces alert fatigue. Immediate notifications remain reserved for urgent conditions, while the report carries trends, warnings, and planning items. The result is a practical server monitoring process rather than a stream of equally urgent-looking messages.
Start with decisions, not a long metric list
Every item in a report should support a decision. Before collecting a value, ask what action a person might take if it changes. If there is no credible response, the measurement may belong in diagnostic storage rather than the weekly summary.
- Availability: did the important services remain reachable, and were there repeated restarts?
- Capacity: are disk, inode, memory, database, or backup requirements approaching an operating limit?
- Performance: are CPU pressure, I/O latency, query time, or application response time worsening?
- Protection: did backups complete, and has a restore check succeeded recently?
- Maintenance: are security updates, expiring certificates, or failed jobs waiting for attention?
- Change: did a deployment, configuration update, or workload increase explain the movement?
This decision-first approach keeps easy infrastructure monitoring focused. Detailed command output can remain available for investigation, but the main report should contain status, evidence, context, and a next action.
Use a small Linux health baseline
A useful Linux baseline does not require hundreds of counters. Begin with signals that describe demand, pressure, capacity, and failures. Record the logical CPU count and load or run-queue behavior, memory availability and swap activity, filesystem space and inode use, recent service failures, and important system log events.
Interpret these values together. High CPU utilization can be healthy during productive work, while low CPU with high I/O wait can indicate a storage bottleneck. Low “free” memory is normal when Linux uses RAM for cache, but falling available memory combined with swap-in activity and slower applications deserves investigation.
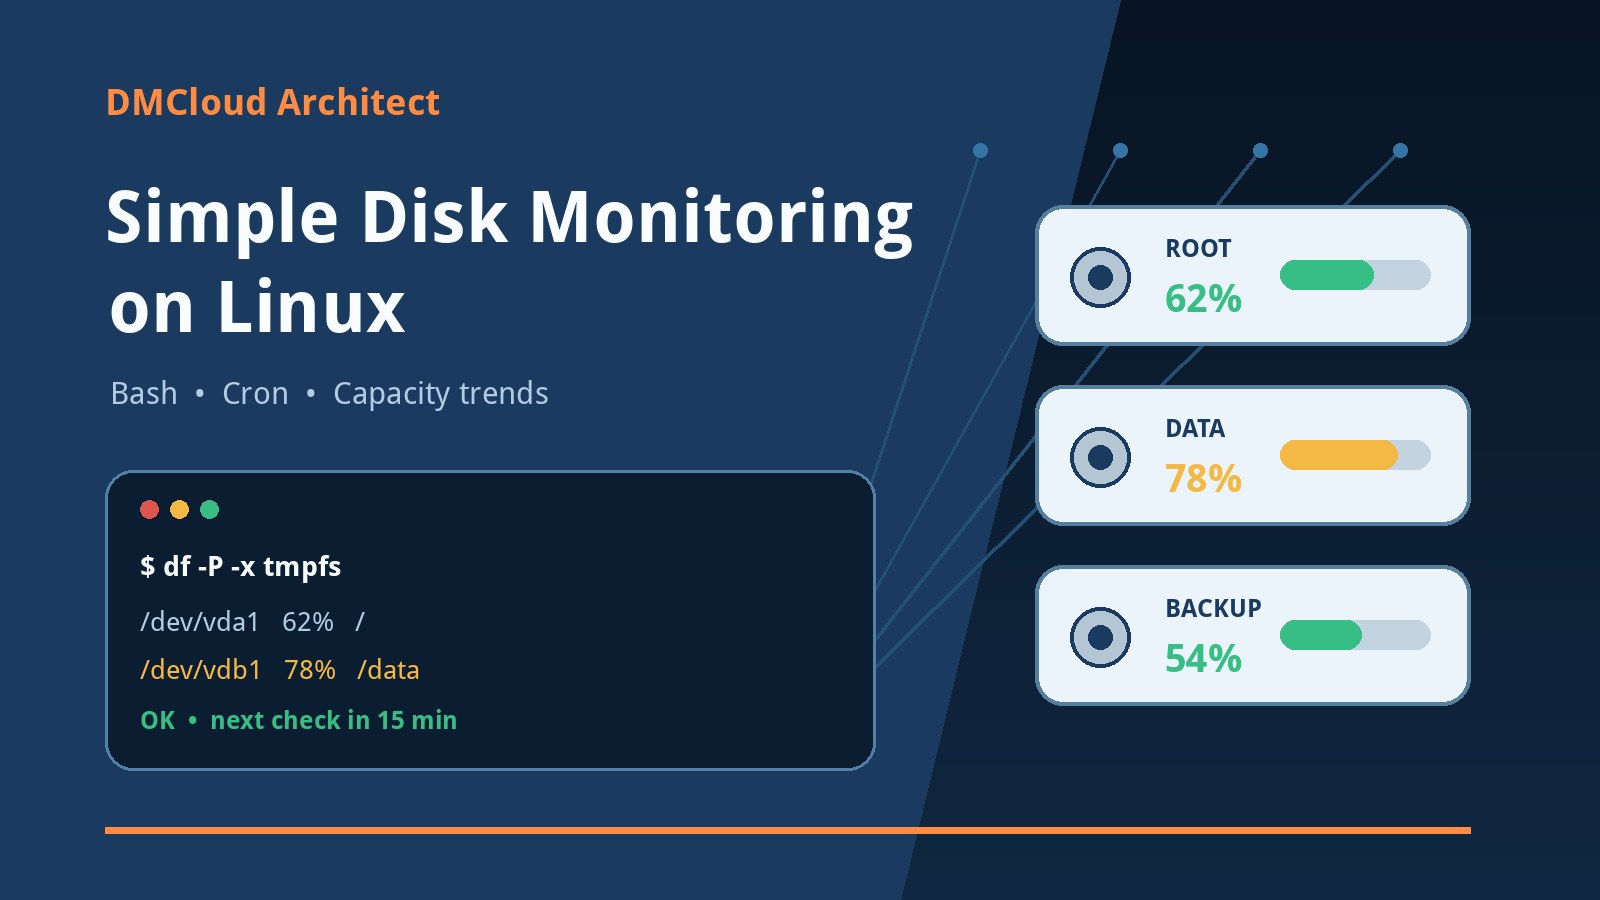
For storage, check both percentage used and absolute space remaining. A percentage alone can exaggerate risk on a very large volume or understate it on a small root filesystem. Include inode use because a filesystem can reject new files even when it still has free blocks.
# Lightweight examples for a scheduled collector
uptime
vmstat 1 5
df -P -x tmpfs -x devtmpfs
df -Pi -x tmpfs -x devtmpfs
systemctl --failed --no-legend
journalctl -p warning --since "7 days ago" --no-pager
Commands are only collection inputs. Parse their output into stable fields, record timestamps and host identifiers, and handle errors explicitly. A failed collector must appear as “unknown” or “check failed,” never as a healthy zero.
Add MySQL checks that explain user-facing risk
For a server running MySQL, include a concise database section. Confirm availability, connection use, storage growth, slow-query behavior, replication state when applicable, and evidence of lock or resource pressure. Avoid reporting isolated counters without a comparison or interpretation.
For example, a growing slow-query count is more useful when paired with traffic volume, the slow-query threshold, and the most affected query pattern. Increasing database size is not automatically a problem, but it becomes a planning item when the growth rate points toward a storage limit or longer backup window.
- Service state: reachable, read/write check successful, and unexpected restarts.
- Connections: peak use compared with the configured limit.
- Query behavior: slow-query movement and representative high-cost statements.
- Locks: deadlocks, long transactions, and lock waits that affect work.
- Storage: database size, temporary space, binary log retention, and growth rate.
- Replication: health, lag, and errors where replicas are part of the design.
Credentials used by the collector should have only the permissions required for health queries. Keep them outside scripts and report files, and never copy sensitive query text or customer data into an email summary.
Treat backup evidence as more than “job succeeded”
A successful exit code is useful, but it is not enough to prove recoverability. Report the last successful backup time, artifact size, duration, destination availability, retention status, and the date of the most recent restore test. Sudden changes in size or duration can reveal a broken exclusion, missing data, storage slowdown, or workload growth.
Define freshness according to the recovery objective. If the expected schedule is nightly, a backup older than 30 hours may be a warning even though the last run technically succeeded. If off-site replication is required, verify that the copy arrived rather than assuming the local job completed the full process.
A periodic restore check should be a named item with evidence. It can restore a representative file set, validate a database backup on an isolated system, or run an application-specific integrity test. The weekly report can show the latest result and mark the check stale when the agreed test interval has passed.
Compare trends instead of forwarding snapshots
Monitoring without complexity still requires history. A snapshot says that a filesystem is 72 percent full; a trend says whether it has been stable for six months or has grown four points in two weeks. Store consistent observations so each report can compare the current period with previous weeks.
Use comparable windows. Business-hour CPU should be compared with earlier business hours, and backup duration should be compared with previous runs of the same backup. Record relevant changes such as releases, customer imports, new scheduled jobs, instance resizing, or retention-policy updates.
For each important signal, show the current value, recent baseline, direction, and operational limit. Avoid false precision. “Disk use rose from 64% to 69% in four weeks and may reach the 80% operating limit in roughly nine weeks” is more useful than a long table of daily measurements.
Design a report that can be read in five minutes
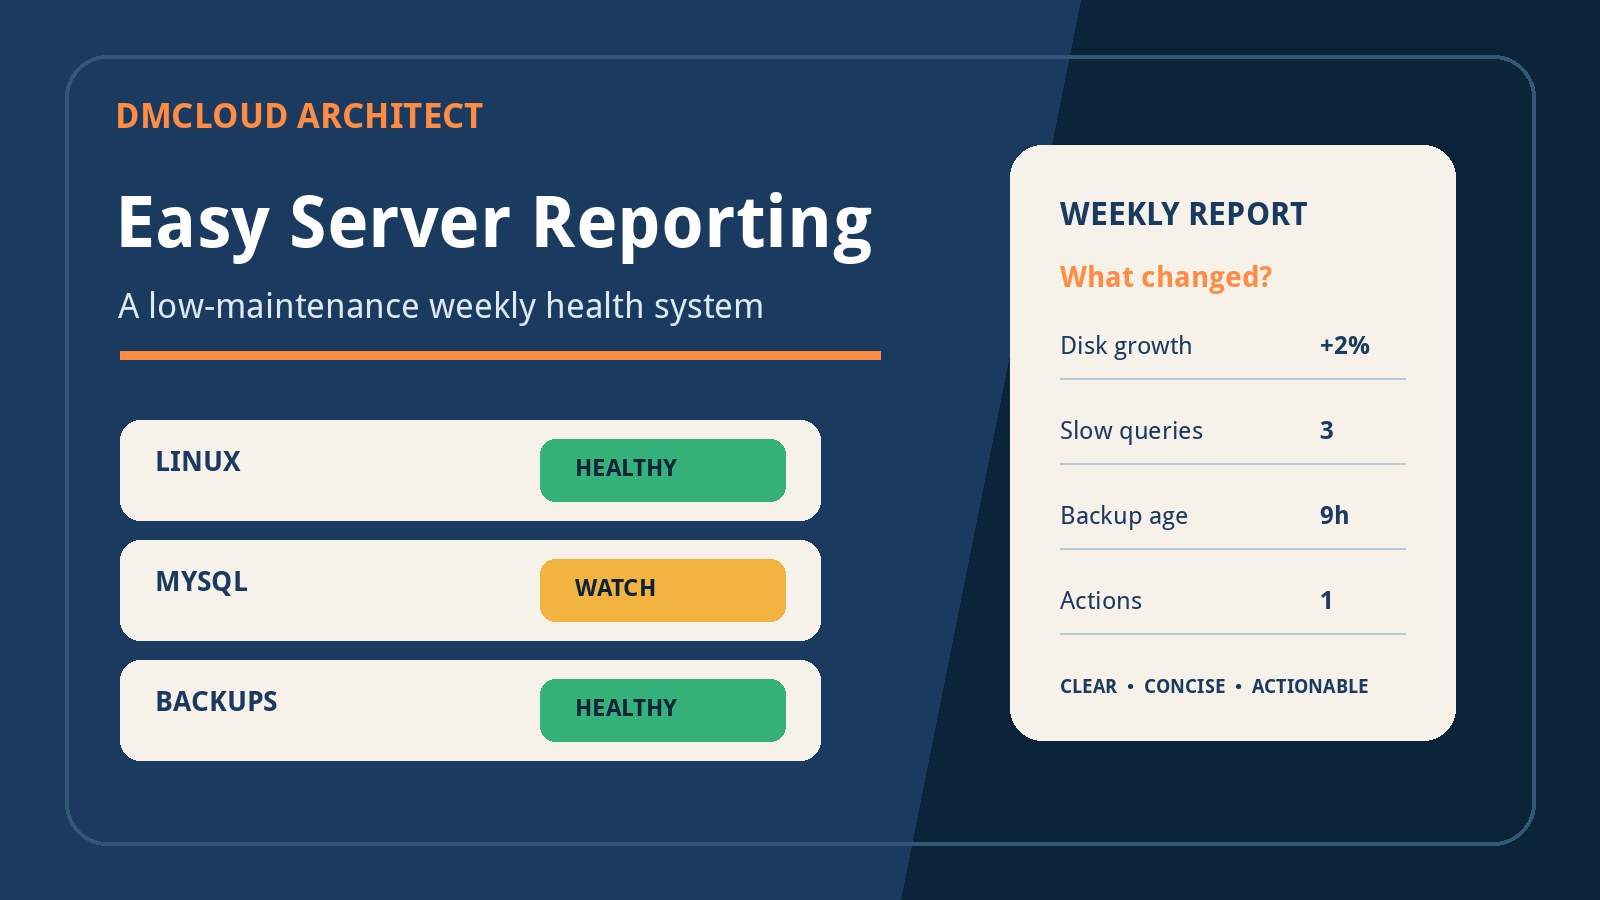
A simple monitoring system should produce a consistent, skimmable format. Put the conclusion first and keep supporting evidence close to it. A practical structure is:
- Overall status: healthy, watch, or action required.
- Changes since last report: the few movements that matter.
- Action items: owner, next step, and target date.
- Linux health: pressure, capacity, service, and log summary.
- MySQL health: availability, query, connection, lock, and growth summary.
- Backup and maintenance: freshness, restore evidence, updates, certificates, and failed jobs.
- Collection quality: any missing, stale, or failed checks.
Use status labels consistently. “Healthy” means the check ran and stayed within its expected range. “Watch” means a trend or condition should be reviewed but does not yet require urgent work. “Action required” means a specific task should be assigned. “Unknown” means evidence is missing; it must not be silently converted into healthy.
Make every warning actionable
A warning should identify the system, the observed condition, the expected range, the change over time, and the recommended first step. “Disk warning” forces the reader to begin the investigation from zero. A better statement is: “The application volume on web-01 increased from 71% to 76% in two weeks; retained upload previews account for most growth. Review the 30-day preview-retention job before next Friday.”
Assigning an owner and review date prevents recurring warnings from becoming permanent report decoration. Carry unresolved items forward, but show age and progress. Close an item only when verification confirms that the condition has cleared or the accepted risk has been documented.
Suppress unchanged detail, not unresolved risk. A stable healthy section can be one line, while a new or worsening condition receives context. This keeps the document short without hiding important work.
Automate collection safely
Run collectors from cron or systemd timers under a dedicated account with minimal permissions. Use absolute paths, a controlled environment, timeouts, and predictable output formats such as JSON. Write each check atomically so an interrupted process cannot leave a partial file that appears valid.
Record the collector version, start time, completion time, and error state. Set a freshness rule for every source. If a weekly report uses a three-week-old database observation because collection silently stopped, its conclusions may be dangerous.
Keep collection separate from report generation. Collectors gather and normalize facts; the reporting job compares periods, applies status rules, and formats the summary. This separation makes individual checks easier to test and lets the report continue with an explicit unknown state when one source fails.
Keep maintenance costs low
Low maintenance monitoring depends on restraint. Add a new check only when it supports a decision, catches a realistic failure, or replaces manual work. Remove or demote measurements that repeatedly produce no action. Review thresholds after infrastructure or workload changes rather than treating defaults as permanent truths.
Use configuration for hosts, expected services, important mounts, database targets, schedules, and limits. Do not duplicate nearly identical scripts per server. A shared collector with small host-specific configuration is easier to patch, test, and audit.
Test failure paths deliberately. Stop a disposable test service, make a collector time out, provide malformed output, and confirm that the report shows the correct failure state. Healthy-path testing alone cannot prove that missing evidence will be handled safely.
A practical weekly server reporting checklist
- Define the decisions the report must support.
- Separate urgent alerts from scheduled trend reporting.
- Collect a focused Linux baseline for pressure, capacity, and failures.
- Add MySQL availability, query, connection, lock, and growth evidence.
- Report backup freshness, destination status, and restore-test age.
- Compare consistent periods and record operational changes.
- Use healthy, watch, action required, and unknown states consistently.
- Give each warning evidence, a first step, an owner, and a review date.
- Run collectors with minimal permissions, timeouts, and freshness checks.
- Review the checks and thresholds as systems and workloads change.
Get useful infrastructure evidence without dashboard fatigue
Easy infrastructure monitoring is not about eliminating technical detail; it is about presenting the right detail at the right time. A focused weekly process can reveal capacity drift, database degradation, stale backups, and failed maintenance while keeping urgent alerts reserved for genuine incidents.
DMCloud Architect turns Linux, MySQL, backup, and capacity checks into a concise weekly report for developers and small business owners. To see changes, risks, and practical next steps without adding another dashboard to watch, explore Infrastructure Health Reporting.