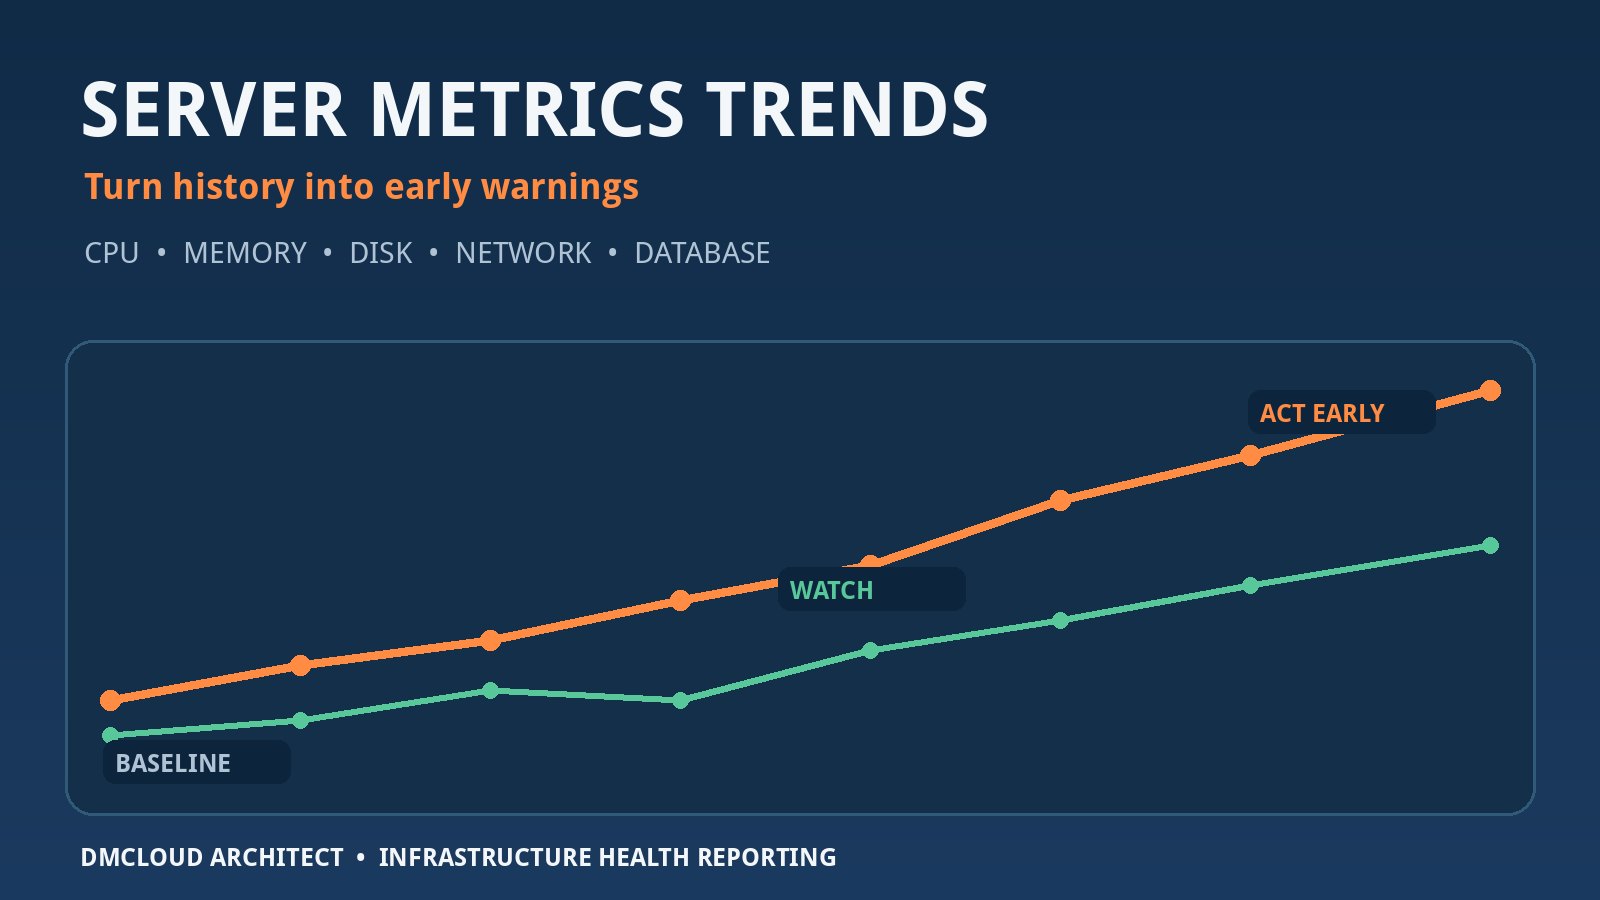
A server can look healthy during a quick check while its operating margin quietly shrinks. Disk use grows by a few percent each week, database work takes a little longer, and memory pressure appears only during the busiest hour. Server metrics trends expose these changes by showing direction, duration, and relationships that a single snapshot cannot provide.
The objective is not to keep more dashboards open. It is to preserve enough consistent history to answer practical questions: Is demand growing normally? Is the system becoming less efficient? Which constraint is likely to affect customers first? A short trend review can give developers and small business owners useful answers before a slow service becomes an urgent incident.
Why snapshots and isolated alerts miss gradual change
A point-in-time command such as top, free, or df tells you what the host is doing now. That is valuable during an active problem, but it says little about whether today is normal. Sixty percent CPU could represent comfortable headroom, a new regression, or the quiet part of a workload that reaches saturation every afternoon.
Fixed alerts have a similar limitation. They detect a threshold crossing, not necessarily meaningful deterioration. A disk warning at 90 percent may arrive too late if usage is accelerating, while a short CPU spike at 95 percent may be harmless. Trend-based monitoring adds the context needed to distinguish a temporary event from a developing risk.
Start server trend analysis with a decision
Do not begin by collecting every metric available. Begin with a question that leads to an action. You might need to know whether a server has enough headroom for the next quarter, why a weekly import takes longer, or whether a recent release increased resource cost per request.
The decision determines the data resolution and comparison window. Capacity planning often works with hourly or daily summaries across several months. A recurring fifteen-minute slowdown needs much finer samples around the event. A release comparison should align equivalent traffic and calculate resource use per unit of work rather than compare unrelated daily averages.
- Capacity question: when will current growth consume the safe operating margin?
- Reliability question: which condition tends to appear before failures or degraded service?
- Efficiency question: is each request, query, backup, or batch item becoming more expensive?
- Change question: did a deployment, configuration update, or new job alter the baseline?
Collect a balanced set of infrastructure signals
Useful infrastructure trends monitoring covers demand, capacity, and service impact. CPU utilization without run-queue demand can mislead. Memory use without reclaim, swap, or out-of-memory events can exaggerate risk because Linux intentionally uses available memory for cache. Disk capacity without growth rate gives no indication of urgency.
Start with a compact set of signals that you can collect consistently:
- CPU: user and system time, I/O wait, steal time, load average, run queue, and throttling.
- Memory: available memory, cache, swap activity, reclaim pressure, and OOM events.
- Storage: filesystem use, inode use, growth rate, latency, throughput, and device errors.
- Network: traffic volume, errors, drops, retransmissions, connection count, and latency.
- Application: request rate, response time, error rate, queue depth, and job duration.
- Database: query latency, connections, lock waits, temporary work, cache behavior, and data growth.
Record configuration context alongside the numbers. CPU count, memory size, storage allocation, container limits, software versions, and scheduled workloads can change the meaning of a trend. Without this context, an apparent improvement may simply be the result of a larger instance.
Build baselines from comparable periods
A baseline is not one universal average. Most systems have several normal modes: business hours, overnight processing, weekends, backups, month-end reporting, and seasonal peaks. Combining them can produce a wide range that hides important changes.
Compare like with like. Match Tuesday business hours with previous Tuesdays, or align each backup by its start time and elapsed duration. Use several healthy weeks so one unusual period does not define normal. For each window, keep a typical value, a high percentile, time above the normal band, and the related service result.
Percentiles are often more useful than maximums. A 95th-percentile response time or CPU level describes recurring high demand without letting one brief spike dominate the report. Duration also matters: a stable peak with a busy period expanding from 20 to 50 minutes is still a meaningful change.
Read direction, speed, and acceleration
Every trend has more than a current value. Direction shows whether the metric is rising or falling. Speed shows how much it changes per week or month. Acceleration shows whether the rate of change itself is increasing.
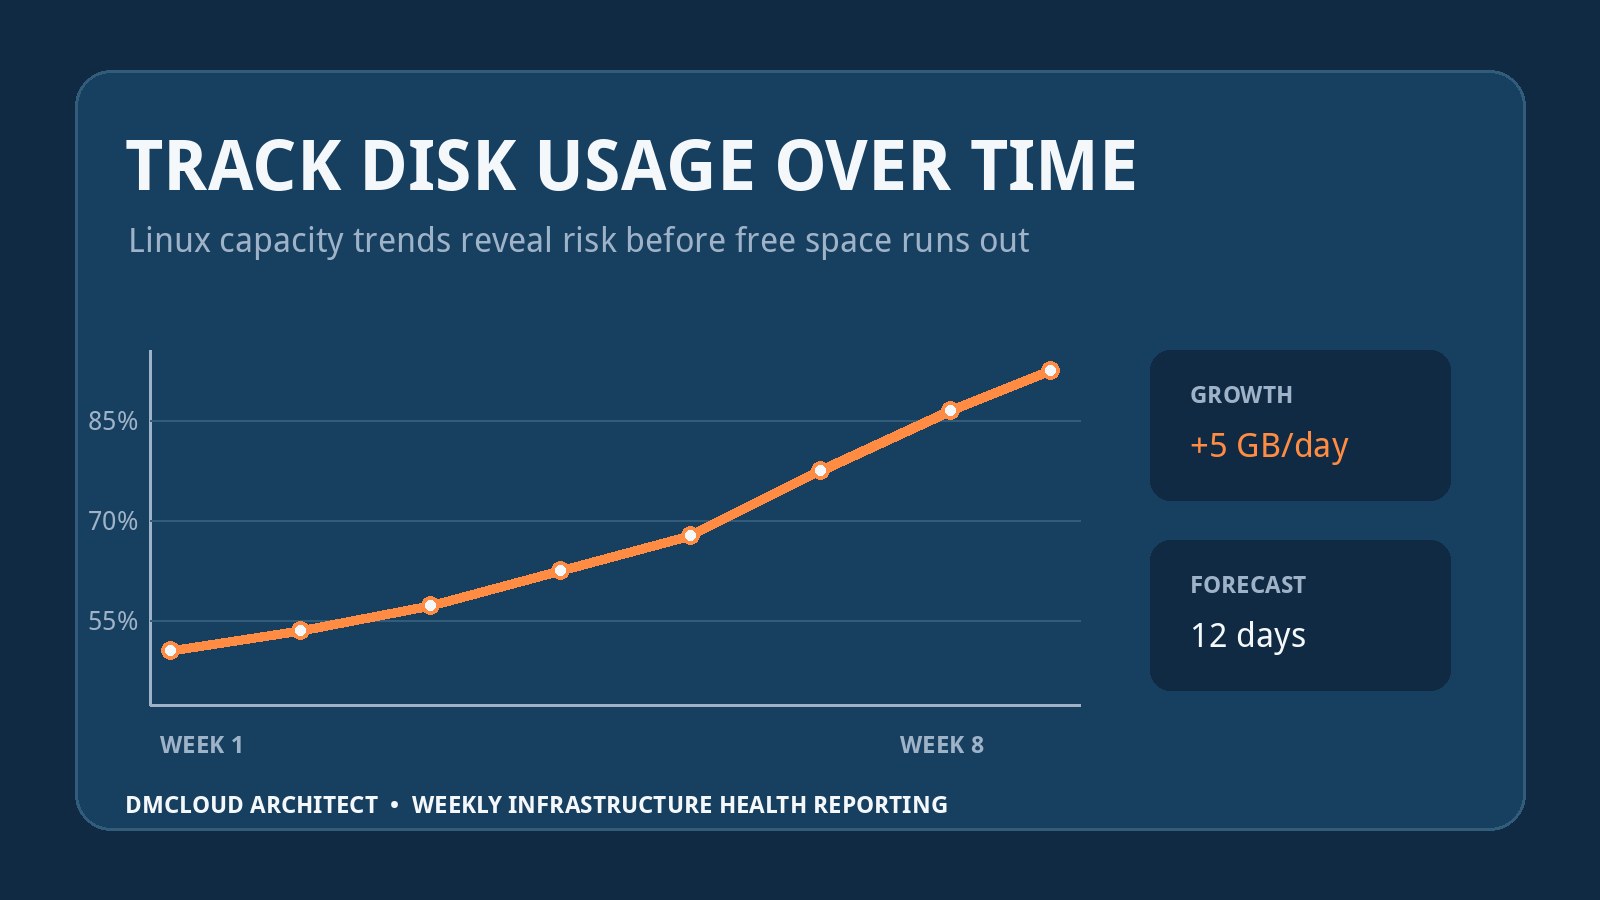
Disk capacity illustrates the difference. A filesystem at 72 percent may be safe if it grows half a percent per month, but urgent if growth accelerated from one to five percentage points per week. Estimate time to a chosen operating limit rather than time to absolute exhaustion, leaving margin for logs, maintenance, temporary files, and workload bursts.
Apply the same reasoning to latency, queue depth, backup duration, and database size. A small but persistent slope can be more actionable than a noisy threshold crossing because it provides time to investigate and plan.
Connect related metrics instead of reviewing them alone
One metric identifies change; related signals help explain it. Rising load with low CPU and higher I/O wait points toward blocked storage work rather than processor shortage. Growing memory use with stable available memory and no swap activity may be ordinary cache behavior. Higher database query latency alongside lock waits and unchanged CPU suggests contention rather than host capacity.
Use a simple sequence for server trend analysis:
- Confirm that the change persists across comparable windows.
- Check whether demand or useful output also changed.
- Review resource pressure and queueing signals.
- Identify the processes, services, queries, or jobs associated with the change.
- Verify whether users or scheduled work experienced a measurable impact.
This prevents expensive conclusions based on correlation alone. A CPU rise after a deployment may be caused by increased traffic rather than inefficient code. Normalizing CPU seconds per thousand requests helps separate healthy growth from declining efficiency.
Use historical server monitoring to detect performance drift
Performance drift is a gradual decline under similar conditions. Response time increases, jobs run longer, or resource cost rises even though traffic and configuration appear stable. Because each weekly change is small, users and operators may adapt until the accumulated effect becomes obvious.
Track workload-normalized measures where possible: CPU time per request, database time per transaction, backup minutes per gigabyte, or memory per worker. Compare these measures around releases, data growth, configuration changes, and dependency updates. A stable workload with rising resource cost deserves investigation before adding capacity.
Common causes include missing indexes as tables grow, retry loops, larger payloads, verbose logging, memory leaks, fragmented storage, lock contention, and background agents competing with customer work. History narrows the search by showing when the drift began and what else changed at that time.
Avoid common trend-monitoring mistakes
Long retention does not guarantee useful analysis. Inconsistent sampling, timezone changes, missing data, renamed fields, and silent collector failures can create false trends. Monitor the collection process itself and mark gaps rather than treating missing values as zero.
Avoid comparing averages across different workload mixes. A quiet weekend can make a weekly mean look better even while weekday performance deteriorates. Do not infer causation from two lines moving together without checking demand, configuration, and process evidence. Finally, avoid universal thresholds copied from another environment; safe ranges depend on the service and its operating margin.
Choose status levels that combine trend and impact
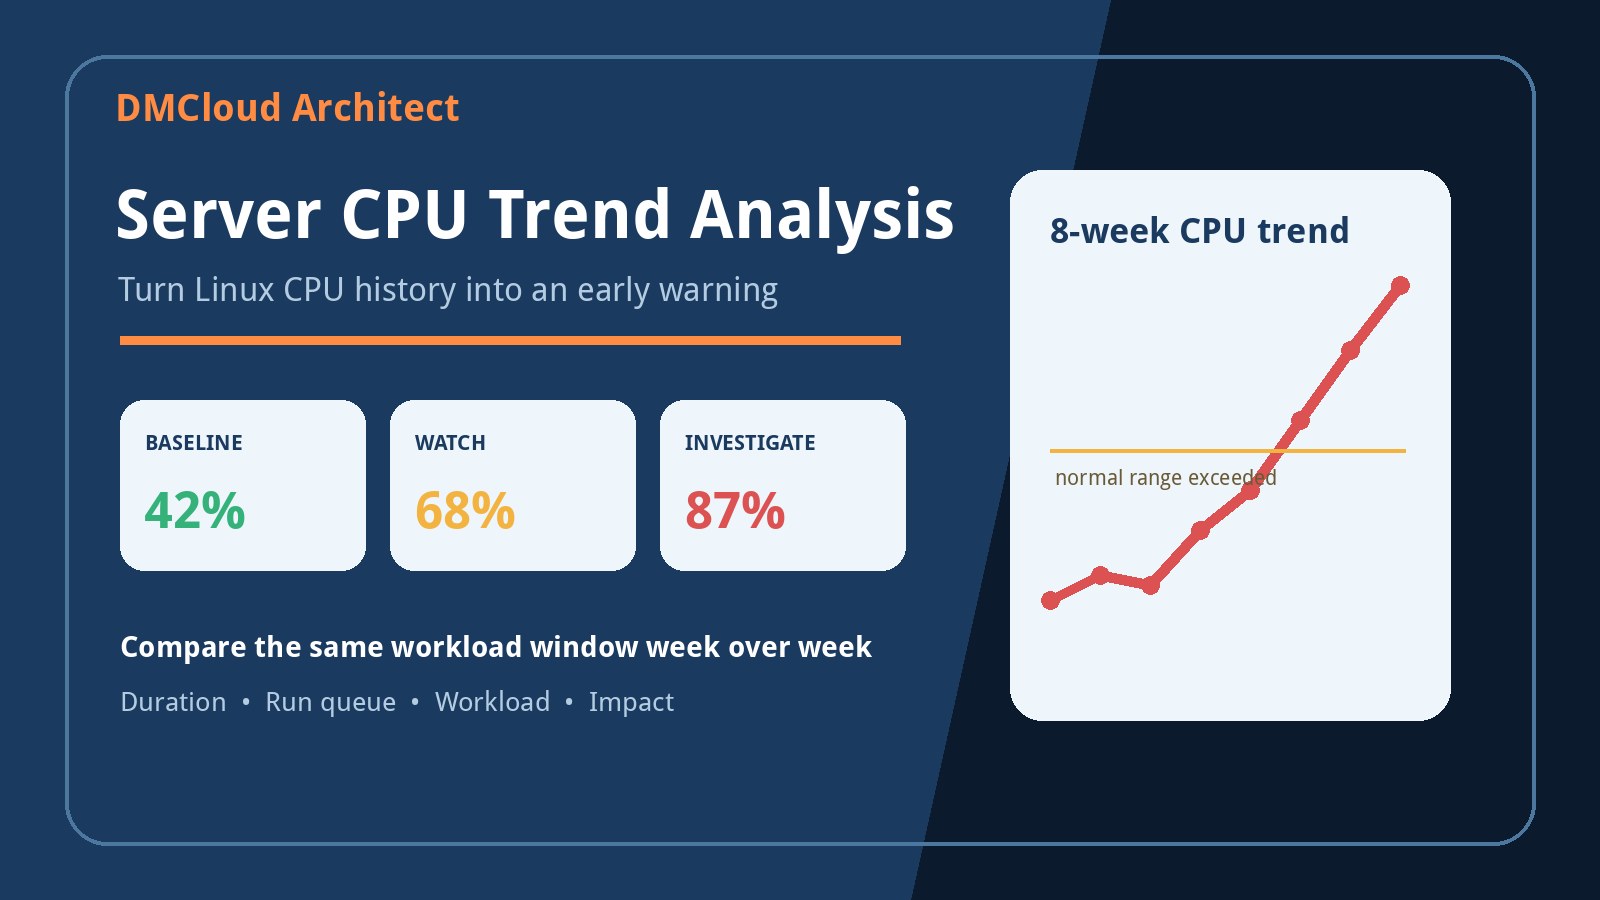
A practical report can summarize each area with a small number of status levels. These should reflect the baseline, duration, rate of change, remaining margin, and service impact rather than one raw number.
- Stable: the metric and workload-normalized measure remain within their expected ranges.
- Watch: a sustained shift is visible, but current service impact and capacity risk are limited.
- Investigate: pressure or declining efficiency aligns with slower work, errors, or reduced reliability.
- Plan: efficiency is stable, but forecast growth will consume the preferred margin within a useful planning horizon.
This approach reduces alert fatigue. Operators can ignore harmless bursts while still seeing a slow-moving problem early enough to act.
Turn performance trend monitoring into a weekly action
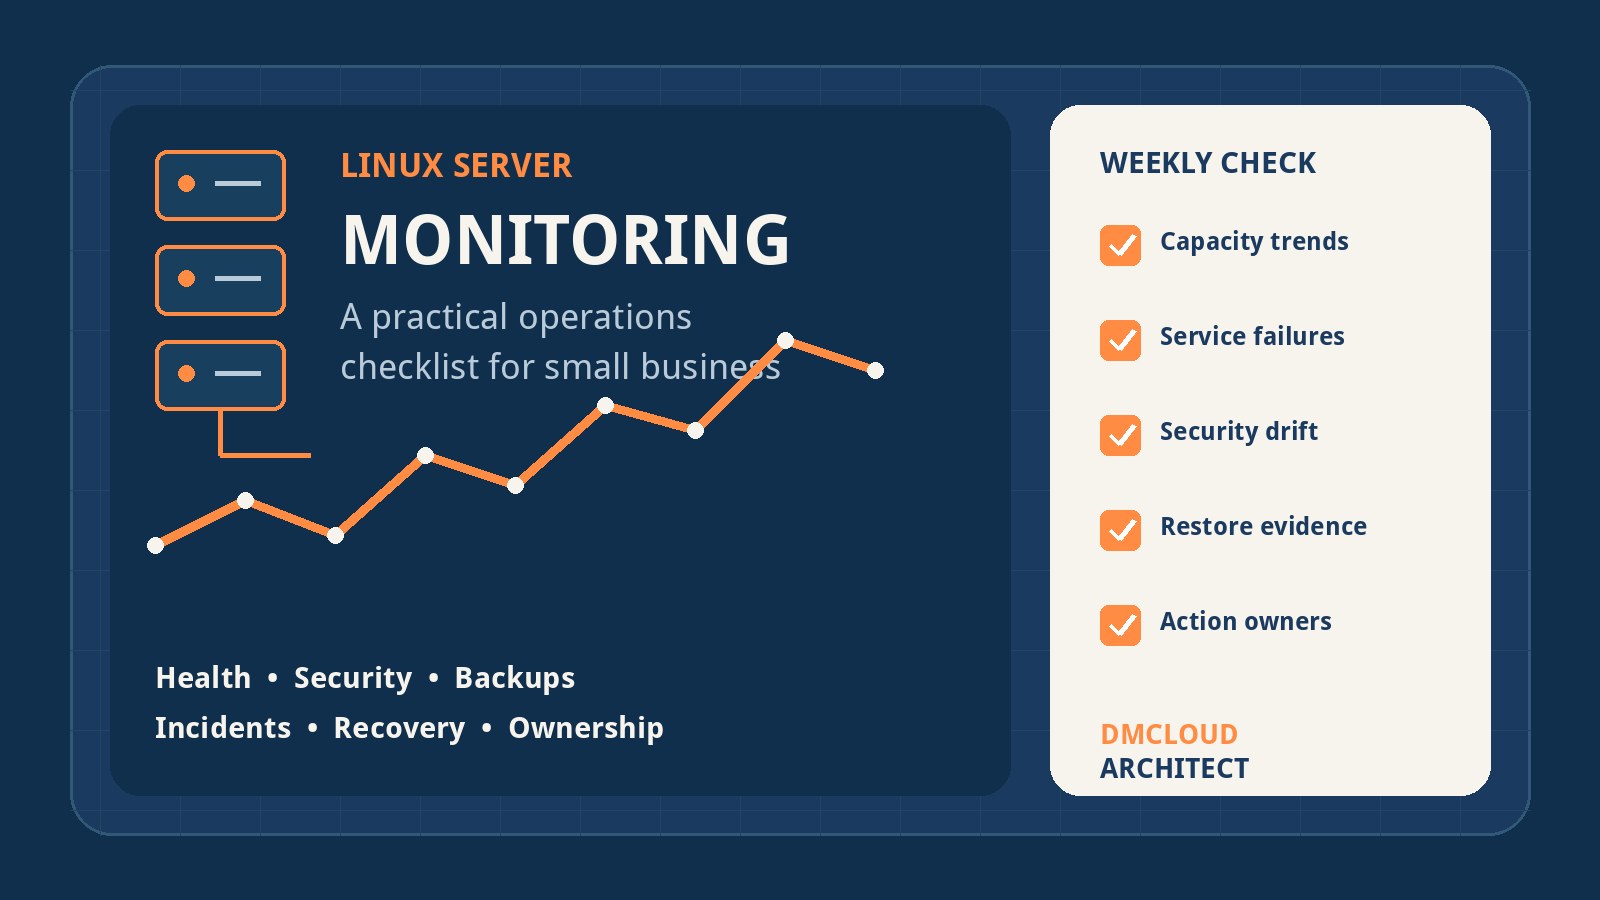
A useful weekly summary should be readable in a few minutes. Lead with what changed and why it matters, provide enough evidence to support the conclusion, and name one owner or next step. Raw measurements can remain available for deeper investigation.
- Status: stable, watch, investigate, or plan.
- Change: the direction and size of the trend across a defined period.
- Context: workload, deployment, configuration, or business event affecting interpretation.
- Impact: response time, job completion, errors, capacity margin, or recovery risk.
- Action: one concrete check, optimization, cleanup, scheduling change, or capacity decision.
For example: “Watch: database storage grew from 61 to 69 percent over eight weeks, and weekly growth accelerated after audit retention changed. At the current rate, the preferred 80 percent limit is about ten weeks away. Confirm retention requirements and archive eligible records before the next review.” That is more useful than a chart with no decision attached.
Server metrics trends checklist
- Define the operational question and possible action before collecting more data.
- Collect demand, capacity, pressure, attribution, and service-impact signals.
- Keep configuration and deployment context with the metric history.
- Compare equivalent workload windows and use several healthy periods as a baseline.
- Review direction, rate of change, acceleration, duration, and remaining margin.
- Normalize resource use against requests, transactions, records, jobs, or data volume.
- Correlate CPU, memory, disk, network, application, and database behavior.
- Check data quality, gaps, timezone consistency, and collector health.
- Summarize the evidence, impact, and one named next action each week.
See developing risks without watching another dashboard
Historical server monitoring becomes valuable when it changes a decision. Consistent collection, comparable baselines, workload normalization, and cross-metric context turn routine measurements into early warnings for capacity loss and performance drift.
DMCloud Architect turns Linux, MySQL, backup, and infrastructure signals into a concise weekly report for developers and small business owners. To see trends, risks, and practical next steps without living in monitoring dashboards, explore Infrastructure Health Reporting.