A Linux server can run normally until a full filesystem suddenly stops writes, breaks a database, or prevents an application from creating temporary files. Simple disk monitoring on Linux gives you enough warning to clean up, extend storage, or correct unexpected growth before customers notice a failure.
You do not need a complex dashboard to get started. A small, well-designed check can cover filesystem capacity, inode exhaustion, mount failures, logging, and useful alert thresholds. The important part is making the check reliable under automation and turning its output into an action rather than another stream of noise.
Start with the Linux disk monitoring commands
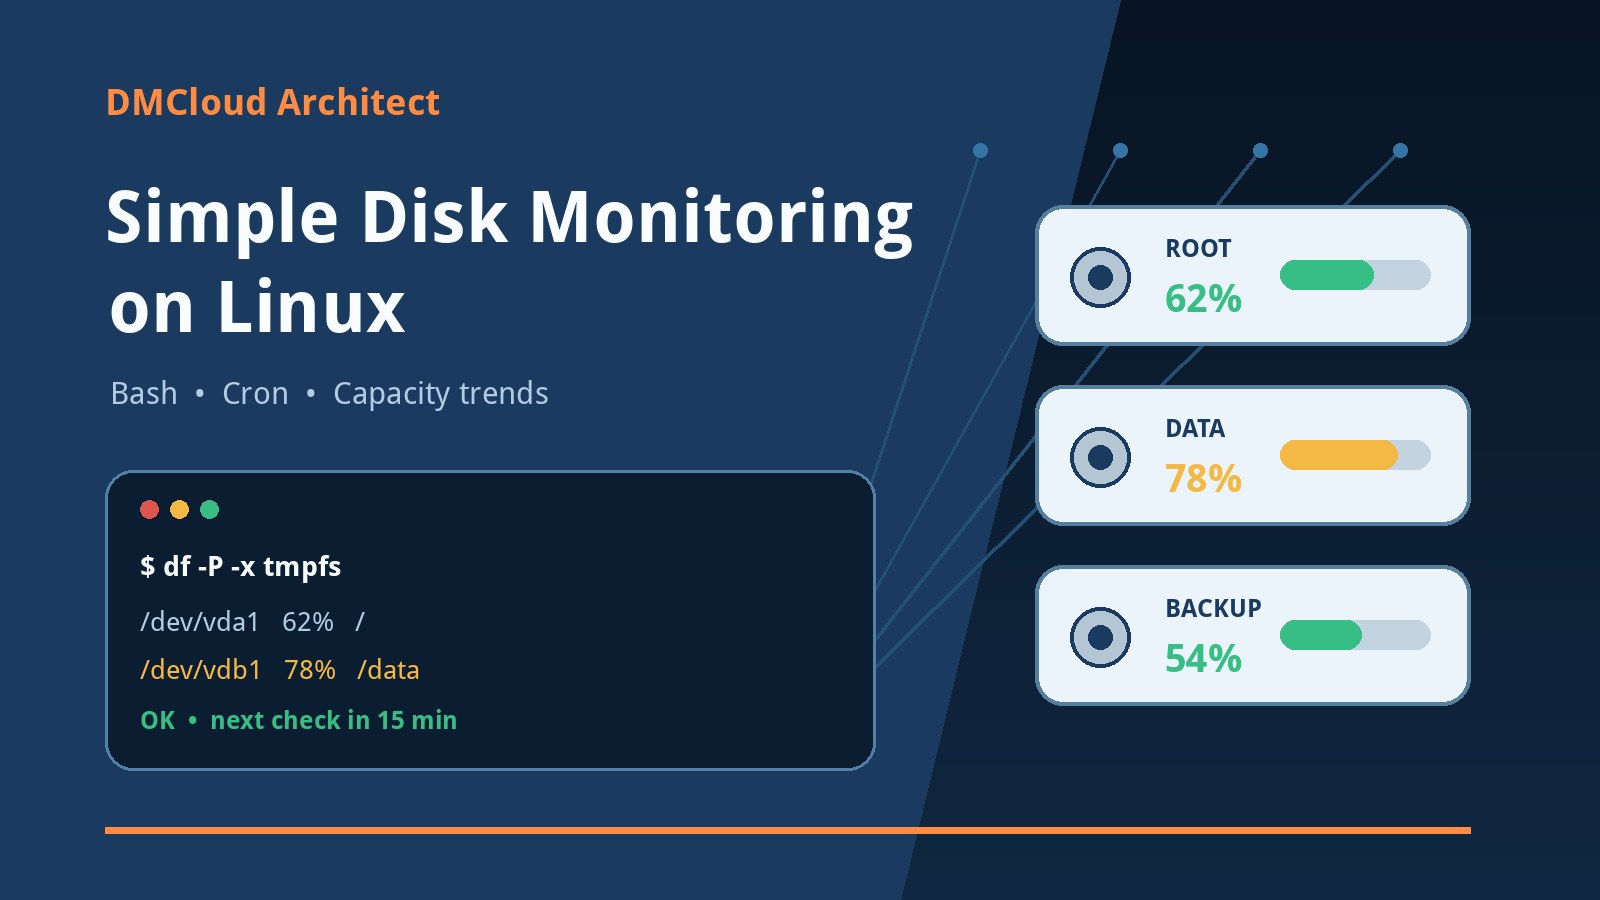
The standard df command reports space used by mounted filesystems. Use df -P for a predictable POSIX-style layout that is easier for scripts to parse, and add -x options to exclude virtual filesystems such as tmpfs and devtmpfs. The human-readable df -h output is useful at a terminal, but raw blocks are safer when a program needs to calculate or store values.
df -P -x tmpfs -x devtmpfs

df -Pi -x tmpfs -x devtmpfs
The second command checks inode use. A filesystem can have free gigabytes and still reject new files if it has no free inodes. This often happens when an application creates millions of small cache, session, queue, or log files. Space and inode checks therefore belong together.
Disk capacity is only one aspect of storage health. Commands such as lsblk show the block-device layout, findmnt confirms mount state, and du helps locate large directories. Tools such as iostat measure latency and throughput, but they answer a different question: whether storage is performing well, not whether a filesystem is becoming full.
Choose thresholds with operating margin
A single universal threshold is rarely ideal. A 95-percent-full 50 GB root filesystem has much less room than a 95-percent-full 20 TB archive. Some filesystems also need working space for updates, temporary files, log rotation, compaction, and recovery operations.
Begin with simple warning and critical levels, then adjust them to the role and growth pattern of each mount. For example, warn at 80 percent and mark critical at 90 percent. Add an absolute-free-space rule for large volumes, and set a lower threshold for root, database, or backup staging filesystems where exhaustion has immediate consequences.
- Percentage used: easy to understand and suitable for a first check.
- Space remaining: prevents a large volume from appearing urgent when it still has substantial room.
- Growth rate: distinguishes stable utilization from a filesystem that may fill within days.
- Operational role: gives important mounts more conservative limits.
- Inode use: catches small-file exhaustion that a capacity-only check misses.
A practical Bash script for disk monitoring
The following Bash script checks local filesystems, reports warning or critical states, and returns a nonzero exit code when attention is required. It uses df -P, skips common virtual mounts, handles mount paths containing spaces through a tab-delimited read, and records both percent used and available 1K blocks.
#!/usr/bin/env bash
set -u

WARN_PERCENT=80
CRIT_PERCENT=90
HOST=$(hostname -f 2>/dev/null || hostname)
NOW=$(date --iso-8601=seconds)
EXIT_CODE=0

printf 'disk_check host=%s time=%s\n' "$HOST" "$NOW"

while IFS=$'\t' read -r filesystem blocks used available capacity mountpoint; do
    percent=${capacity%%%}
    status="OK"

    if (( percent >= CRIT_PERCENT )); then
        status="CRITICAL"
        EXIT_CODE=2
    elif (( percent >= WARN_PERCENT )); then
        status="WARNING"
        (( EXIT_CODE < 1 )) && EXIT_CODE=1
    fi

    printf '%s mount=%q used=%s%% available_kb=%s filesystem=%q\n' \
        "$status" "$mountpoint" "$percent" "$available" "$filesystem"
done < <(
    df -P -x tmpfs -x devtmpfs -x squashfs -x overlay | \
    awk 'NR > 1 {
        mount=$6
        for (i=7; i<=NF; i++) mount=mount " " $i
        printf "%s\t%s\t%s\t%s\t%s\t%s\n", $1,$2,$3,$4,$5,mount
    }'
)

exit "$EXIT_CODE"
Save the file as /usr/local/sbin/check-disk-usage, make it executable, and run it manually before scheduling it:
sudo install -m 0755 check-disk-usage /usr/local/sbin/check-disk-usage
/usr/local/sbin/check-disk-usage
echo $?
An exit code of 0 means all checked filesystems are below the warning level, 1 means at least one warning, and 2 means at least one critical condition. This makes the script useful with cron, systemd, a monitoring agent, or a deployment check.
Add inode monitoring to the Bash script
Reuse the same pattern with df -Pi to monitor inode percentages. Label the output clearly so a person can distinguish a capacity problem from a file-count problem. Inode warning levels can start at the same 80 and 90 percent values, although workloads that create files rapidly may need earlier warnings.
df -Pi -x tmpfs -x devtmpfs -x squashfs -x overlay | \
awk 'NR > 1 {print $1, $5, $6}'
When inode use is high, do not immediately delete files based only on age or extension. First identify the responsible directory and application. Commands such as du --inodes -x -d 2 /var can highlight inode-heavy directory trees on GNU systems. Then verify retention, cache, and cleanup requirements before removing data.
Schedule disk monitoring with cron safely
Test the exact command as the account that will own the scheduled job. Cron provides a smaller environment than an interactive shell, so use absolute paths, set a predictable PATH, and send output to a controlled log or notification process.
PATH=/usr/local/sbin:/usr/local/bin:/usr/sbin:/usr/bin:/sbin:/bin

*/15 * * * * /usr/local/sbin/check-disk-usage >> /var/log/disk-monitor.log 2>&1
Running every fifteen minutes is sufficient for many small servers. Systems with fast-growing uploads, database files, or build artifacts may need shorter intervals, while stable archive volumes may need less frequent checks. The interval should be shorter than the time it could take a filesystem to move from warning to full.
Do not allow the log created by the monitor to become its own disk problem. Configure logrotate, write to the system journal, or retain only structured state changes. If cron emails every successful result, operators may ignore it; reserve notifications for warnings, critical states, recovery, and script failures.
A systemd timer is a useful cron alternative
On a systemd-based server, a service and timer can provide clearer execution history, controlled privileges, and catch-up behavior after downtime. Set OnBootSec and OnUnitActiveSec in a timer, then inspect results with systemctl status and journalctl -u.
Whichever scheduler you choose, monitor the monitor. Record the last successful run and alert when the check has not completed within the expected interval. Silence caused by a broken script, permission change, or disabled cron daemon should not be mistaken for healthy storage.
Handle filesystems and mounts deliberately
Blindly parsing every row from df can produce misleading alerts. Container overlays, read-only package mounts, temporary filesystems, network shares, removable devices, and bind mounts may need separate policies. Decide which mounts are operationally important and keep that decision explicit in configuration.
Network mounts require special care because a stalled server can make a capacity command wait. Use command timeouts where appropriate, or monitor remote storage through its own service. If an expected mount disappears, checking only the parent directory can be dangerous: an application may start writing into the underlying root filesystem instead. Compare current mounts with an expected-mount list and treat a missing critical mount as its own alert.
Find what is consuming space without making things worse
When a warning appears, confirm the affected filesystem and investigate within that boundary. The -x option prevents du from crossing into other mounted filesystems:
sudo du -x -d 1 /var 2>/dev/null | sort -n
sudo find /var/log -xdev -type f -size +500M -printf '%s %p\n' | sort -n
Check deleted files that are still held open with lsof +L1. They continue consuming blocks until the process closes them, even though a normal directory listing cannot see them. Also review journal retention, container images, package caches, database binary logs, backup staging areas, and failed application cleanup jobs.
Avoid emergency commands that delete broad path patterns before you understand ownership and retention requirements. A full disk is disruptive, but removing current database logs, active temporary data, or the only usable backup can create a worse incident. Prefer a documented cleanup action, expansion, or application-specific purge.
Turn disk snapshots into a capacity trend
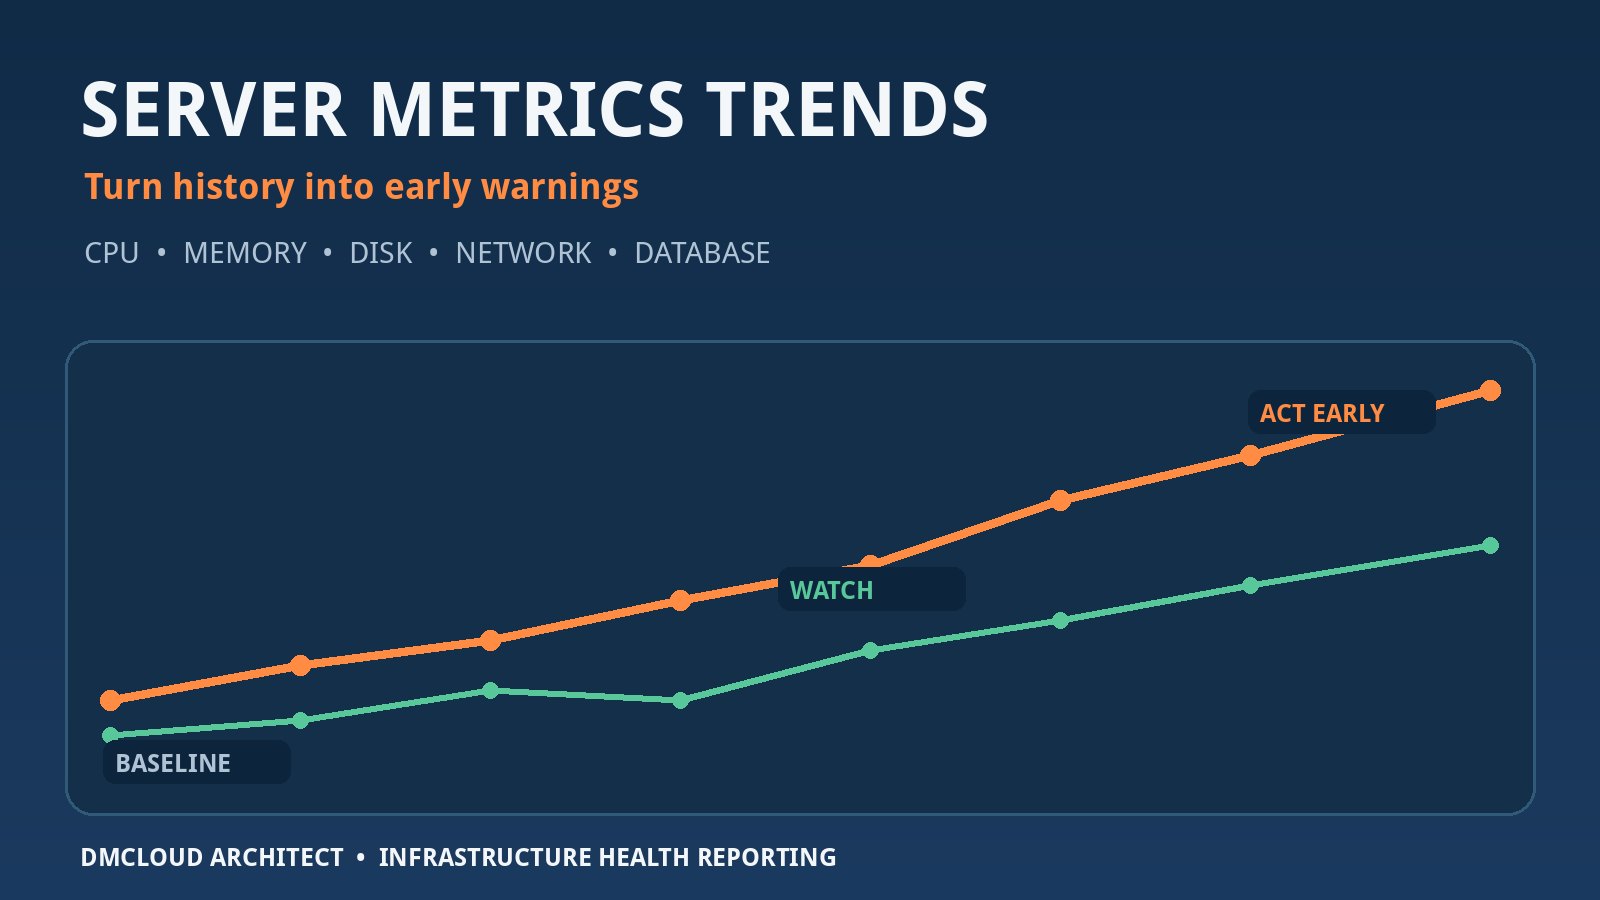
A percentage threshold tells you when a limit has already been approached. A trend tells you how much time remains. Save a timestamp, mount point, total blocks, used blocks, available blocks, and inode use in a stable CSV, JSON, or metrics format. Compare the same values each day or week.
Calculate average growth over several representative periods rather than extrapolating from two noisy samples. Watch for acceleration after a release, logging change, customer import, or backup policy update. Forecast against a preferred operating limit, not absolute 100 percent, so there is time to act.
For example, a data volume at 68 percent may not require immediate cleanup. If it has grown two percentage points each week for a month, however, an 80-percent operating limit is roughly six weeks away. That is a clear planning item. If growth jumps to six points in one day, the same volume becomes an investigation even though it has not crossed the warning threshold.
Keep alerts concise and actionable
A useful disk alert should identify the server, mount, current value, limit, recent growth, and a first investigation step. Include the time of the last successful check. Avoid attaching hundreds of unchanged filesystem rows to every message.
- State: warning, critical, recovered, missing mount, or check failure.
- Evidence: space or inode percentage, free amount, and recent rate of change.
- Context: filesystem role and any recent deployment or retention change.
- Action: inspect a named path, validate cleanup, extend storage, or review retention.
- Owner: the person or team responsible for the next step.
Send a recovery message when utilization returns to a safe range so people know the condition has cleared. Add hysteresis—for example, warn at 80 percent but recover below 77 percent—to prevent repeated state changes near a threshold.
Simple disk monitoring Linux checklist
- Check filesystem capacity with predictable
df -Poutput. - Check inode utilization with
df -Pi. - Exclude or separately configure virtual, container, remote, and read-only filesystems.
- Detect missing mounts instead of checking only whatever is currently mounted.
- Use percentage, absolute-free-space, growth, and filesystem-role rules.
- Return meaningful exit codes and record the last successful execution.
- Use absolute paths and a controlled environment under cron.
- Rotate logs and notify only on actionable state changes.
- Investigate with filesystem boundaries and application retention rules in mind.
- Store consistent history so weekly growth and time-to-limit are visible.
See storage risk before the filesystem is full
A lightweight disk usage script is a good first defense, but its real value comes from reliable automation and historical context. Space, inodes, expected mounts, growth rate, and a clear response process together provide more protection than a noisy threshold alone.
DMCloud Architect turns Linux, MySQL, backup, and storage checks into a concise weekly report for developers and small business owners. To see developing capacity risks and practical next steps without watching another dashboard, explore Infrastructure Health Reporting.