Changing a log or metrics pipeline across several Linux servers is a software delivery problem, even when the artifact is only YAML. A configuration can parse correctly on an administrator’s laptop yet fail on a host with different environment variables, permissions, certificates, disk paths, or network access. A safe rollout therefore needs more than a central editor and a deploy button.
The useful question is not whether a dashboard can distribute a configuration. It is whether the whole workflow can prove what was approved, which hosts received it, whether the pipeline stayed healthy, and how quickly operators can restore the previous version. Use this checklist to evaluate a new management tool or strengthen an existing Ansible, GitOps, or scripted process.
1. Inventory the current pipeline before changing it
Start by recording how each host runs Vector, where its configuration lives, which sources and sinks are active, and how credentials are supplied. Include the installed Vector version, Linux distribution, service manager, container image digest when applicable, configuration path, certificate locations, and destination endpoints. A fleet that looks uniform in an inventory spreadsheet often contains enough differences to break a broad rollout.
- Group hosts by role, environment, operating system, architecture, and network zone.
- Identify business-critical log and metrics routes that must not be interrupted.
- Record who owns each destination and who can approve a pipeline change.
- Capture the current configuration version or checksum on every managed host.
2. Put the configuration in version control
Treat the configuration as code. Store human-readable YAML, supporting files, tests, and documentation in version control. Require a reviewable change rather than allowing an editor to overwrite the only known-good copy. Each deployment candidate should resolve to an immutable commit, release, or content digest.
A label such as production-latest is convenient but weak evidence because its meaning can change. Record both a friendly release name and an immutable identifier. The management system should preserve the author, reviewer, timestamp, change description, and exact content deployed.
3. Separate configuration from secrets
Do not place reusable credentials, private keys, or destination tokens directly in the shared YAML repository or management database. Reference secrets through an approved secret store, protected environment file, or workload identity. Confirm that previews, diffs, agent logs, support bundles, and rollback archives cannot expose secret values.
Before adopting a management dashboard, document its trust boundary. Determine whether it stores configuration only, receives telemetry, proxies data, or can read destination credentials. Least privilege is easier to verify when configuration delivery and the actual log or metrics data path remain separate.
4. Validate syntax and topology before deployment
Run the validator provided by the same Vector version used on the target hosts. Validation should load all referenced files and account for the environment values available to the service. Also check the pipeline logic: inputs should reach intended outputs, transformations should not silently discard required events, and every sink should have the expected encoding and authentication settings.
# Example only: adapt paths and options to the installed Vector release
vector validate /etc/vector/vector.yaml
systemctl cat vector
systemctl show vector --property=Environment --property=EnvironmentFiles
Syntax validation is necessary, not sufficient. It cannot prove that a remote endpoint is reachable, credentials are valid, a certificate chain is trusted, or the destination will accept the event format.
5. Test with representative sample events
Create safe fixtures that represent normal traffic, malformed records, unusually large messages, missing fields, multiline logs, and sensitive fields that should be removed. Verify expected routing, parsing, enrichment, filtering, and redaction. Avoid copying real customer records into a development environment unless the data has been approved and sanitized.
Define expected results before the test. A pipeline that produces some output is not necessarily correct. Count accepted, rejected, transformed, and dropped events, and verify that timestamps, host identity, severity, and routing labels survive as intended.
6. Choose a representative canary host
The easiest host is often a poor canary. Select a host that resembles the wider rollout group in operating system, Vector version, service configuration, workload, traffic volume, network path, and destination access. It should carry enough realistic traffic to expose problems without creating unacceptable business risk.
Keep the canary population explicit. A management tool should show why each device belongs to a rollout group and prevent an accidental “select all” deployment. For heterogeneous fleets, use one canary per meaningful host class rather than assuming one success represents every server.
7. Define health gates before starting
Decide what must remain true during the canary period. Useful gates include service availability, configuration load success, source throughput, sink acknowledgements, retry volume, dropped events, buffer use, CPU, memory, disk growth, and destination-side ingestion. Give each gate a threshold and observation period.
- No unexpected service restarts or failed units.
- No sustained increase in rejected, dropped, or retried events.
- No material gap between source input and acknowledged output.
- No unsafe growth in disk buffers or filesystem utilization.
- No regression in host load, memory pressure, or application latency.
A dashboard should not call a rollout healthy merely because an agent downloaded a file. Delivery, activation, and runtime health are separate states.
8. Verify desired version, reported version, and running state
For every host, track at least three facts: the version requested by the controller, the version reported by the agent, and evidence that the running Vector process loaded that version. A matching filename is weak evidence. Prefer a content hash or immutable release ID tied to a successful reload and a timestamp.
Make stale status visible. If a host has not checked in recently, the system should report it as unknown or offline rather than compliant. Also distinguish hosts intentionally excluded from a rollout from hosts that failed to receive it.
9. Roll out in bounded stages
After the canary passes its observation window, expand gradually: a small percentage, one non-critical group, one availability zone, or one business unit at a time. Set concurrency and failure limits so one bad configuration cannot restart or disconnect the entire fleet simultaneously.
Pause automatically when a health gate fails or status becomes ambiguous. Operators should be able to see the exact scope completed, in progress, skipped, and failed before deciding whether to continue.
10. Make rollback a tested deployment
Rollback should select a known-good immutable version and pass through the same controlled delivery mechanism. Test it before production so you know the previous configuration, referenced secrets, certificates, and destination assumptions still work. Retaining an old YAML file is not enough if its external dependencies have changed.
Define both automatic and manual rollback triggers. Automatic rollback can limit damage when signals are unambiguous, while manual approval may be safer when event volume changes naturally or destination-side incidents create misleading symptoms.
11. Keep an auditable deployment record
For each rollout, retain the approved diff, immutable version, affected hosts, initiator, approver, timestamps, validation results, canary evidence, stage transitions, failures, and rollback outcome. This record is useful for incident response and for proving that an apparent data gap did not begin with a configuration deployment.
If a new dashboard duplicates deployment capabilities already provided by Ansible or another tool, ask whether it integrates with the existing source of truth or creates a second one. A specialized interface can add value through visualization and drift reporting, but competing control planes create ambiguity about which system owns the host.
12. Connect rollout evidence to Linux server monitoring
Linux server monitoring provides the host-level context that configuration status alone cannot. Compare service state, CPU load, memory pressure, disk and inode use, network connectivity, recent errors, and application health before and after each rollout stage. This helps separate a bad pipeline change from an unrelated host or destination incident.
systemctl is-active vector
systemctl --failed --no-pager
journalctl -u vector --since "30 minutes ago" --no-pager
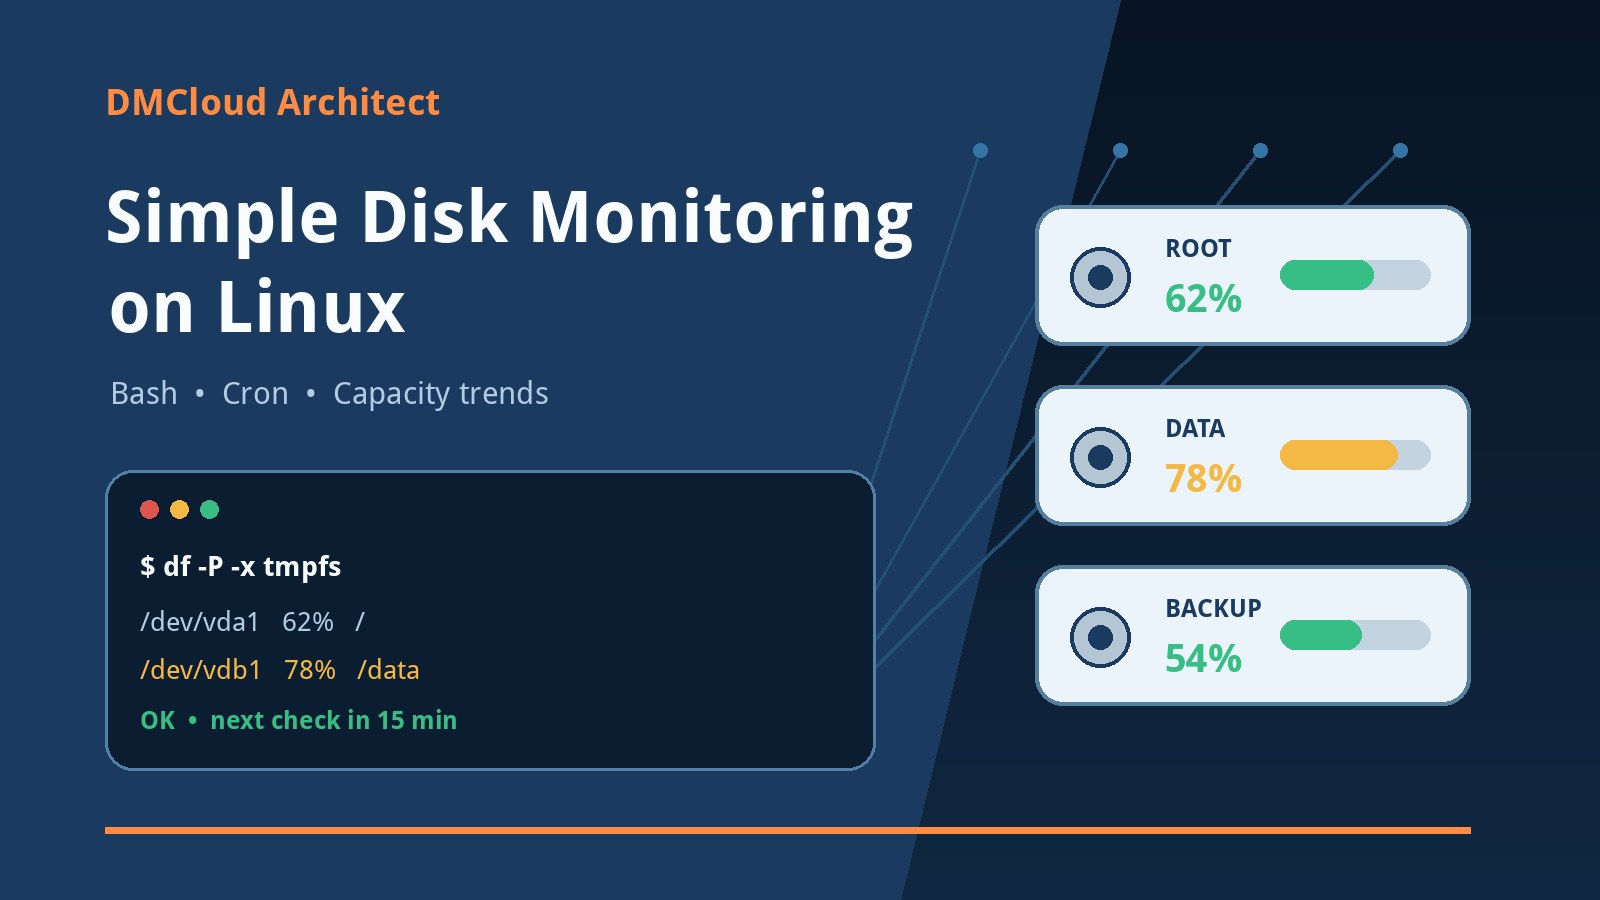
df -hT
df -i
ss -ntp
Use commands that fit your distribution, permissions, and installed release. Automate collection where possible, but keep the evidence understandable enough that a developer or small-business operator can explain why the rollout continued or stopped.
What to require before adopting a fleet dashboard
A useful evaluation should include a disposable test environment and a failure demonstration, not only a polished happy path. Ask the vendor or project to show an invalid configuration, an offline host, a partially completed stage, stale agent status, destination failure, secret redaction, audit export, and rollback. Review the update and security model for both controller and agent.
- Can the tool integrate with version control and existing automation?
- Does it identify every deployed artifact with an immutable digest?
- Can access be limited by environment, host group, and action?
- Are controller-to-agent communications authenticated and encrypted?
- What happens when the controller is unavailable?
- Can deployment history and status be exported without platform lock-in?
- Does the tool clearly distinguish delivered, activated, healthy, stale, and failed?
A practical rollout standard
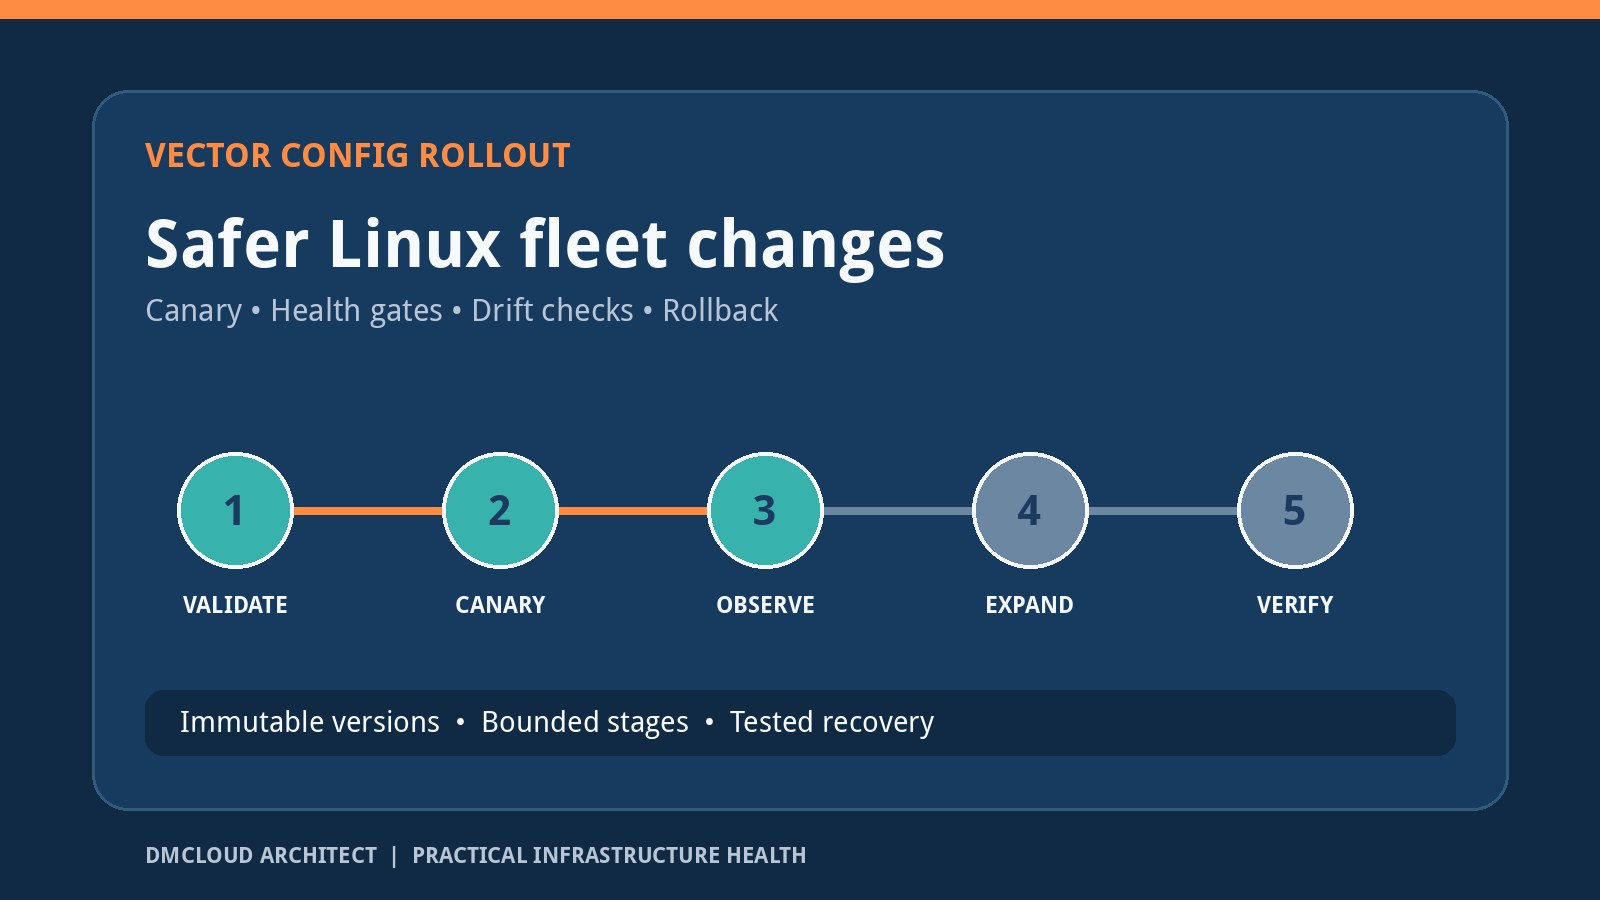
The safest process is simple to state: review an immutable change, validate it, test representative events, deploy to a representative canary, observe predefined health gates, expand in bounded stages, and retain a known-good rollback. Whether the delivery mechanism is a dashboard, Ansible, GitOps, or a script matters less than preserving those controls.
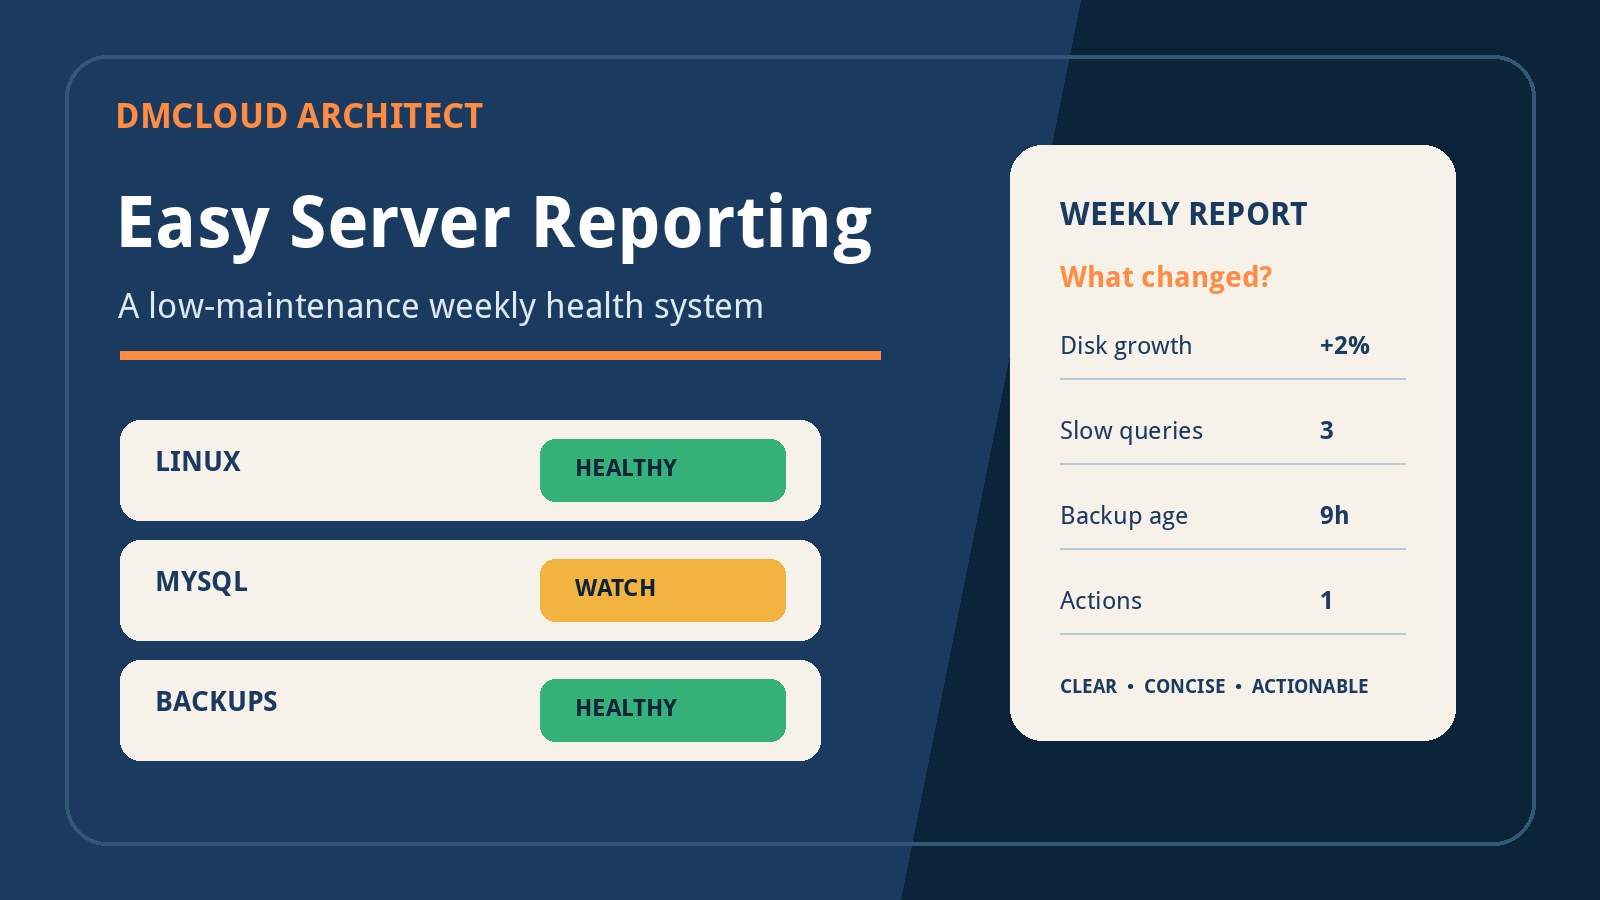
For small fleets, this does not need to become a large platform project. A Git repository, a controlled deployment job, checksums, a canary group, and a concise weekly health report can provide strong evidence with low operational overhead. Add a specialized dashboard only when it reduces ambiguity rather than creating another source of truth.
Want weekly infrastructure checks without dashboard fatigue?
DMCloud Architect turns Linux and MySQL health signals into practical weekly reports, helping you spot service failures, resource pressure, and configuration-related drift before they become outages.
Get the free starter plan for weekly infrastructure health reports.