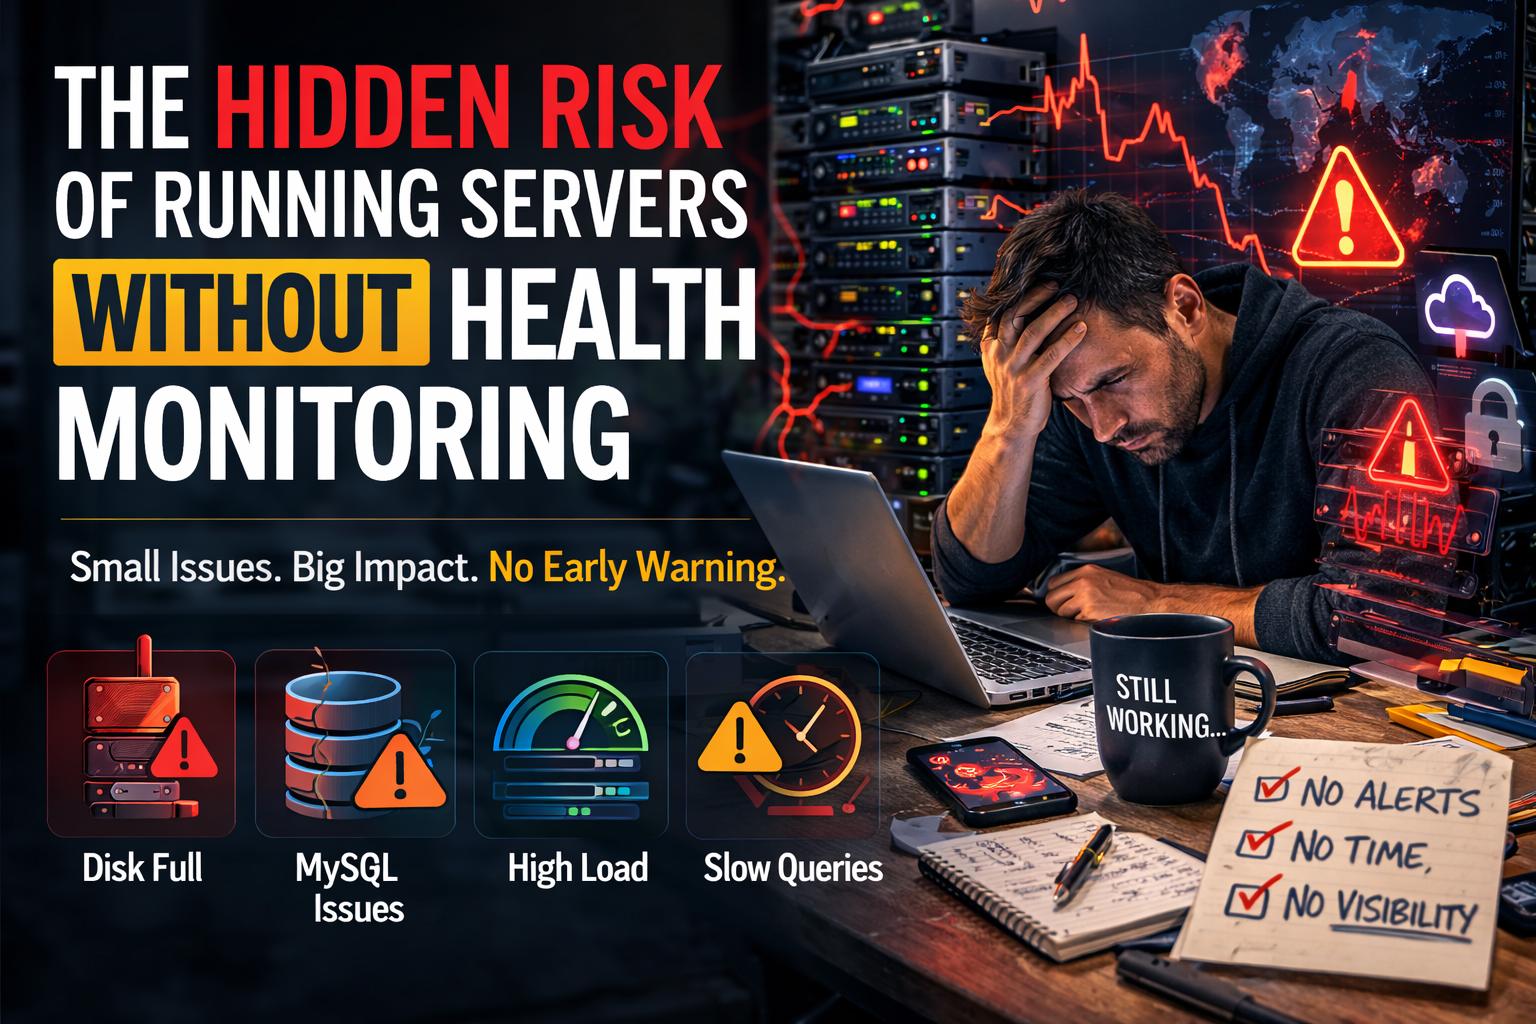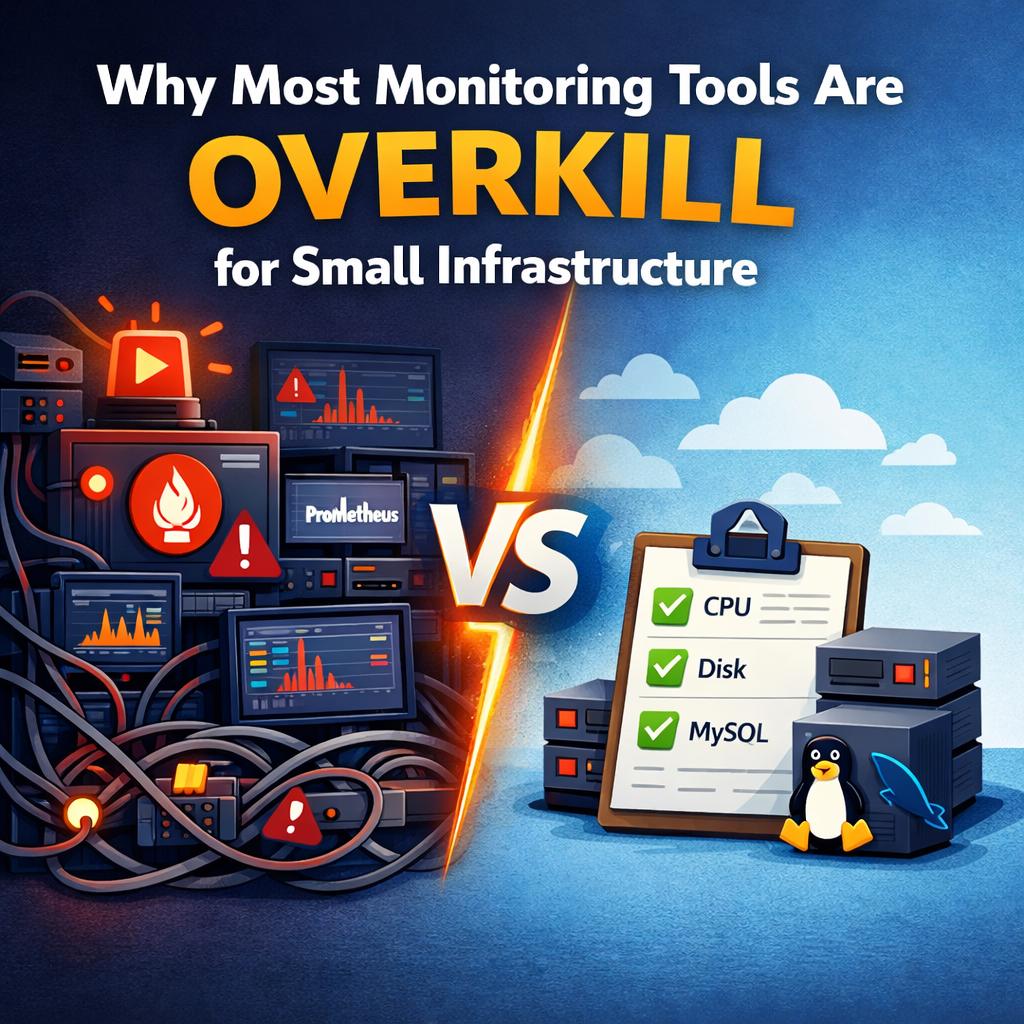
Why Most Monitoring Tools Are Overkill for Small Infrastructure
Modern infrastructure monitoring tools are incredibly powerful. Platforms like Prometheus, Grafana, and other enterprise monitoring stacks provide deep visibility into systems and applications.
But there is a hidden problem.
Most of these tools were designed for large engineering teams managing hundreds or thousands of servers.
If you are running a small production environment, a personal SaaS project, or a handful of Linux servers, these tools can quickly become more work than benefit.
In many cases, the monitoring system becomes another system that needs to be monitored.
The Reality of Small Infrastructure
Many developers and small businesses operate environments that look like this:
-
1–5 Linux servers
-
a small MySQL database
-
a web application or API
-
occasional batch jobs or scheduled tasks
This infrastructure is important. It may run a business, serve customers, or support internal operations.
However, it does not require the same monitoring complexity used by large cloud-scale organizations.
Instead of clarity, large monitoring stacks often introduce:
-
complicated configuration
-
many moving parts
-
constant alert notifications
-
dashboards that require constant tuning
-
additional infrastructure to maintain
What starts as a monitoring solution can quickly turn into another operational burden.
The Hidden Cost of Complex Monitoring Stacks
Setting up enterprise monitoring typically requires several components working together:
-
metrics collectors
-
exporters
-
alert routing
-
dashboards
-
storage for metrics data
Even for experienced engineers, deploying and maintaining this stack can take significant time.
For small teams or solo developers, that time often comes directly out of development or business work.
Common issues include:
Alert fatigue
Systems generate dozens of alerts that are not actionable.
Configuration overhead
Monitoring requires constant tuning as systems evolve.
Infrastructure maintenance
The monitoring platform itself becomes another system to patch, scale, and troubleshoot.
In the end, many small teams end up ignoring alerts entirely or disabling parts of the monitoring system.
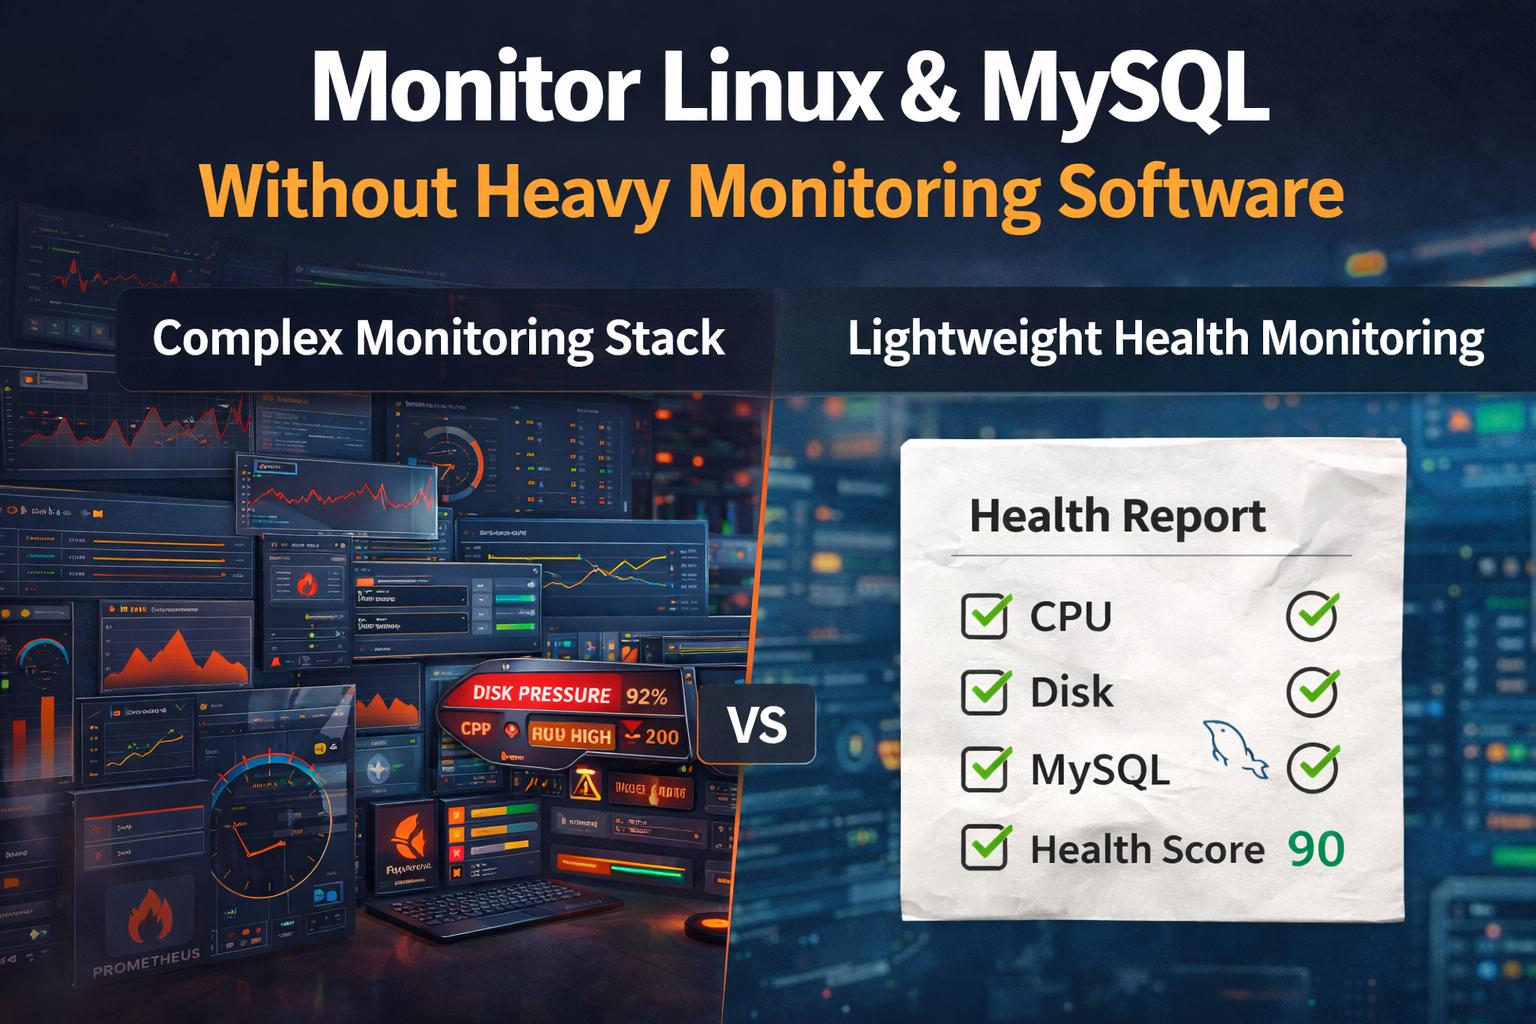
Small Infrastructure Needs a Different Approach
Instead of full-scale observability platforms, smaller environments benefit from something simpler:
Infrastructure health monitoring.
Rather than collecting millions of metrics every minute, the goal becomes identifying the signals that matter most:
-
CPU pressure
-
disk usage trends
-
memory pressure
-
abnormal load
-
MySQL performance indicators
-
replication status
-
slow query activity
These indicators can reveal most operational problems long before they become outages.
A structured health review provides the insight needed without overwhelming the operator.
Monitoring Should Reduce Complexity, Not Add It
Monitoring tools should provide clarity.
But when the monitoring system requires its own architecture, dashboards, and alert routing logic, the original goal is lost.
For many environments, a simpler approach works better:
-
lightweight monitoring
-
minimal configuration
-
clear health signals
-
periodic infrastructure review
This allows developers and administrators to stay aware of system health without maintaining an entire monitoring platform.
A Simpler Alternative for Small Linux and MySQL Environments
This idea led to the creation of DMCloudArchitect Health Monitoring.
The goal is straightforward:
Provide lightweight infrastructure health monitoring for small Linux and MySQL environments without requiring complex monitoring stacks.
Instead of managing dashboards and exporters, the system focuses on identifying meaningful operational signals such as:
-
server resource pressure
-
disk growth risks
-
MySQL performance indicators
-
replication health
-
configuration risks
The result is a clear infrastructure health overview designed for small environments.
When Lightweight Monitoring Makes the Most Sense
A simplified monitoring approach works best for environments such as:
-
small SaaS applications
-
early-stage startups
-
personal projects running in production
-
consultants managing client servers
-
small business infrastructure
In these cases, the priority is awareness and stability, not large-scale observability pipelines.
Final Thoughts
Monitoring is essential for any production environment.
However, the tools used should match the size and complexity of the infrastructure.
For small teams and solo developers, enterprise monitoring platforms often introduce unnecessary complexity.
A lightweight infrastructure health monitoring approach can provide the visibility needed while keeping operations simple.
Try Lightweight Infrastructure Health Monitoring
If you run Linux servers or MySQL databases and want a simple way to monitor infrastructure health without managing a complex monitoring stack, take a look at:
https://health.dmcloudarchitect.com
The platform is designed specifically for small environments that need reliable infrastructure insight without operational overhead.