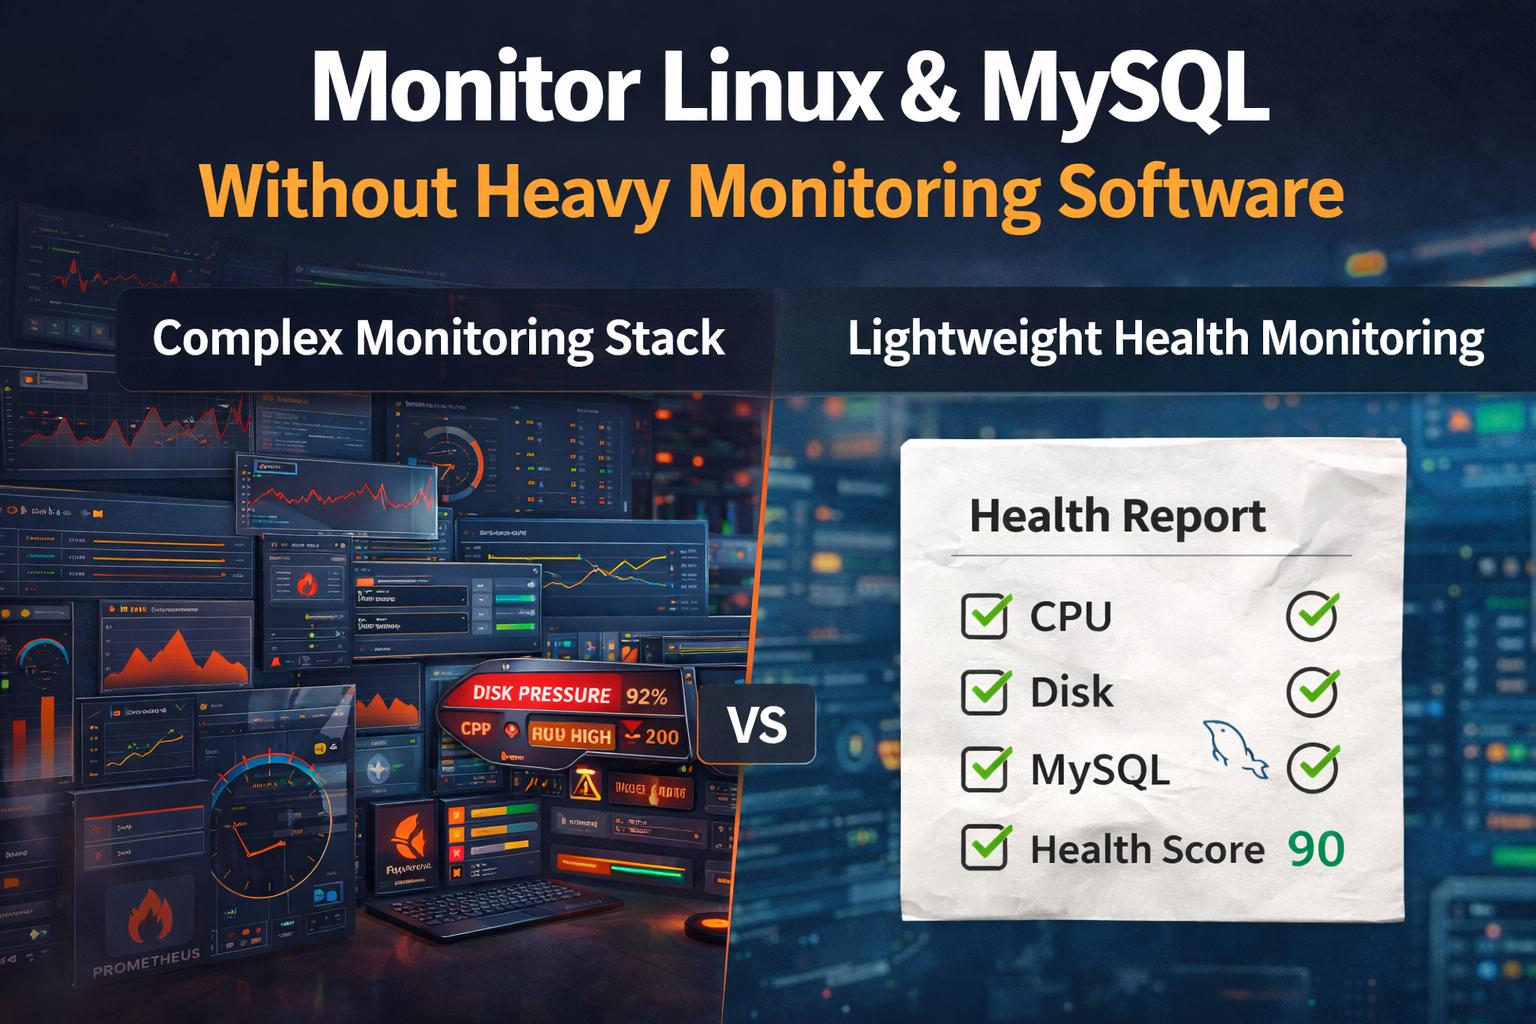
How to Monitor Linux and MySQL Without Installing Heavy Software
Monitoring infrastructure is important.
But maintaining a monitoring system should not become a full-time job.
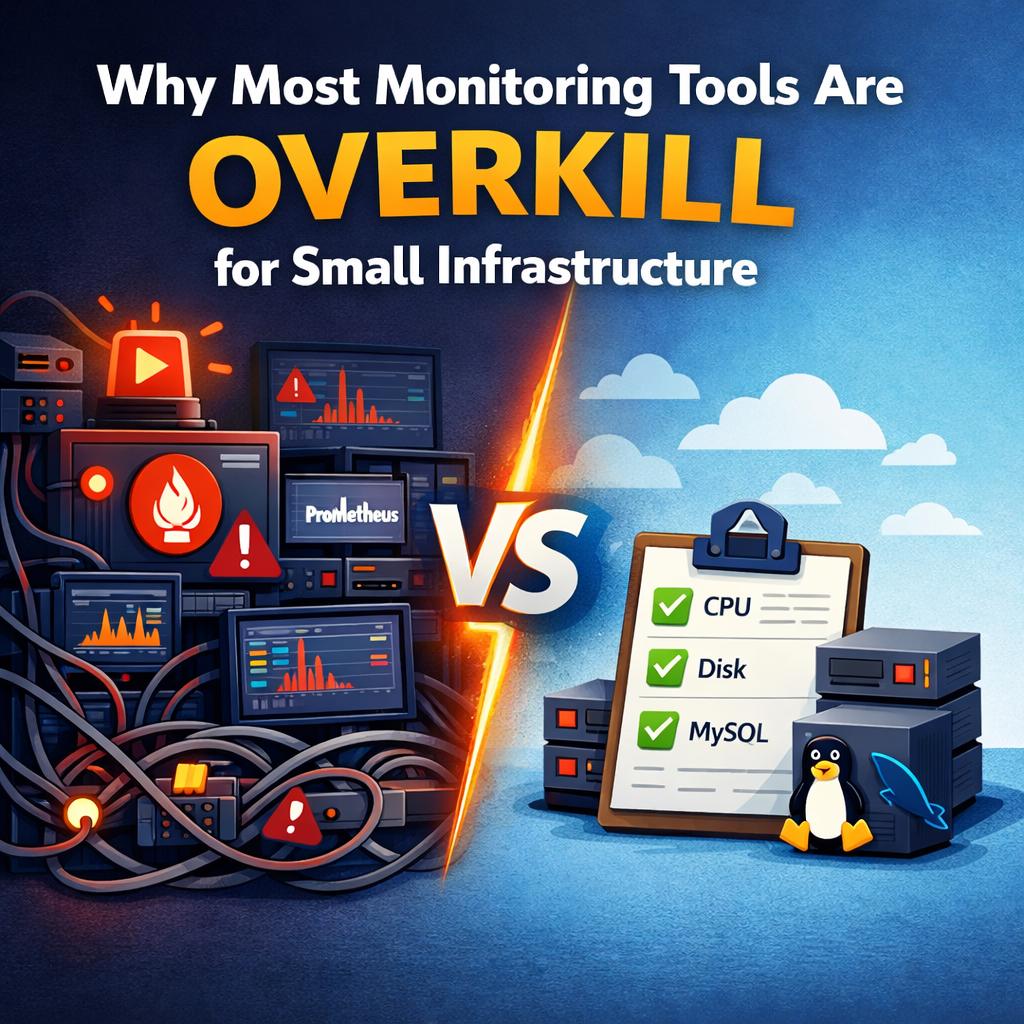
Many monitoring tools were built for organizations running hundreds or thousands of servers. These platforms often require complex setups that include multiple services, exporters, dashboards, and alerting pipelines.
For small environments, this complexity is unnecessary.
If you run a few Linux servers and a MySQL database, what you need is visibility into system health, not an entire monitoring architecture.
Why Traditional Monitoring Stacks Become Heavy
Most enterprise monitoring systems are built around a layered architecture:
-
metric collectors
-
exporters
-
alert managers
-
time-series databases
-
dashboards
-
notification pipelines
Each layer adds configuration, maintenance, and operational overhead.
For example, setting up a typical monitoring stack might involve:
-
deploying collectors
-
configuring exporters for Linux and MySQL
-
configuring alert rules
-
maintaining dashboards
-
updating exporters and agents
-
scaling storage for metrics
Large engineering teams benefit from this level of observability.
Small environments usually do not.
The Monitoring Needs of Small Infrastructure
Most small production environments are relatively simple:
-
one or two Linux servers
-
a MySQL database
-
a web application
-
a few scheduled jobs
-
limited operational staff
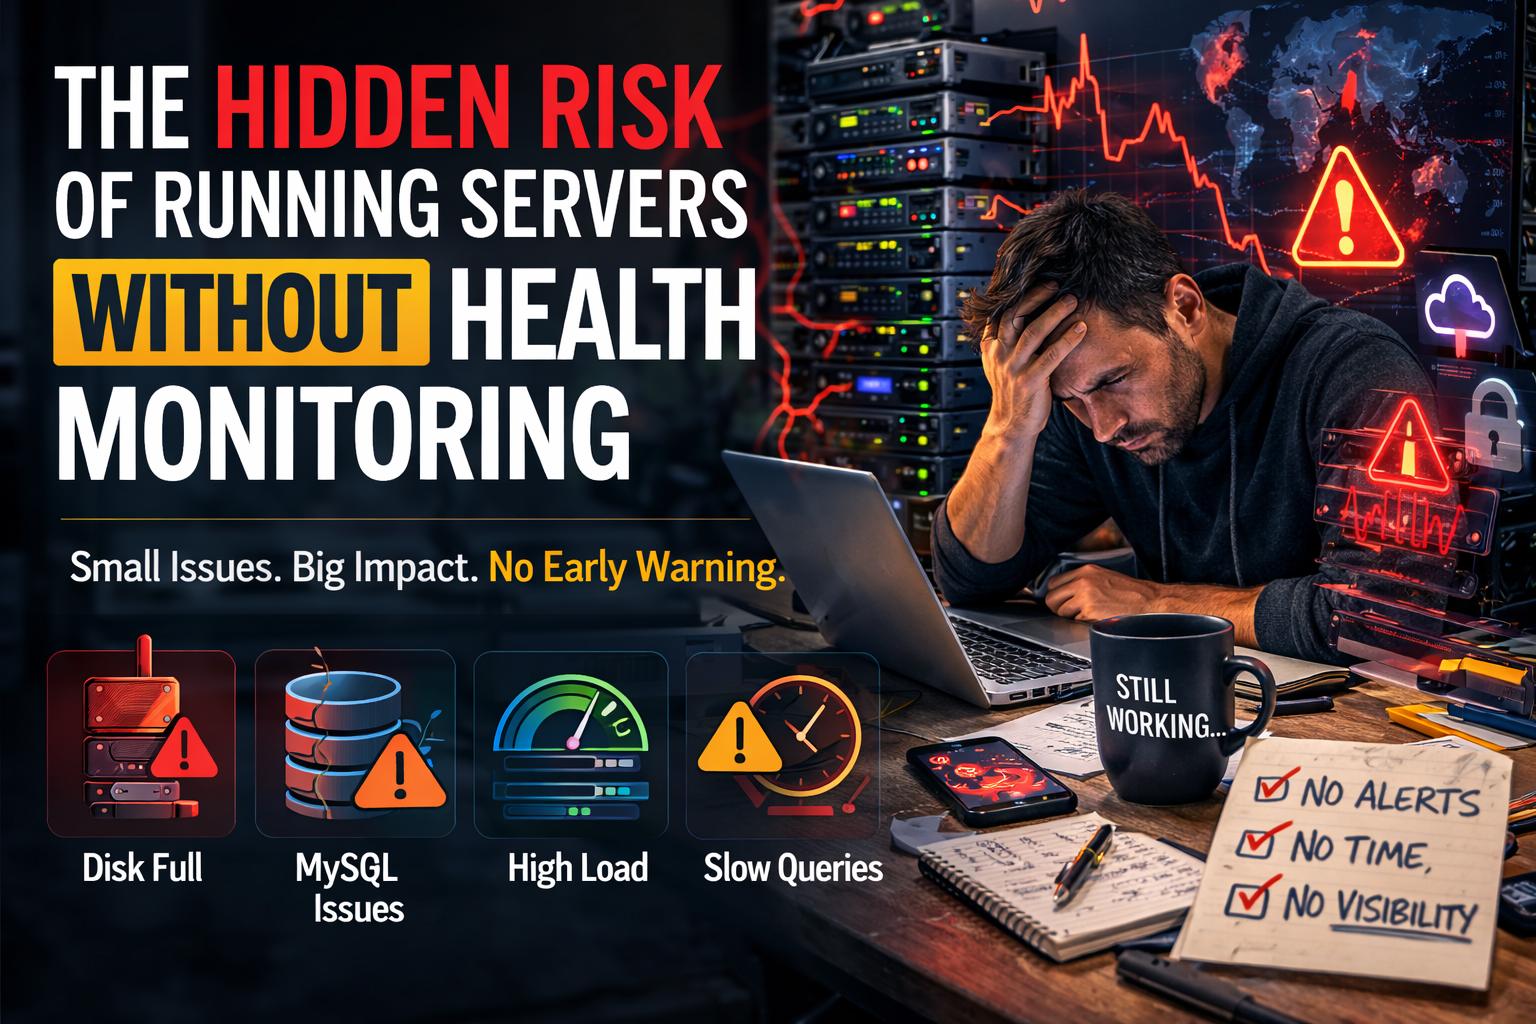
In these environments, operators are usually interested in answering a few critical questions:
-
Is CPU or memory pressure increasing?
-
Is disk space filling up?
-
Is MySQL workload growing?
-
Are slow queries becoming more frequent?
-
Is the system becoming less stable over time?
These signals are enough to detect most problems early.
Collecting millions of metrics per minute is rarely necessary.
Lightweight Monitoring Focuses on Health Signals
Instead of building complex observability pipelines, lightweight monitoring focuses on meaningful infrastructure health indicators.
These indicators typically include:
Server resource health
-
CPU load trends
-
memory usage
-
swap activity
-
disk usage growth
System pressure signals
-
high load conditions
-
memory pressure
-
disk exhaustion risks
MySQL operational health
-
active connections
-
query activity
-
slow queries
-
workload trends
Stability indicators
-
unusual changes in resource usage
-
growing operational pressure
-
degradation patterns
These signals provide early visibility into issues without overwhelming operators with data.
Monitoring Should Be Easy to Install
Another challenge with large monitoring stacks is installation.
Deploying a traditional monitoring platform may require:
-
provisioning monitoring servers
-
configuring storage for metrics
-
installing exporters on each server
-
integrating alert pipelines
-
maintaining dashboards
For a small team or solo developer, that is a large operational investment.
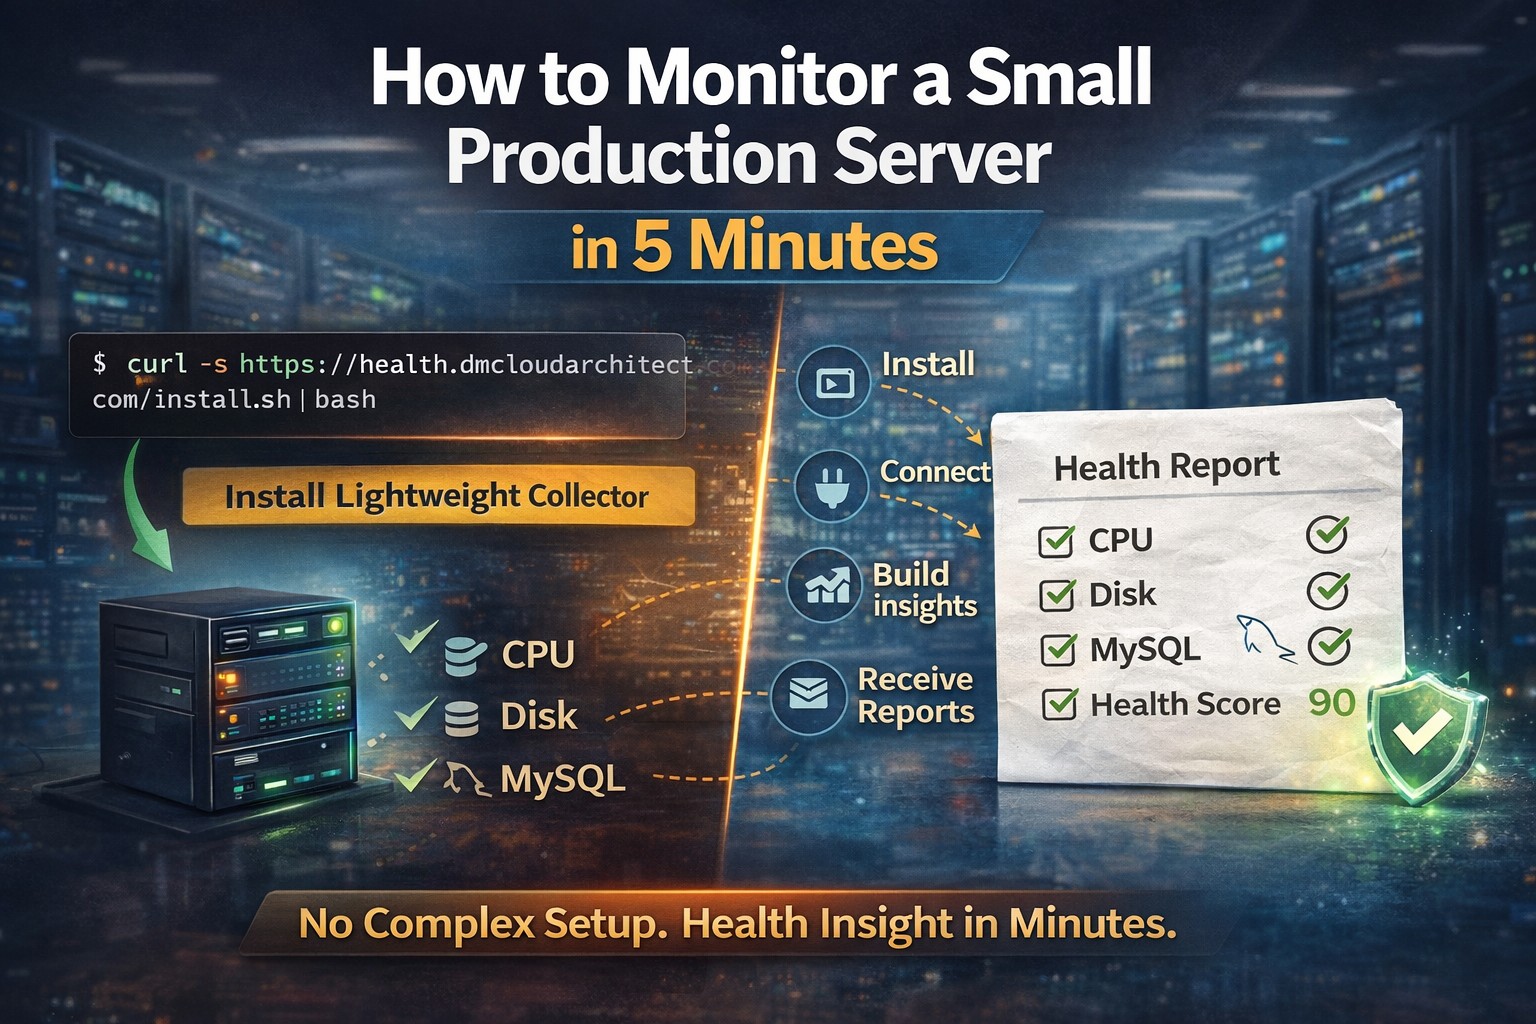
Monitoring should be simple enough to install in minutes, not days.
A Simpler Approach: Infrastructure Health Monitoring
For small Linux and MySQL environments, a simpler model works better:
infrastructure health monitoring.
Instead of real-time dashboards and constant alerts, this approach focuses on:
-
periodic system checks
-
trend analysis
-
structured infrastructure reporting
-
early detection of unhealthy patterns
This gives operators the ability to detect problems before they become outages without managing a large monitoring platform.
Designed for Small Linux and MySQL Environments
This philosophy is exactly what led to the creation of DMCloudArchitect Health.
The platform focuses on lightweight infrastructure health monitoring for Linux and MySQL environments, designed specifically for small teams and solo operators.
Instead of deploying multiple monitoring components, the system focuses on collecting the signals that matter most:
-
server resource pressure
-
disk growth risks
-
MySQL workload patterns
-
slow query behavior
-
infrastructure health trends
The result is a structured health overview that highlights operational risks without creating unnecessary complexity.
When Lightweight Monitoring Makes the Most Sense
Lightweight monitoring works particularly well in environments such as:
-
early-stage SaaS platforms
-
solo developer production servers
-
consulting environments managing client infrastructure
-
small business applications
-
startups running lean infrastructure
These environments benefit from operational visibility but cannot justify maintaining a full monitoring stack.
Final Thoughts
Monitoring should make infrastructure easier to manage, not harder.
Large observability platforms are powerful tools for large engineering organizations. But for small Linux and MySQL environments, they often introduce unnecessary complexity.
A lightweight health monitoring approach provides the operational awareness small teams need while keeping infrastructure management simple.
Try Lightweight Infrastructure Health Monitoring
If you run Linux servers or MySQL databases and want visibility into infrastructure health without deploying a heavy monitoring stack, explore:
https://health.dmcloudarchitect.com
DMCloudArchitect Health provides structured infrastructure health monitoring designed for small environments, helping operators detect issues early and maintain stable production systems.