Most teams don’t struggle with a lack of monitoring tools—they struggle with too much noise. You set up alerts, dashboards, and thresholds, and before long, you’re drowning in notifications that don’t actually help you understand what’s going on.
Here’s the thing: simple Linux monitoring is often far more effective than complex setups. When done right, it gives you a clear view of how your systems behave over time—without the constant interruptions.
Why Simple Monitoring Works Better
Traditional linux server monitoring tends to focus on real-time alerts. CPU spikes? Alert. Disk nearing capacity? Alert. Memory high? Alert. But these signals often come too late—or too often.
Simple monitoring flips the approach. Instead of reacting to events, you focus on trends:
- How CPU usage evolves over days or weeks
- Whether disk usage is slowly creeping up
- If memory pressure is becoming consistent
- When slow queries start increasing
But this is where it matters: problems in infrastructure rarely appear suddenly. They grow quietly over time, like a slow leak.
What You Actually Need to Monitor
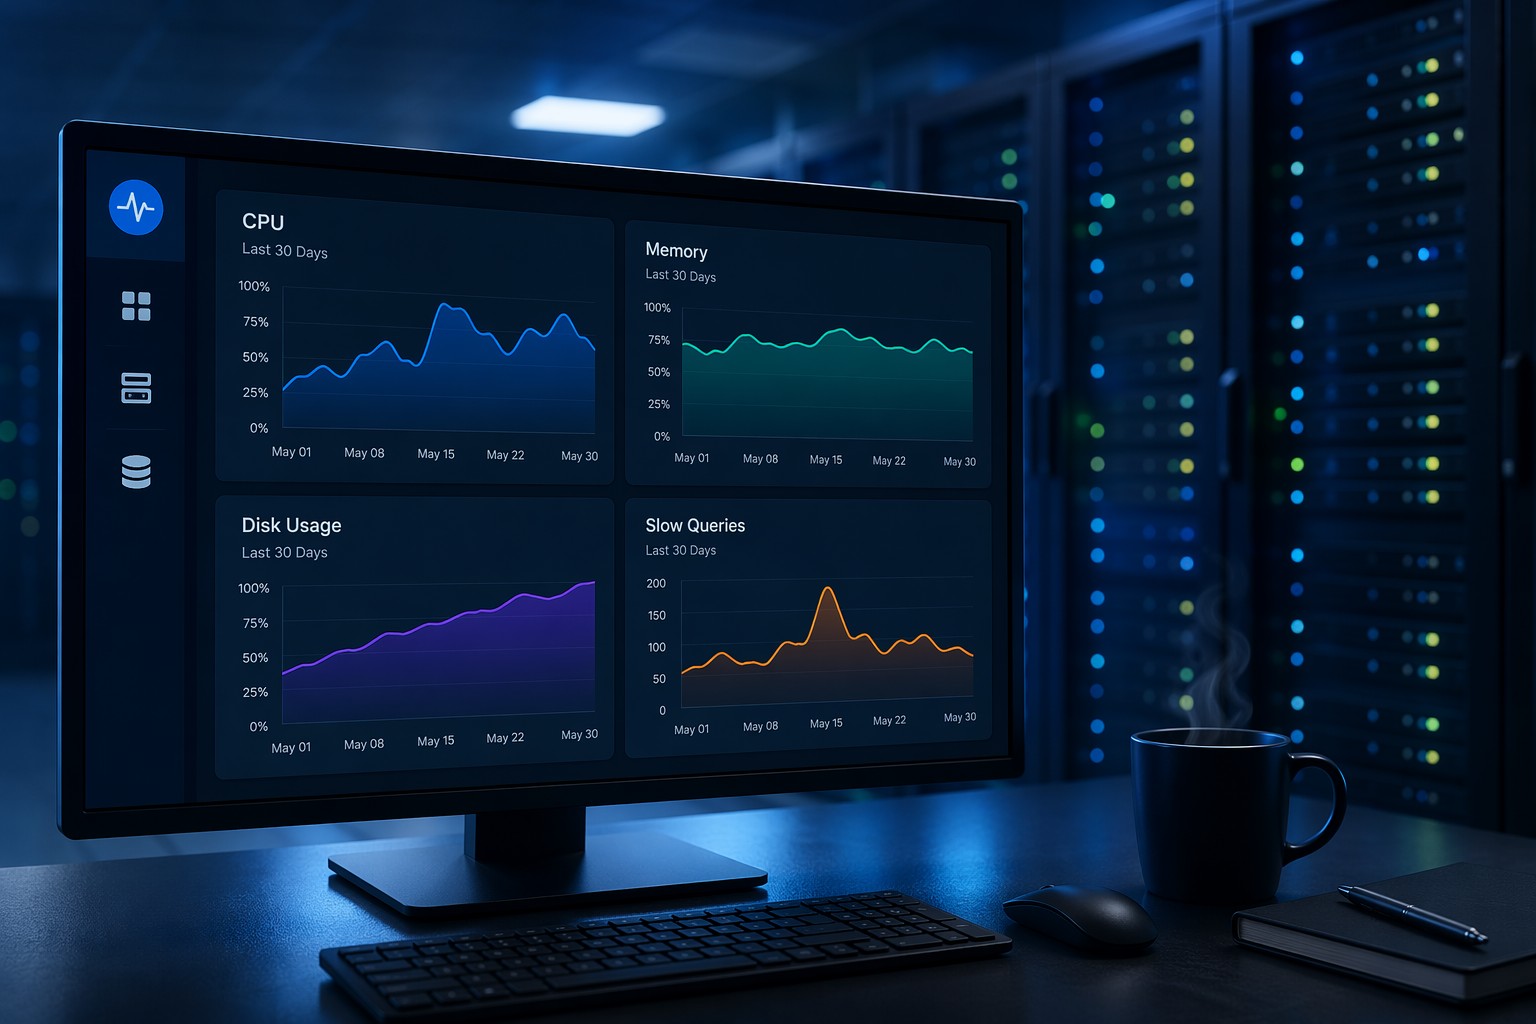
A lightweight linux monitoring setup doesn’t need dozens of metrics. In most cases, a small set of signals gives you 80% of the insight:
CPU Usage
Track average load and spikes over time. A single spike isn’t interesting—but repeated patterns are.
Memory Usage
Watch for gradual increases or constant high utilization. This often points to inefficient processes or leaks.
Disk Usage
One of the most predictable failure points. Disks rarely fill instantly—they grow steadily until something breaks.
Disk I/O
High I/O can signal contention issues even when CPU looks fine.
Application Signals
For example, MySQL slow queries. These often increase before performance issues become visible to users.
Simple Linux Monitoring Setup (Practical Approach)
You don’t need a heavy observability stack to monitor linux server health. A simple setup might include:
- Basic system collectors (CPU, memory, disk)
- Periodic snapshots (every 1–5 minutes)
- Long-term storage for trend analysis
- Clean dashboards focused on time-based views
For example, you can start with tools like:
# CPU and load
uptime

# Memory
free -m

# Disk usage
df -h

# Disk I/O
iostat -x 1
These commands alone already give you raw insight. The real value comes when you collect and visualize them over time.
Real-World Example: The Slow Disk Problem
Imagine a small production server. Everything looks fine day to day—until one morning, the application crashes.
You check the system, and the disk is full.
But if you had a lightweight linux monitoring view, you would have seen this coming:
- Disk usage increasing 2–3% every day
- No cleanup processes running
- Log files growing steadily
Nothing urgent. No alerts triggered. But the trend tells the real story.
So what does this mean in practice? Monitoring isn’t about reacting faster—it’s about seeing earlier.
Choosing the Right Linux Monitoring Tools
There are many linux monitoring tools available, but for simple setups, the goal is clarity, not complexity.
Look for tools that:
- Focus on trends, not just alerts
- Are lightweight and easy to maintain
- Provide historical visibility
- Don’t overwhelm you with configuration
Avoid setups that require constant tuning just to stay usable. If your monitoring system needs as much maintenance as your servers, it’s not helping.
Common Mistakes to Avoid
- Too many alerts: You stop paying attention
- No historical data: You can’t see patterns
- Overcomplicated dashboards: Hard to interpret quickly
- Focusing only on real-time: Missing long-term issues
Simple monitoring isn’t about doing less—it’s about focusing on what actually matters.
Summary
Simple linux monitoring gives you something most tools don’t: clarity. Instead of reacting to noise, you start understanding how your systems behave over time.
And once you see trends clearly, problems stop being surprises.
If you want a practical way to move beyond alerts and start seeing real infrastructure patterns, take a look at Infrastructure Health Reporting. It’s designed to give you exactly that kind of visibility without adding complexity.