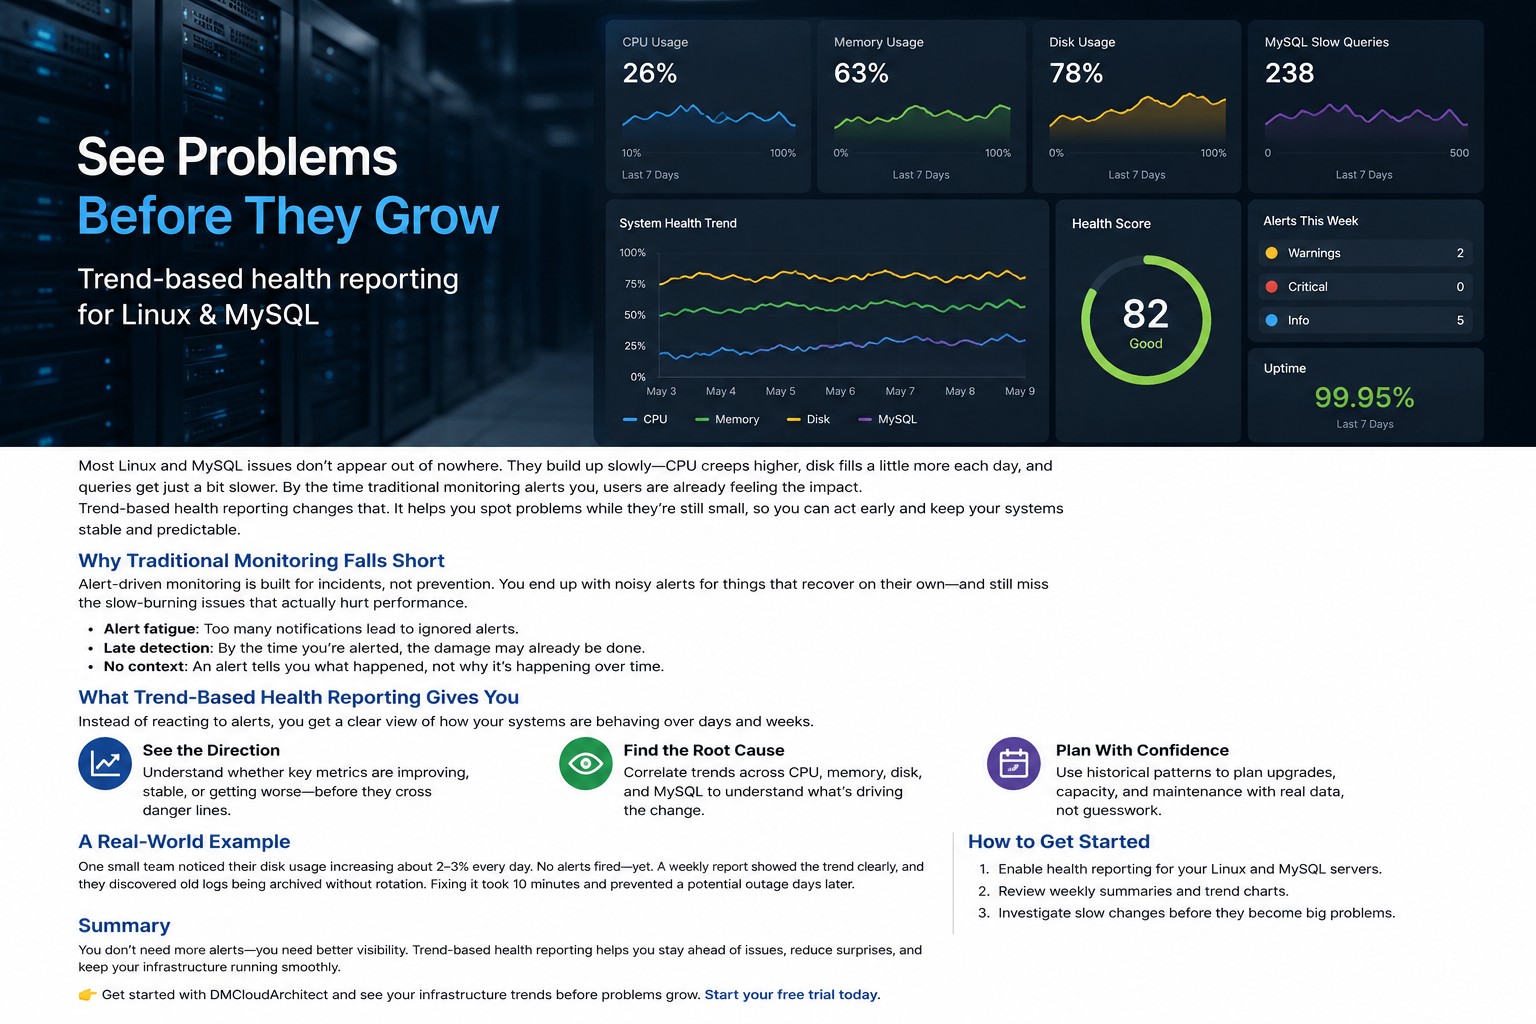
Many small infrastructure teams start with good intentions when building a monitoring stack. But over time, the environment becomes overloaded with dashboards, alert rules, plugins, and maintenance tasks that consume more time than the systems they were meant to protect.
That’s where monitoring without complexity becomes important. A monitoring platform should help administrators quickly understand server health, application availability, storage usage, and infrastructure risks without requiring constant tuning or operational overhead.
For teams running Oracle Cloud Infrastructure environments, Linux servers, databases, and small production workloads, a simpler monitoring approach is often more sustainable than deploying enterprise-scale tooling designed for much larger operations teams.
Why Simplicity Matters in Infrastructure Monitoring
Monitoring systems are supposed to reduce operational risk. But complicated monitoring environments can introduce their own problems:
- Too many alerts with no prioritization
- High maintenance overhead
- Complex dashboards nobody regularly reviews
- Monitoring servers consuming excessive resources
- Difficult onboarding for smaller teams
- Inconsistent alert thresholds
Here’s the thing: a simple monitoring system is often more effective because teams actually use it consistently.
When infrastructure visibility becomes easier to understand, administrators can spend more time solving real issues instead of managing the monitoring platform itself.
What Practical Server Monitoring Should Include
Practical server monitoring focuses on the core operational indicators that directly impact uptime and stability. Instead of collecting every available metric, successful low maintenance monitoring environments prioritize actionable visibility.
Server Resource Monitoring
At minimum, teams should monitor:
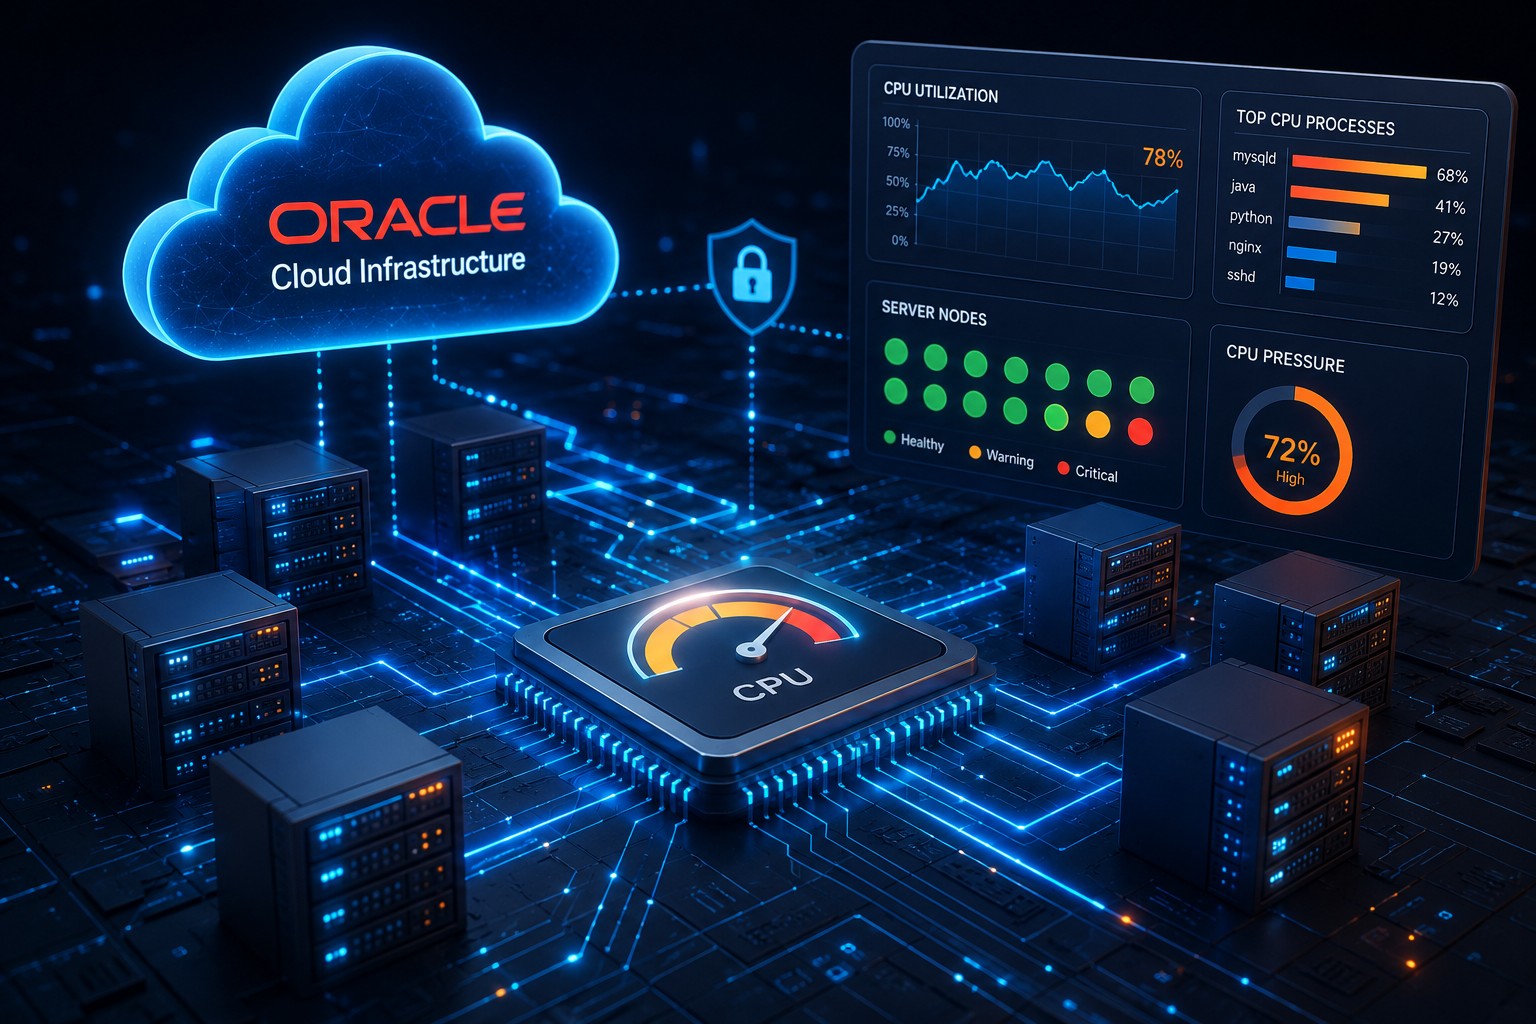
- CPU utilization trends
- Memory usage
- Disk consumption
- Filesystem growth
- Swap activity
- System load averages
- Network throughput
These metrics provide a strong baseline for Linux infrastructure management without creating unnecessary operational complexity.
Service Availability Checks
Simple ops monitoring should also confirm that critical services remain available. Examples include:
- Web server availability
- Database listener checks
- SSH accessibility
- Application process status
- Backup job completion verification
Availability checks are often more valuable than collecting hundreds of low-priority performance metrics that rarely drive operational decisions.
Easy Infrastructure Monitoring in OCI Environments
Oracle Cloud Infrastructure deployments benefit from monitoring systems that align with the architecture rather than complicate it.
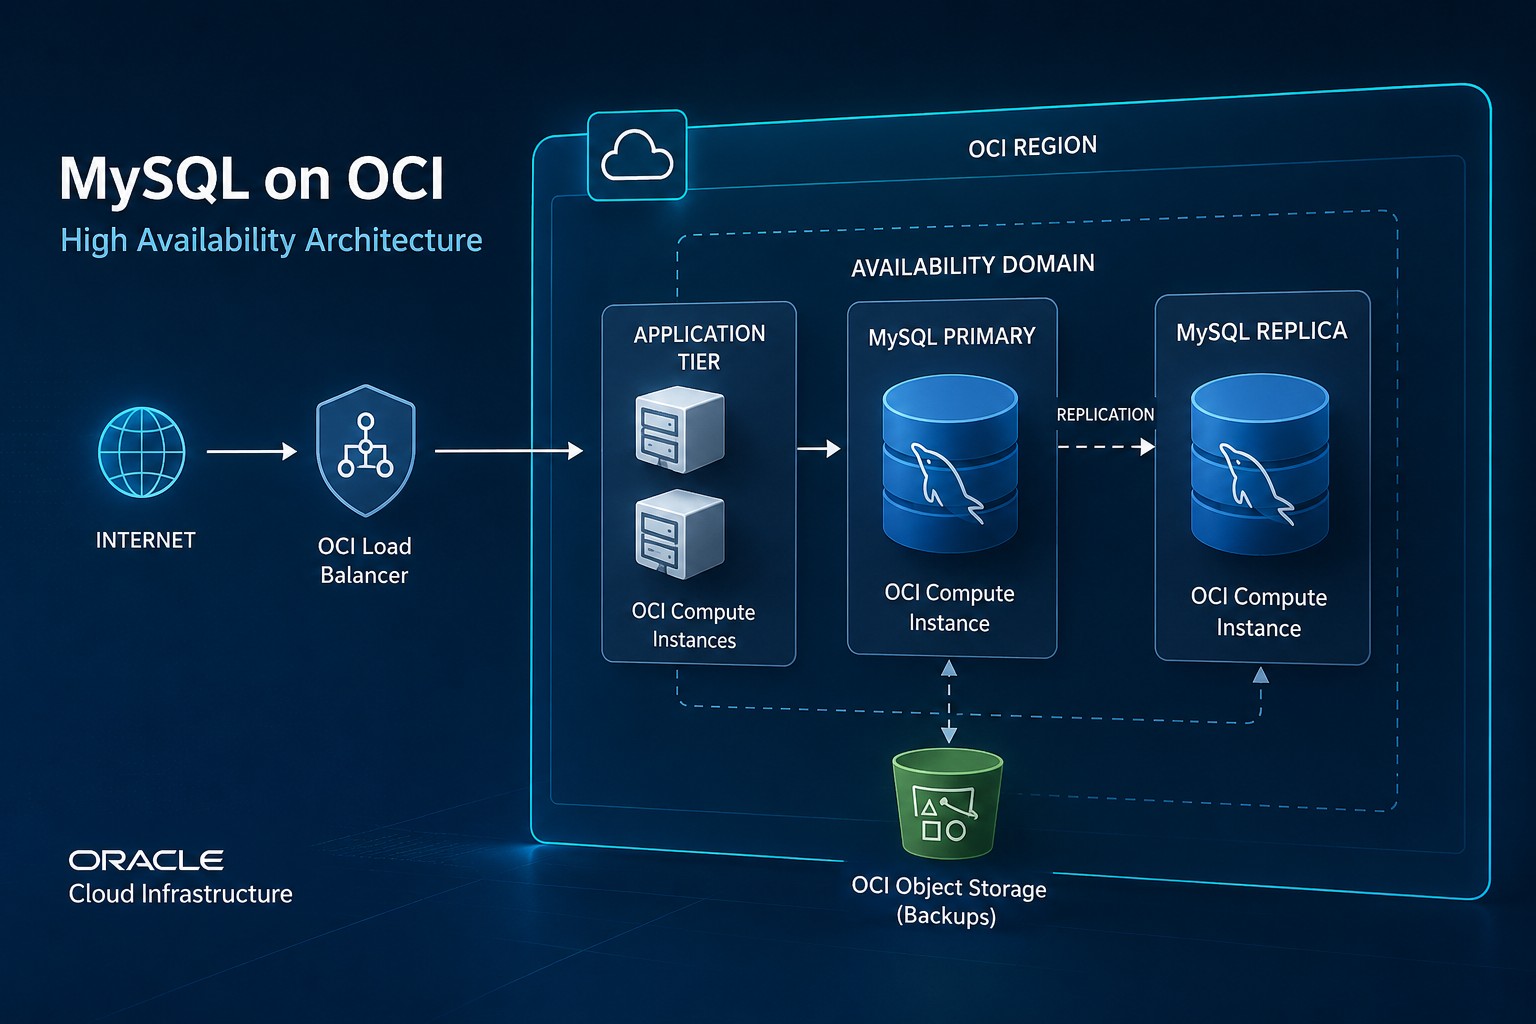
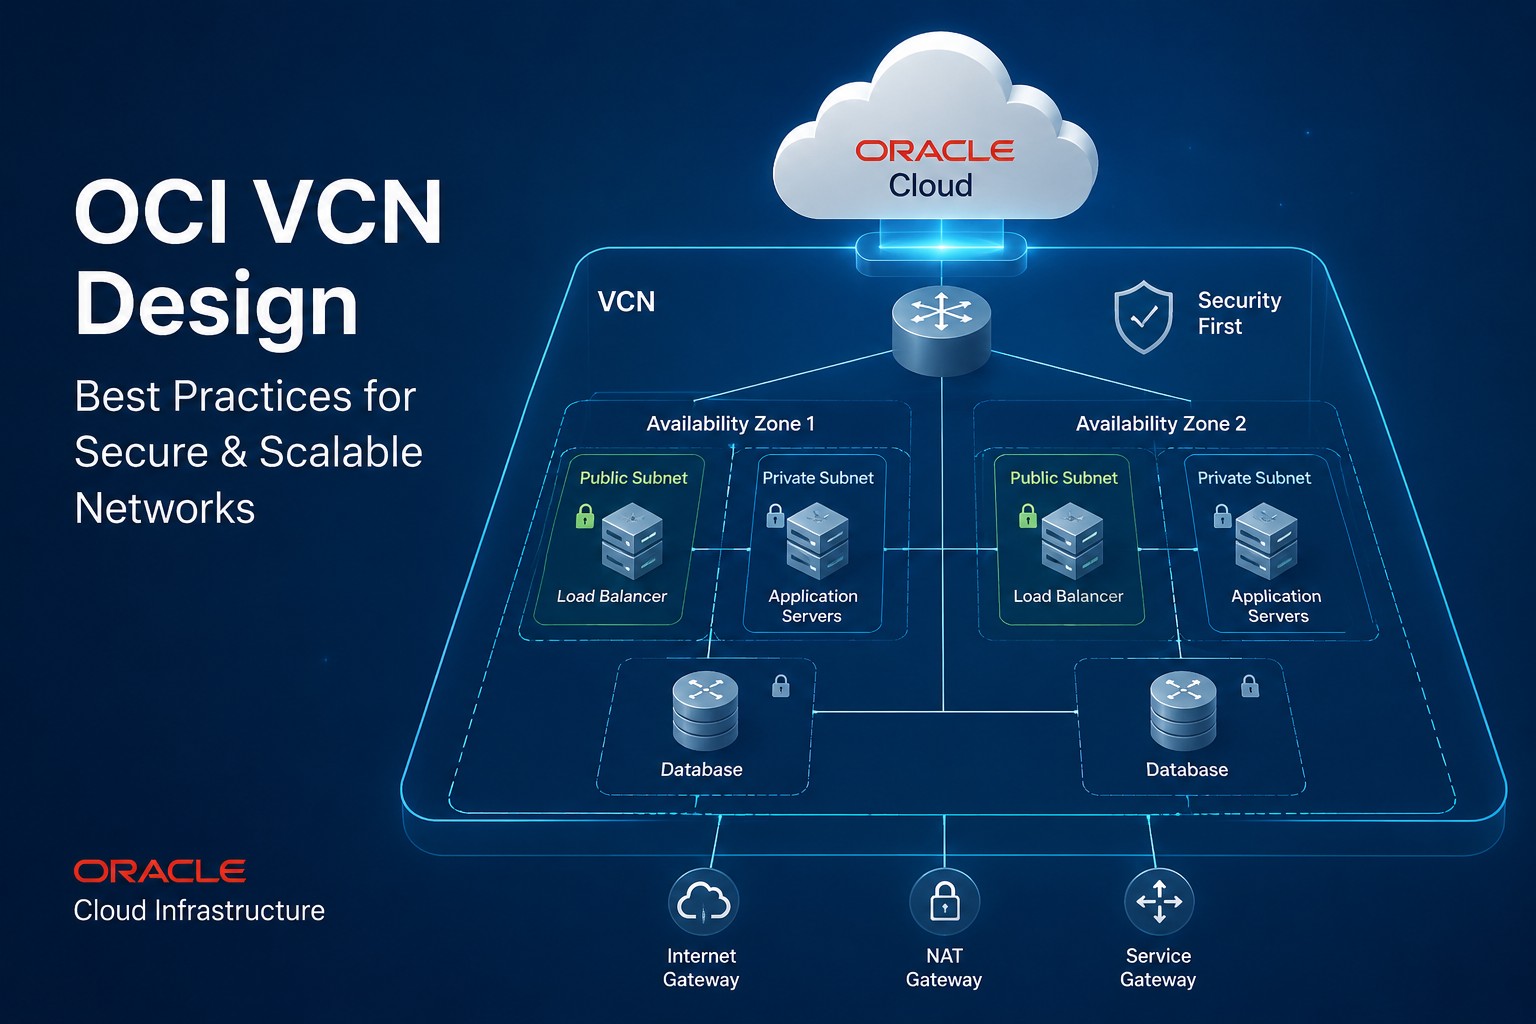
For example, a small OCI deployment may include:
- A Virtual Cloud Network (VCN)
- One or two Linux application servers
- A MySQL or Oracle database server
- Load balancer services
- Scheduled backup jobs
In this type of environment, monitoring should remain lightweight and operationally focused.
Useful monitoring objectives include:
- Identifying resource exhaustion early
- Tracking database storage growth
- Detecting failed services quickly
- Watching backup execution results
- Reviewing basic infrastructure trends over time
But this is where it matters: monitoring should never become harder to maintain than the infrastructure itself.
How to Keep Monitoring Low Maintenance
Low maintenance monitoring starts with reducing unnecessary complexity from the beginning.
Use Standardized Metrics
Avoid custom metrics unless they provide clear operational value. Standard Linux and infrastructure metrics are usually enough for most small and medium environments.
Reduce Alert Noise
One of the biggest monitoring mistakes is generating too many alerts. Teams eventually ignore notifications if every warning appears urgent.
Focus alerts on:
- Service outages
- Critical disk usage thresholds
- Backup failures
- Resource exhaustion risks
- Database availability problems
Removing low-value alerts helps teams respond faster when real problems occur.
Keep Dashboards Focused
Large dashboards packed with every metric often create confusion instead of clarity.
A practical server monitoring dashboard should answer a few simple questions immediately:
- Are systems online?
- Are resources healthy?
- Did backups complete?
- Are databases responding?
- Is storage approaching limits?
If a dashboard cannot quickly answer those questions, it may be too complicated.
Real-World Example: Small OCI Deployment
Consider a small infrastructure team managing a production workload inside OCI:
- Two Oracle Linux application servers
- One MySQL database instance
- Nightly backups
- A public-facing web application
Instead of deploying a large enterprise monitoring stack with dozens of integrations, the team implements:
- Basic CPU and memory monitoring
- Disk usage alerts
- Database availability checks
- Backup success monitoring
- Simple daily health summaries
The result is better operational awareness with significantly less maintenance effort.
Teams can identify infrastructure risks quickly without spending hours tuning alert rules or maintaining overly complicated dashboards.
Choosing Monitoring Tools Carefully
Not every environment requires enterprise-scale observability platforms. Smaller teams often benefit more from monitoring tools that prioritize usability, operational clarity, and straightforward maintenance.
When evaluating a monitoring solution, ask:
- Can new team members understand it quickly?
- Does it reduce operational workload?
- Are alerts actionable?
- Can it scale gradually as infrastructure grows?
- Does it require constant tuning?
Easy infrastructure monitoring is not about limiting visibility. It is about focusing on the metrics and alerts that actually help teams operate systems reliably.
Summary
Monitoring without complexity helps infrastructure teams maintain visibility without creating unnecessary operational overhead. By focusing on practical metrics, reducing alert noise, and simplifying dashboards, teams can improve uptime while keeping monitoring manageable.
For OCI environments, Linux servers, and database workloads, a simple monitoring system is often the most sustainable long-term approach. If you want a cleaner way to track infrastructure health and server availability, Sign Up Now to explore practical monitoring solutions designed for real operational environments.