You don’t lose production systems in seconds.
You lose them slowly.
And most teams never see it coming.
Not because the data isn’t there — but because they are not looking at trends over time.
The Real Problem: Invisible Degradation
Production environments rarely fail due to sudden spikes. Instead, failures are the result of gradual degradation:
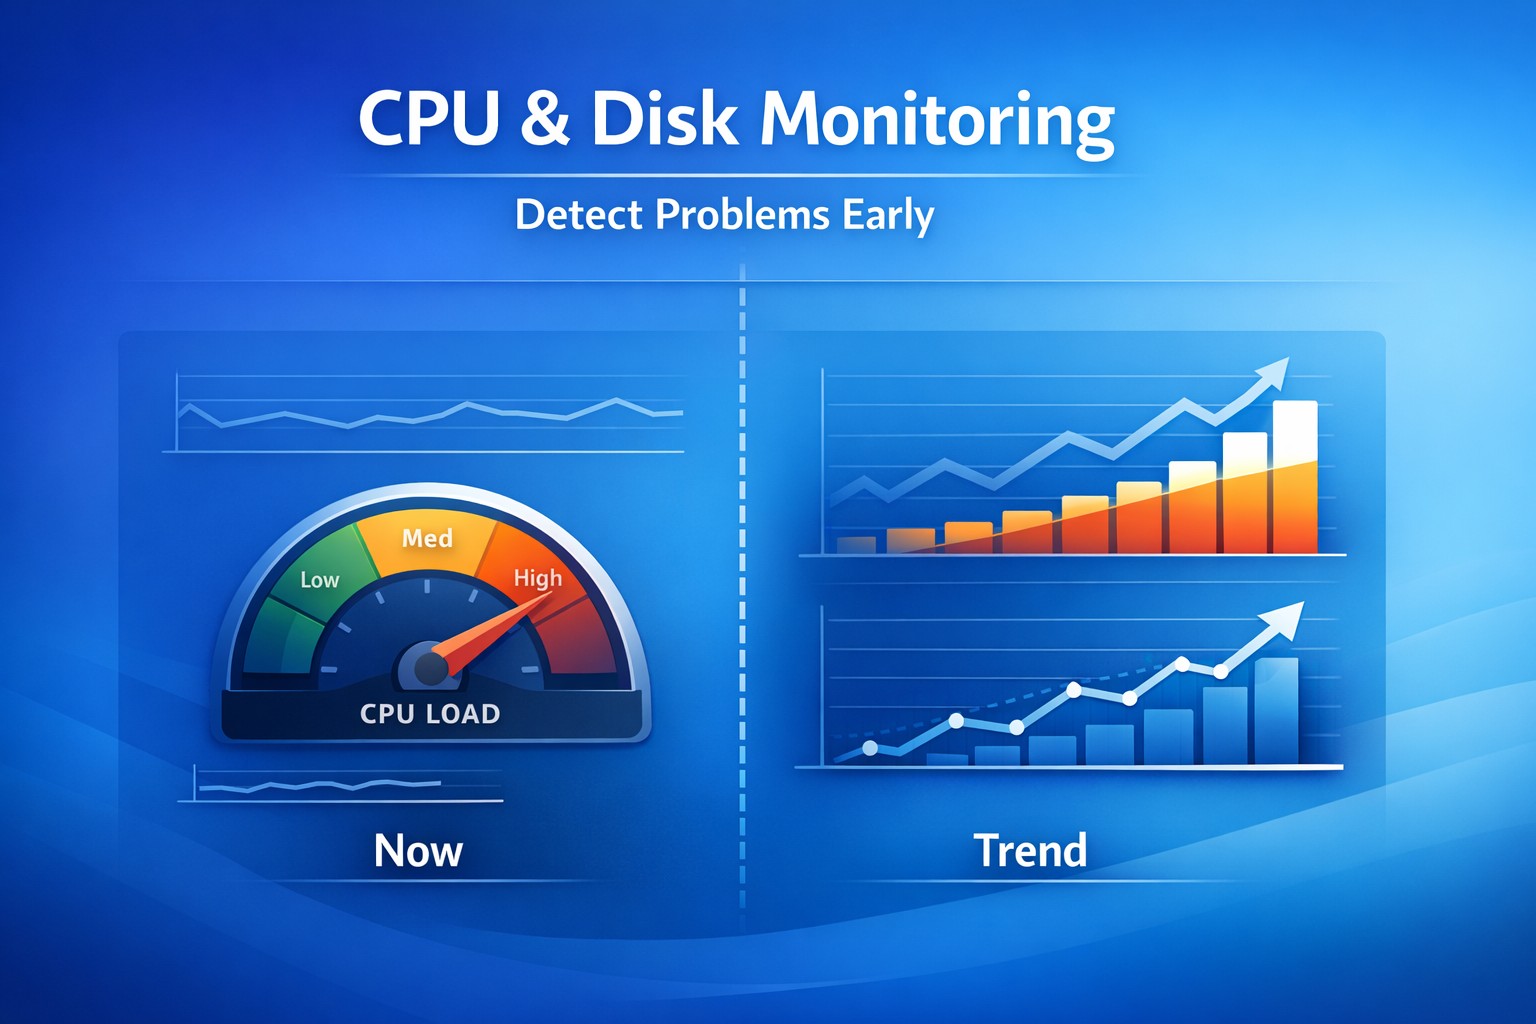
- CPU usage slowly increasing over weeks
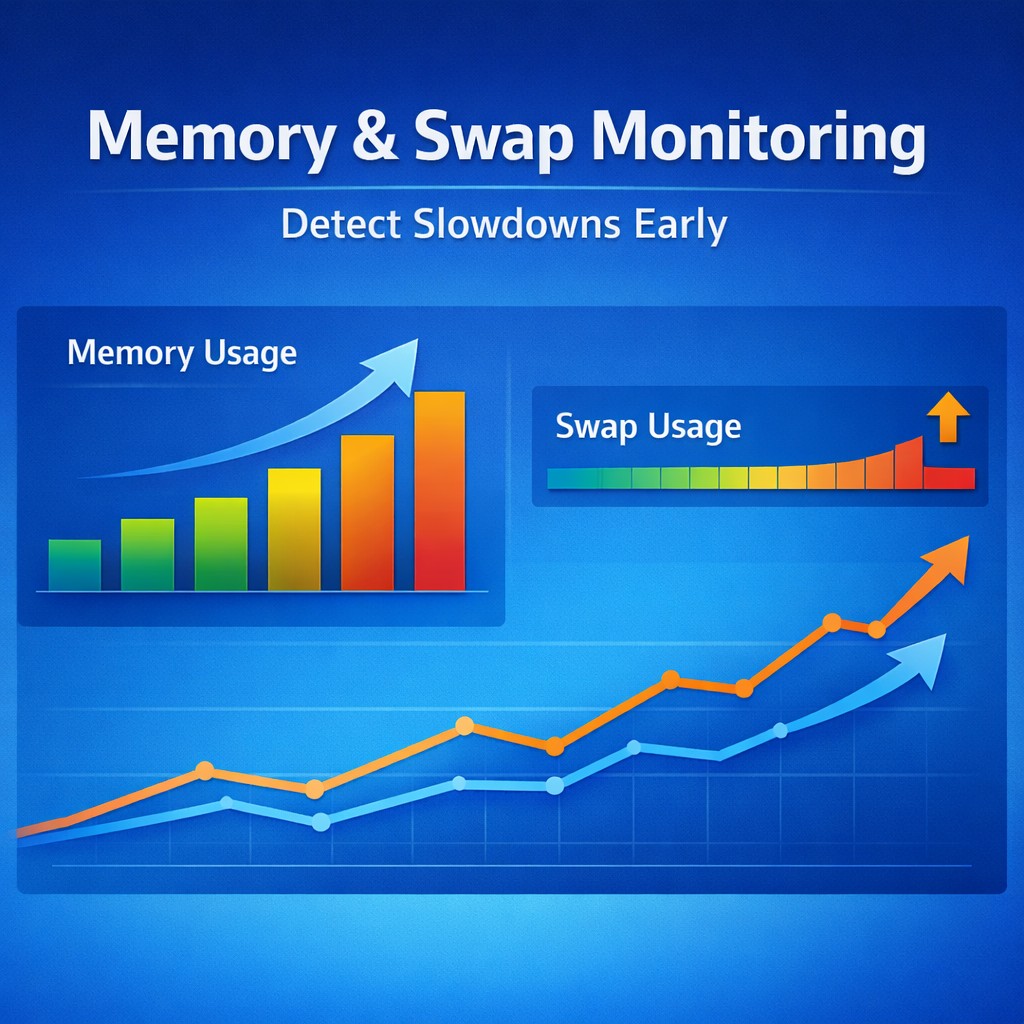
- Memory consumption creeping up daily
- Disk latency worsening under growing load
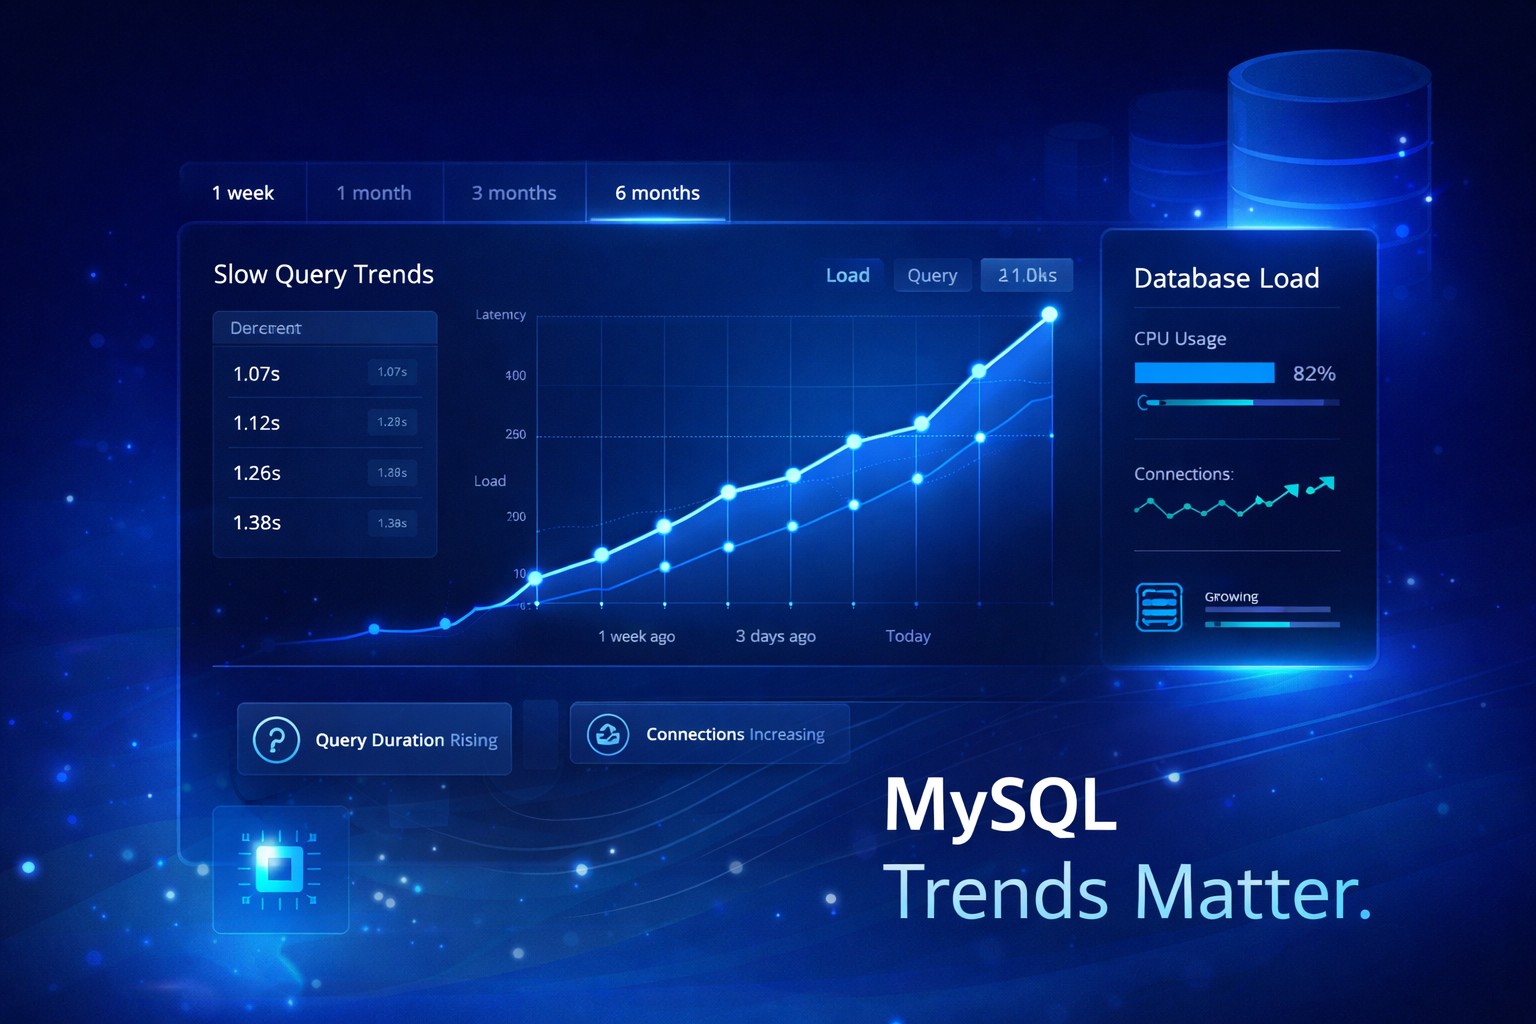
- Query performance degrading over time
Each of these changes looks harmless in isolation.
Together, they create instability.
Why Monitoring Misses the Problem
Traditional monitoring focuses on:
- Threshold breaches
- Real-time alerts
- Immediate incidents
But degradation doesn’t trigger alerts.
It evolves:
- From 40% CPU → 55% → 70% over weeks
- From 100ms latency → 200ms → 400ms gradually
No alert fires.
Until production is already impacted.
What Happens When Trends Are Missed
1. Sudden Capacity Exhaustion
Resources appear “healthy” until they abruptly hit limits.
2. Performance Instability
Applications behave inconsistently under normal load.
3. Unexplained Slowdowns
No incident is triggered, but users experience degraded performance.
4. Reactive Firefighting
Teams only act after customer impact.
The Role of Infrastructure Health Reporting
Instead of asking:
“Is the system down right now?”
Ask:
“How is the system changing over time?”
- Trend visibility
- Early detection of slow failures
- Understanding long-term behavior
- Proactive decision-making
You don’t need more alerts. You need better visibility over time.
Real-World Example
Memory increases 2–3% weekly. No alerts.
Weeks later:
- Latency doubles
- CPU spikes
- Users hit timeouts
This was not sudden. It was missed visibility.