MySQL Health Reporting: Track Trends Before Database Performance Slips
Most MySQL issues do not show up as sudden failures. They build slowly.
A query that used to finish in 40 milliseconds starts taking 70. CPU usage inches up during peak hours. Connection counts rise a little every week. Nothing looks broken in a single check, but the database is moving in the wrong direction.
That is why mysql health reporting matters. It gives you visibility into change over time, so you can detect performance degradation early instead of reacting after users start feeling it.
For engineers managing small MySQL environments, this is often the missing layer. You may not need a complex observability stack. You need a simple way to see whether database behavior is staying stable or gradually getting worse.
The Problem: MySQL Performance Usually Degrades Gradually
Production database problems often start as trends, not incidents.
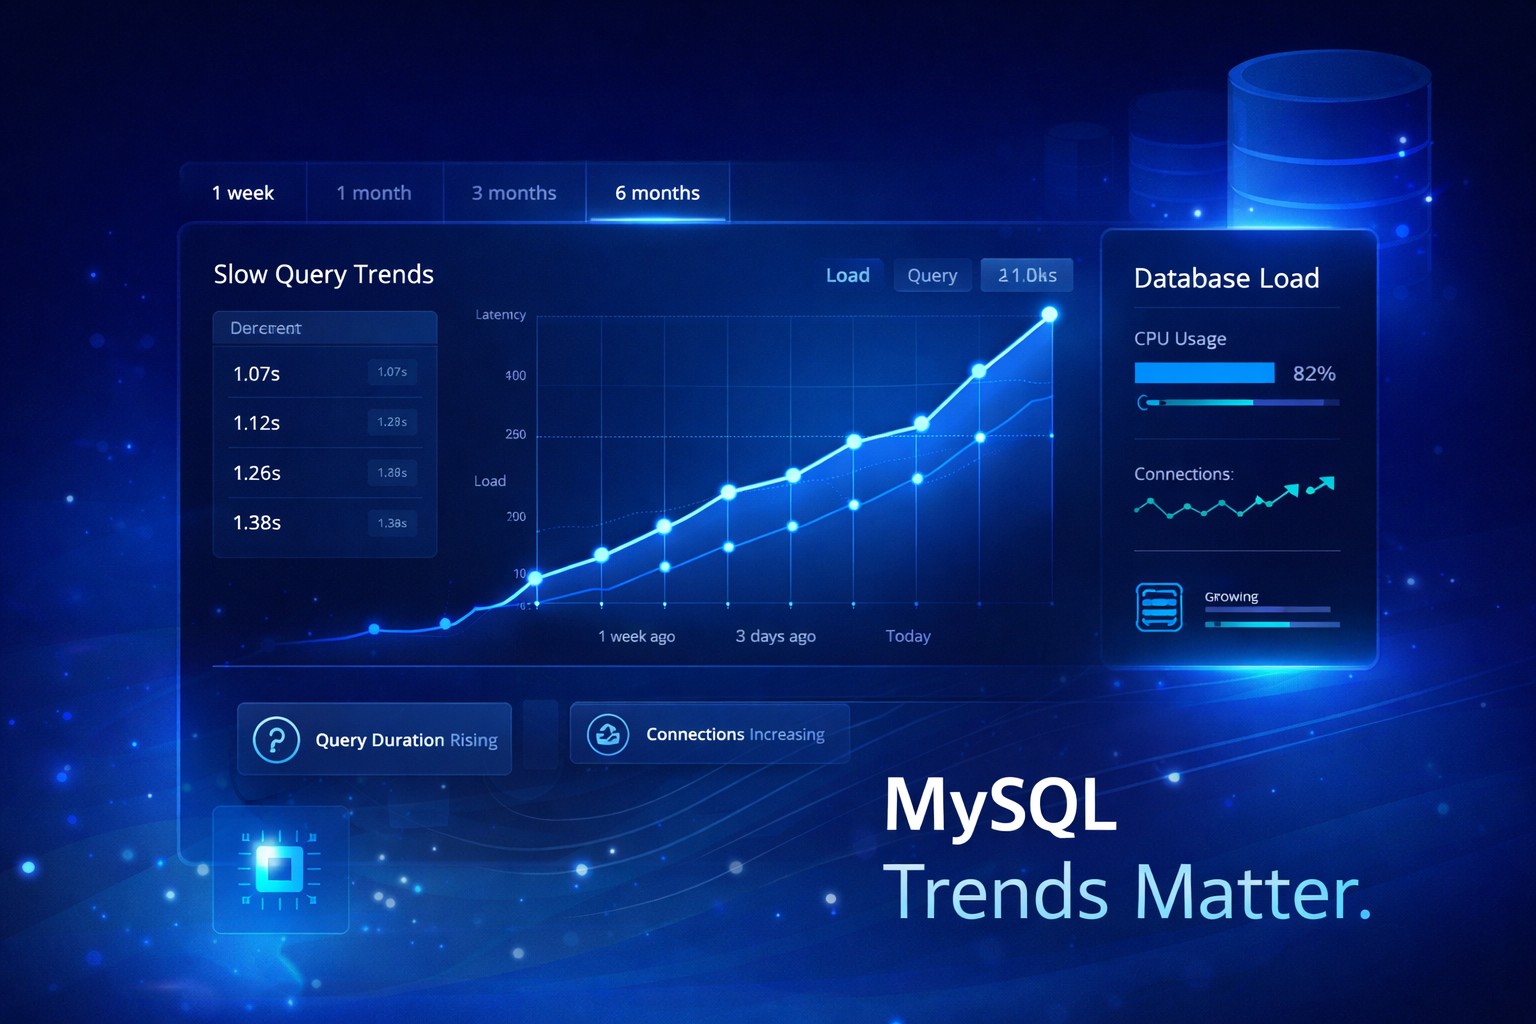
Slow queries may not spike in one day. They may increase week by week as data volume grows, indexes become less effective, or application behavior changes. At first the impact is small, so it is easy to ignore.
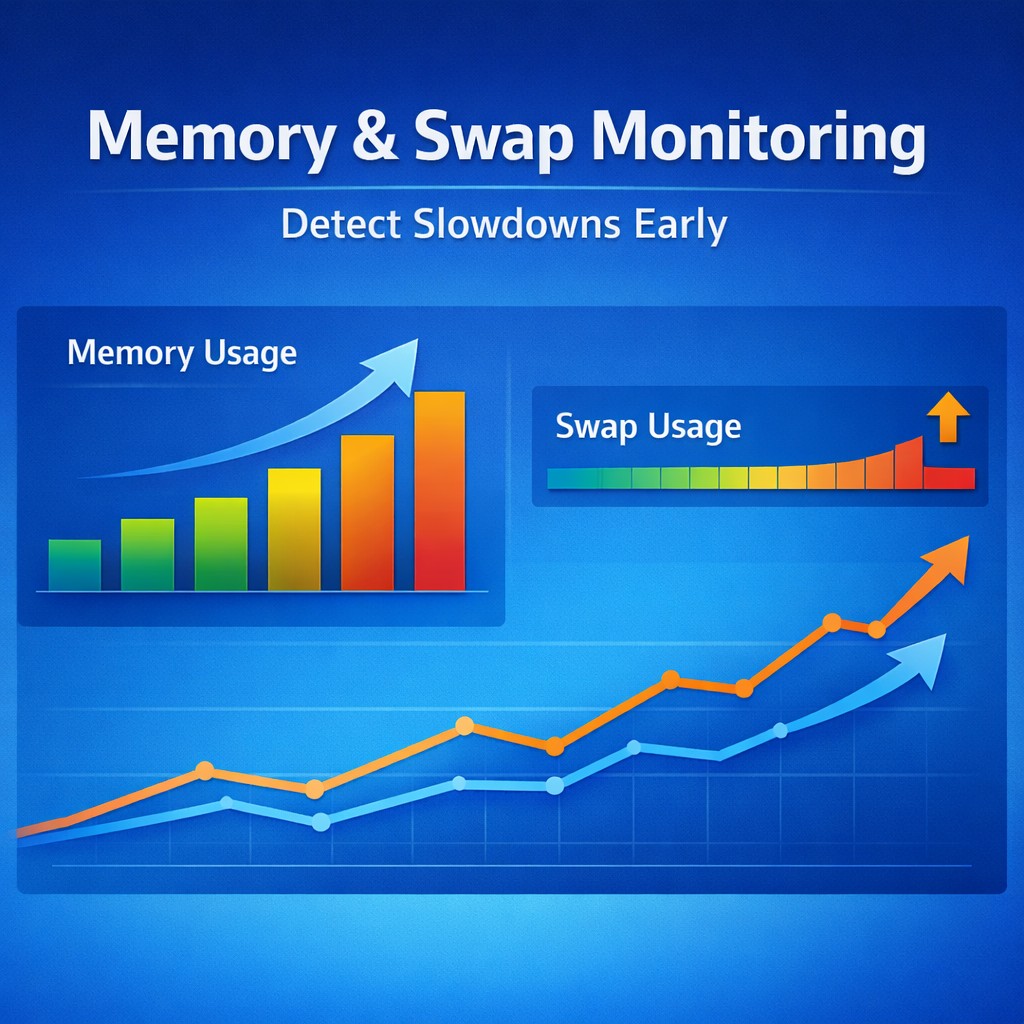
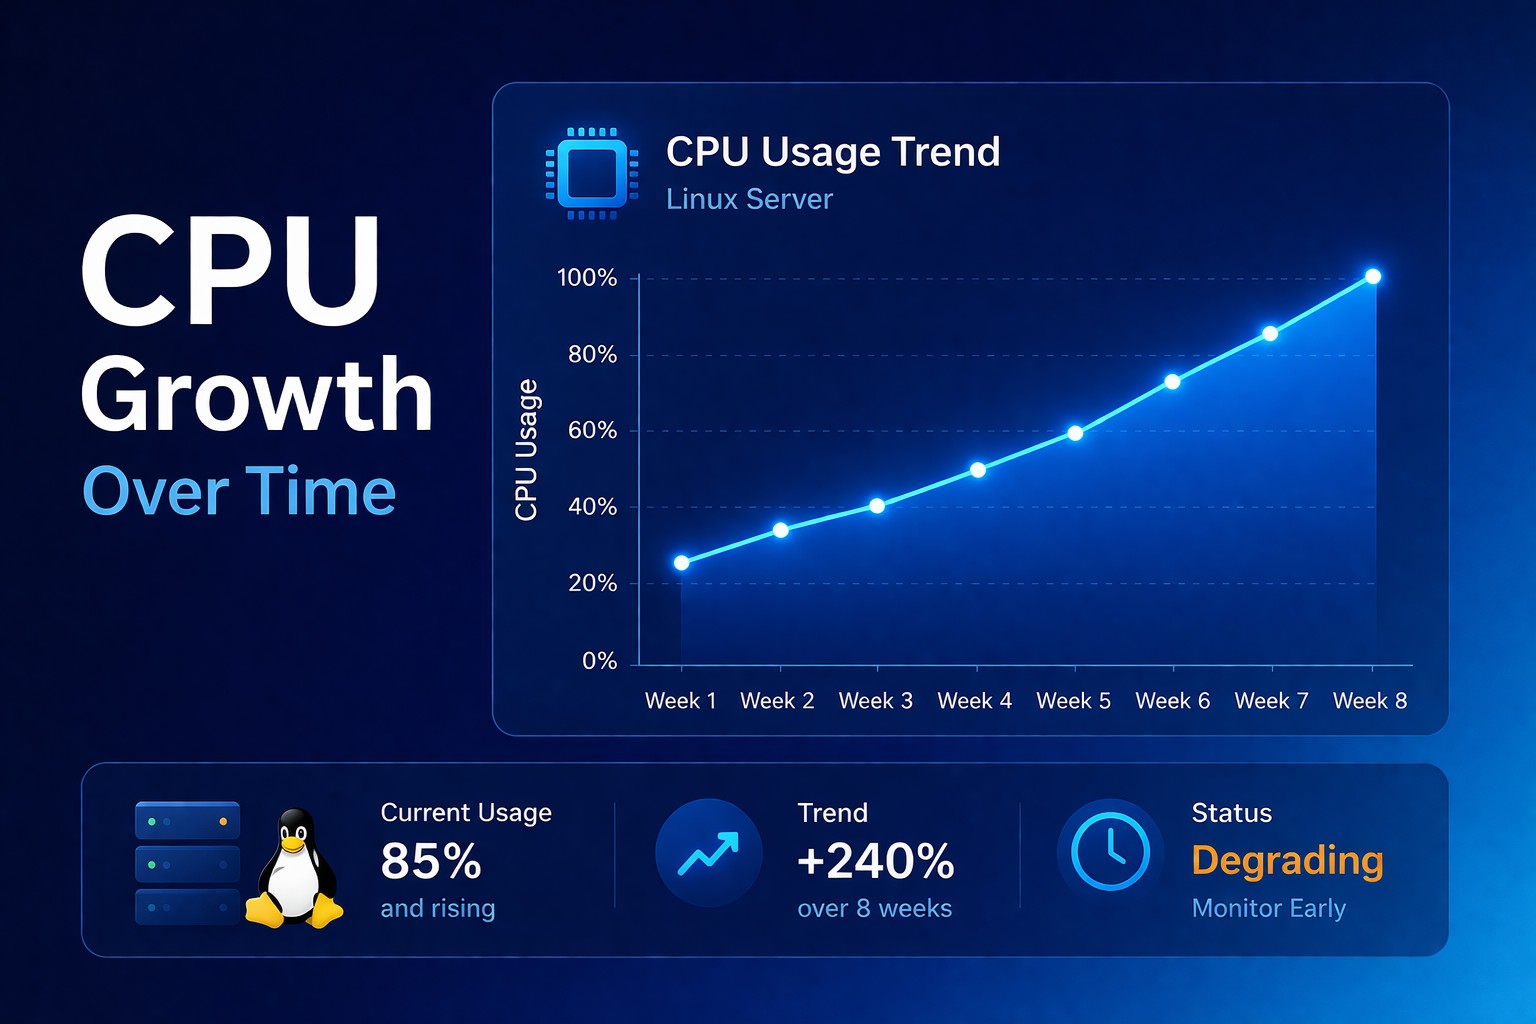
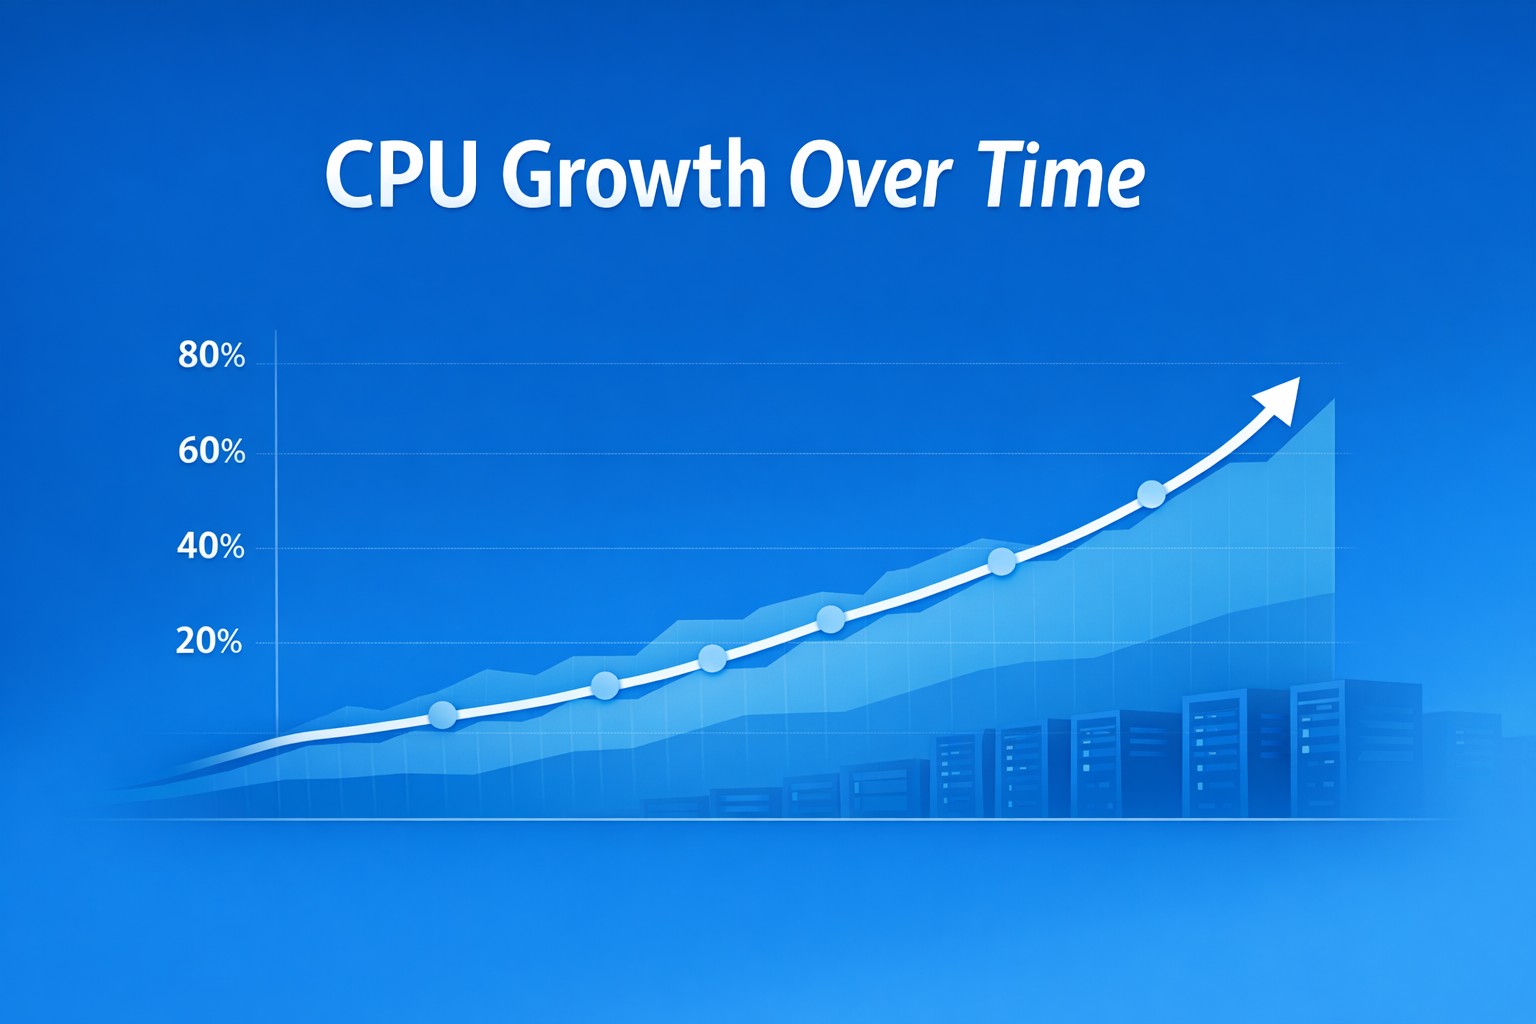
CPU usage can follow the same pattern. As database load increases, the server works harder to process reads, writes, sorts, joins, and background tasks.
Connection counts also tend to creep up over time.
Why This Gets Missed
Many teams rely on point-in-time checks.
The most common mindset is simple: “it looks fine now.”
Without historical visibility, small changes are hard to notice.
What Health Reporting Shows
- the trend of slow queries over time
- growth in average query execution time
- changes in connection patterns and concurrency
- resource usage tied to database load
Practical Example: A Slow Decline Before a Failure
In week one, everything appears normal.
In week two, queries get slightly slower.
In week three, slow queries increase.
In week four, CPU usage rises.
In week five, users feel the impact.
The failure appears sudden. It was not.
Best Practices
- track trends instead of snapshots
- monitor query patterns over time
- correlate MySQL load with system resources
- keep visibility simple
Common Mistakes
- relying only on current metrics
- ignoring slow growth
- overcomplicating the stack
Summary
Most MySQL performance problems develop gradually.
If you only look at snapshots, you detect issues late. If you track trends, you detect them early.
Most database performance issues build gradually over time. Infrastructure health reporting helps you detect those changes early, and DMCloudArchitect Health gives you a simple way to start tracking real MySQL trends without complex monitoring tools.