Memory & Swap Monitoring: Detect Slowdowns Before Your Linux Server Struggles
Your server isn’t down, but it’s getting slower every week… pages take longer to load, queries feel heavier — and nothing obvious is broken.
This is one of the most common and frustrating issues in small production environments. Everything looks “fine” at a glance, but performance keeps degrading.
In most cases, the root cause is not CPU or disk — it’s memory pressure and swap usage slowly increasing over time.
If you're trying to monitor small production server environments effectively, this is one of the first areas you need to understand.
The Problem: Silent Performance Degradation
Memory issues rarely fail loudly.
- Available memory slowly decreases
- Swap usage gradually increases
- Applications begin to respond slower
- No alerts are triggered
This is why many teams think their linux server monitoring setup is working — until users start complaining.
The problem isn’t sudden failure. It’s gradual degradation.
Why Trends Matter More Than Snapshots
Most engineers rely on quick checks like:
free -m
This gives a snapshot — but not the story.
At a single moment, everything might look fine:
- Some free memory available
- Swap not critically high
But what you don’t see:
- Memory has been decreasing for days
- Swap has been slowly increasing
- The system is compensating — but struggling
This is why simple server monitoring must include trend tracking, not just real-time values.
Memory Monitoring: What Actually Matters
Not all memory metrics are equal.
Key Metrics to Track
- Available memory (not just free)
- Used memory over time
- Cache vs actual usage
Important Insight
Linux uses memory aggressively for caching. So “used memory” alone is misleading.
What matters is:
- Is available memory trending downward?
- Is the system running out of reclaimable memory?
Warning Signs
- Available memory steadily declining
- Frequent drops below safe thresholds
- Sudden spikes in memory reclaim activity
If you want to monitor linux server quickly, start here.
Swap Monitoring: The Hidden Performance Killer
Swap is not inherently bad — but growing swap usage is a warning sign.
When Swap Becomes a Problem
- Swap usage increases over time (not just spikes)
- System starts relying on swap regularly
- Disk I/O increases due to memory pressure
Why It Matters
Swap is significantly slower than RAM.
As swap usage grows:
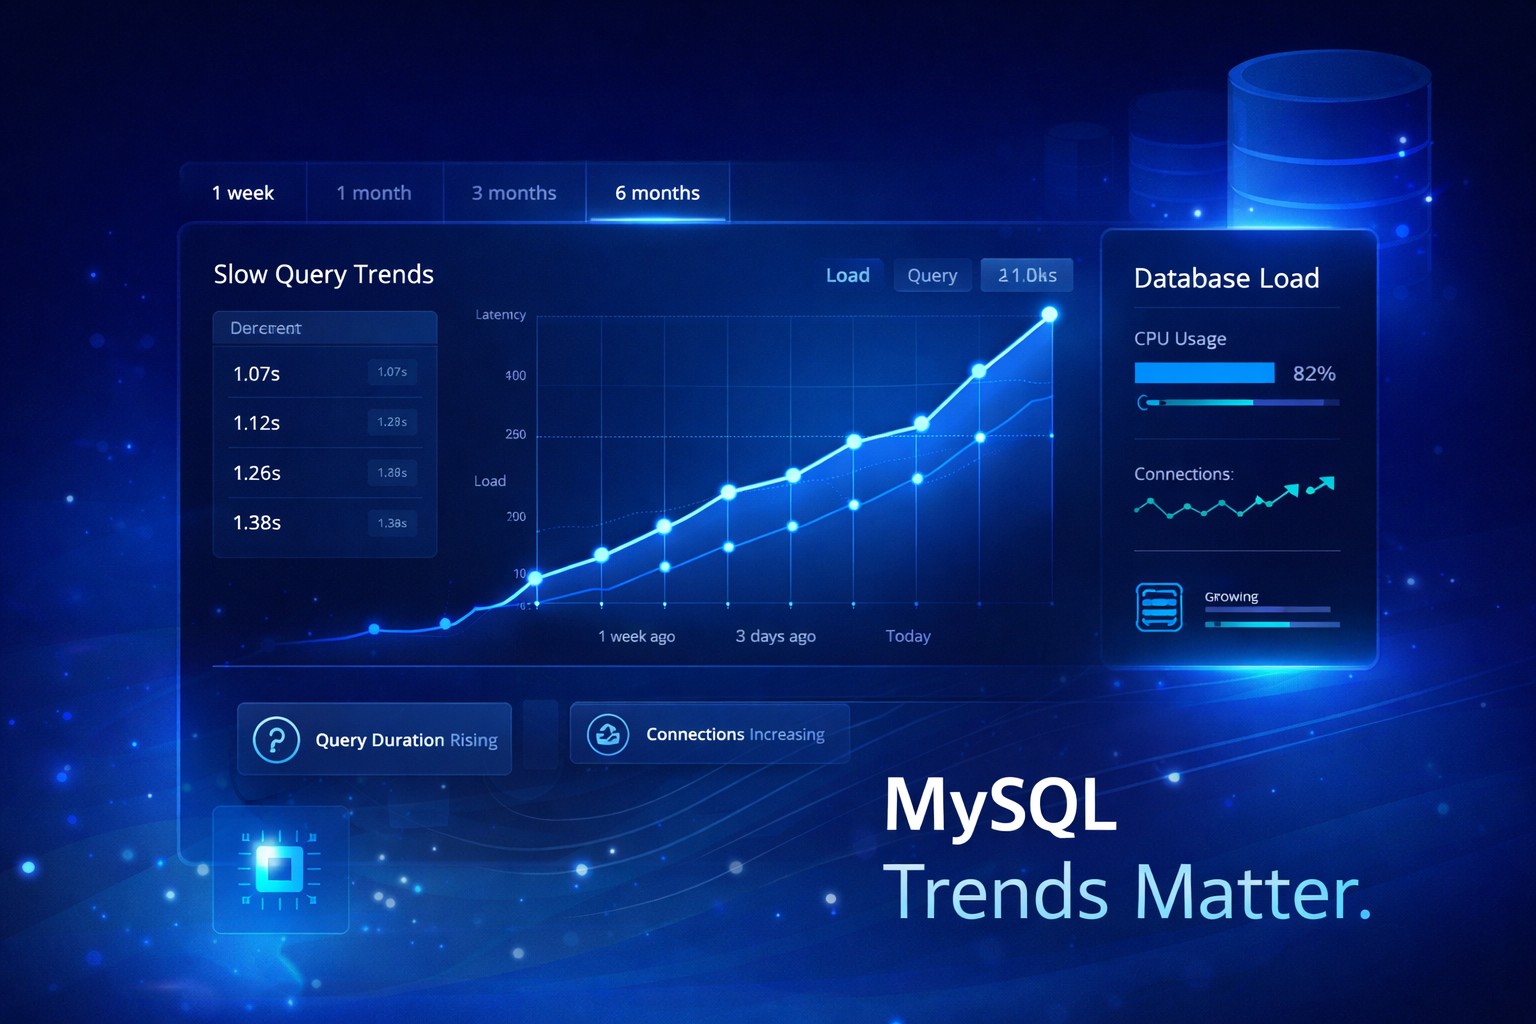
- Applications become slower
- Database queries take longer
- Latency increases across the system
This is where many small business server monitoring solutions fail — they alert only when swap is already too high.
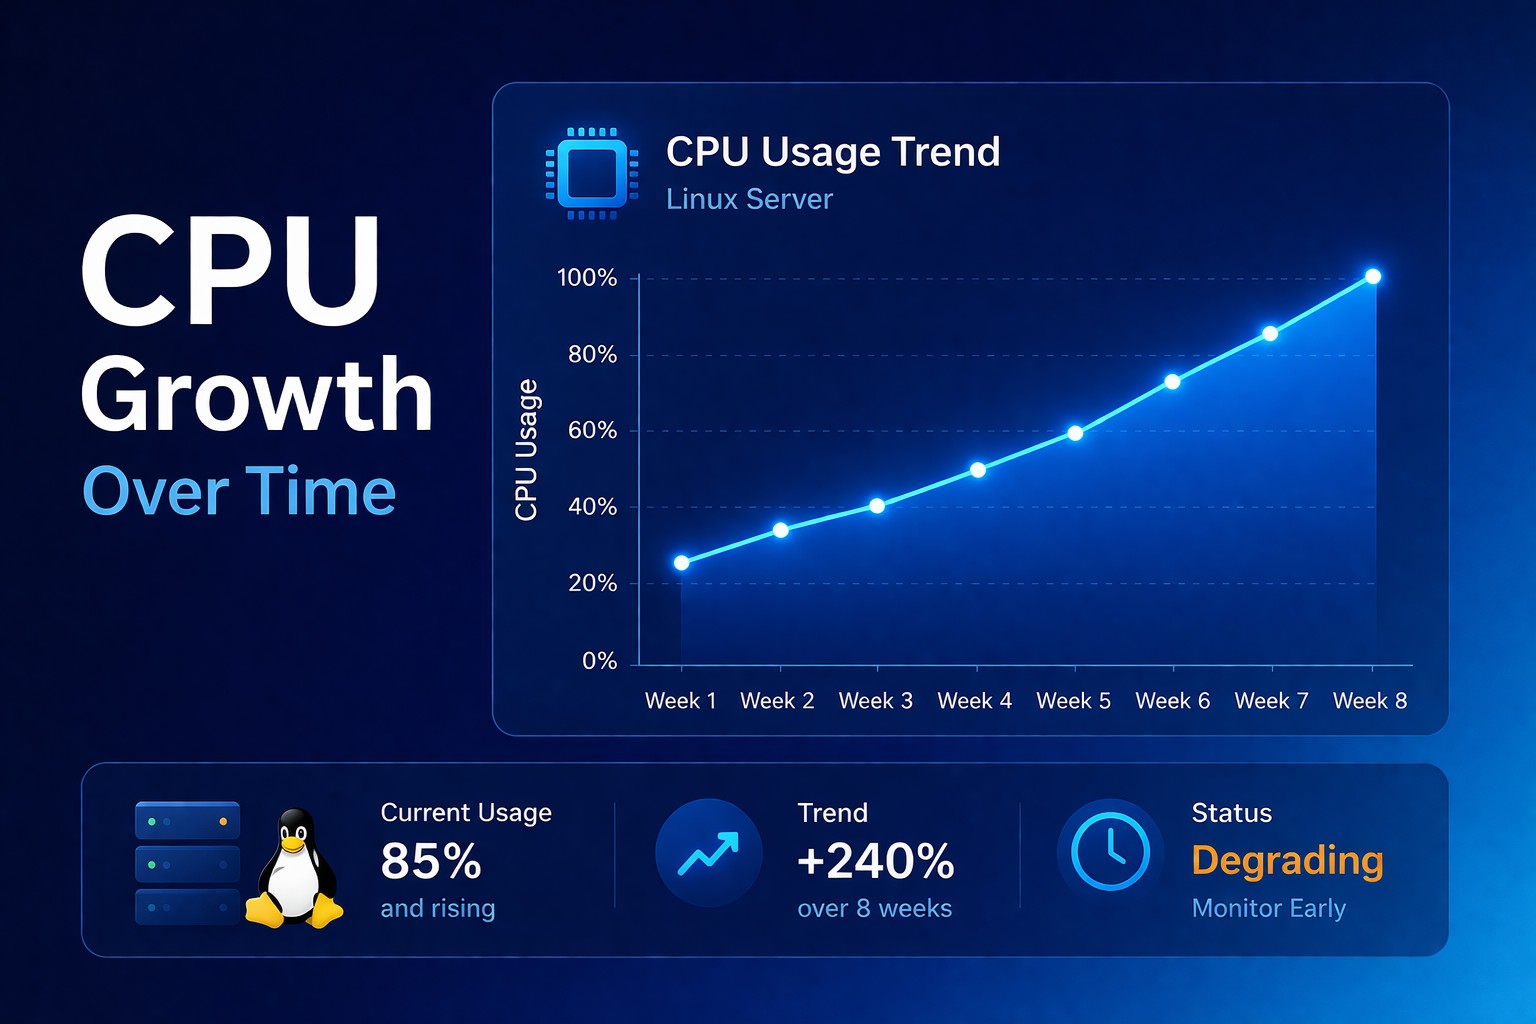
Real-World Example
A small production app runs fine after deployment.
Week 1:
- Memory usage normal
- No swap usage
Week 2:
- Slight drop in available memory
- Small swap usage appears
Week 3:
- Swap steadily increasing
- Pages load slower
No alerts fire — because thresholds were never crossed.
By Week 4, users report slowness.
This is exactly why easy infrastructure monitoring must focus on trends.
Practical Approach: What to Monitor
Track These Metrics
- Available memory (trend)
- Swap usage (trend)
- Swap in/out activity
- Memory usage growth rate
Monitoring Frequency
- Every 1–5 minutes for small servers
- Store historical data (at least 7–30 days)
Patterns to Watch
- Slow decline in available memory
- Gradual increase in swap usage
- Recurring daily memory exhaustion patterns
This is the foundation of a lightweight server monitoring tool.
Lightweight Solution: Trend-Based Monitoring
Most monitoring tools are either:
- Too complex for small setups
- Or too basic to catch gradual issues
This is where DMCloudArchitect Health becomes useful.
It focuses on:
- Trend-based monitoring instead of snapshots
- Clear visualization of memory and swap behavior
- Early detection of performance degradation
- Designed for small and medium infrastructure
You don’t need enterprise-level complexity to catch these problems early.
Summary
Memory issues are rarely sudden.
They build quietly:
- Memory slowly decreases
- Swap slowly increases
- Performance gradually degrades
By the time users notice — it’s already late.
If you want to truly monitor small production server environments, focus on trends, not just thresholds.
Start tracking memory and swap behavior today and catch issues before they impact users.
Explore a simple, trend-focused approach at:https://health.dmcloudarchitect.com/