Back to Blog
How to Monitor a Small Production Server in 5 Minutes

How to Monitor a Small Production Server in 5 Minutes

   Mariusz Antonik    Infrastructure Monitoring    3 min read    112 views

How to Monitor a Small Production Server in 5 Minutes

If you run a small production server, you already know one thing:

You don’t have time to build and maintain a full monitoring system.

You just want to know:

  • Is the server healthy?

  • Is MySQL performing normally?

  • Is anything trending toward a problem?

And ideally, you want that visibility without spending days setting up monitoring tools.

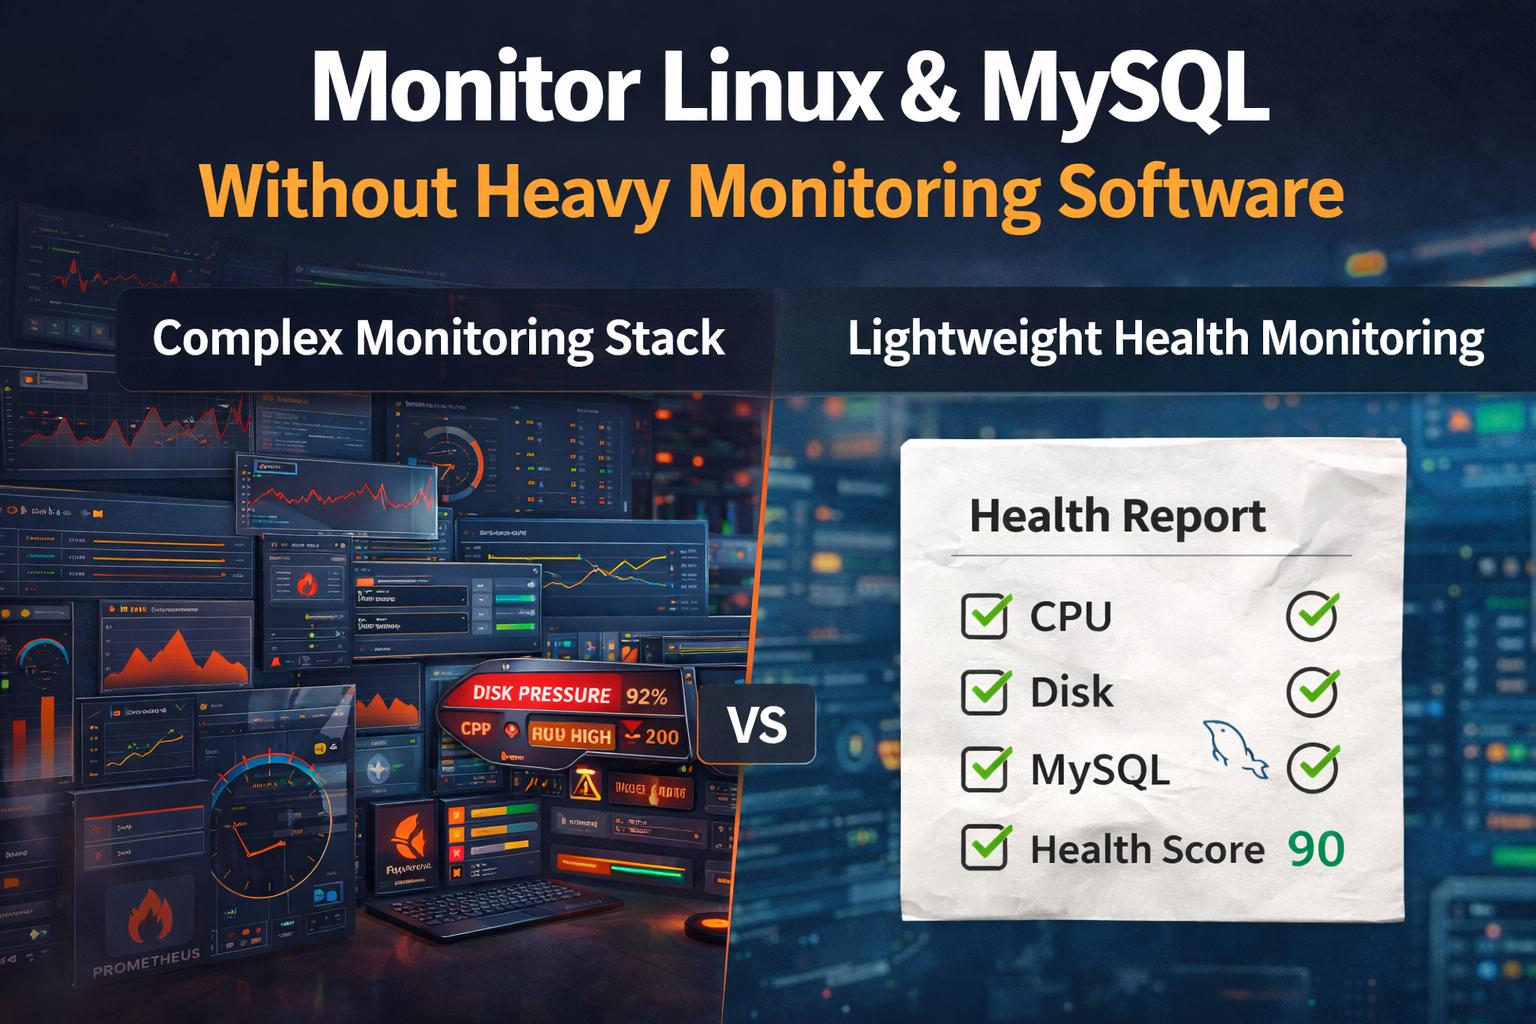
The good news is — you don’t need a complex monitoring stack to get that insight.


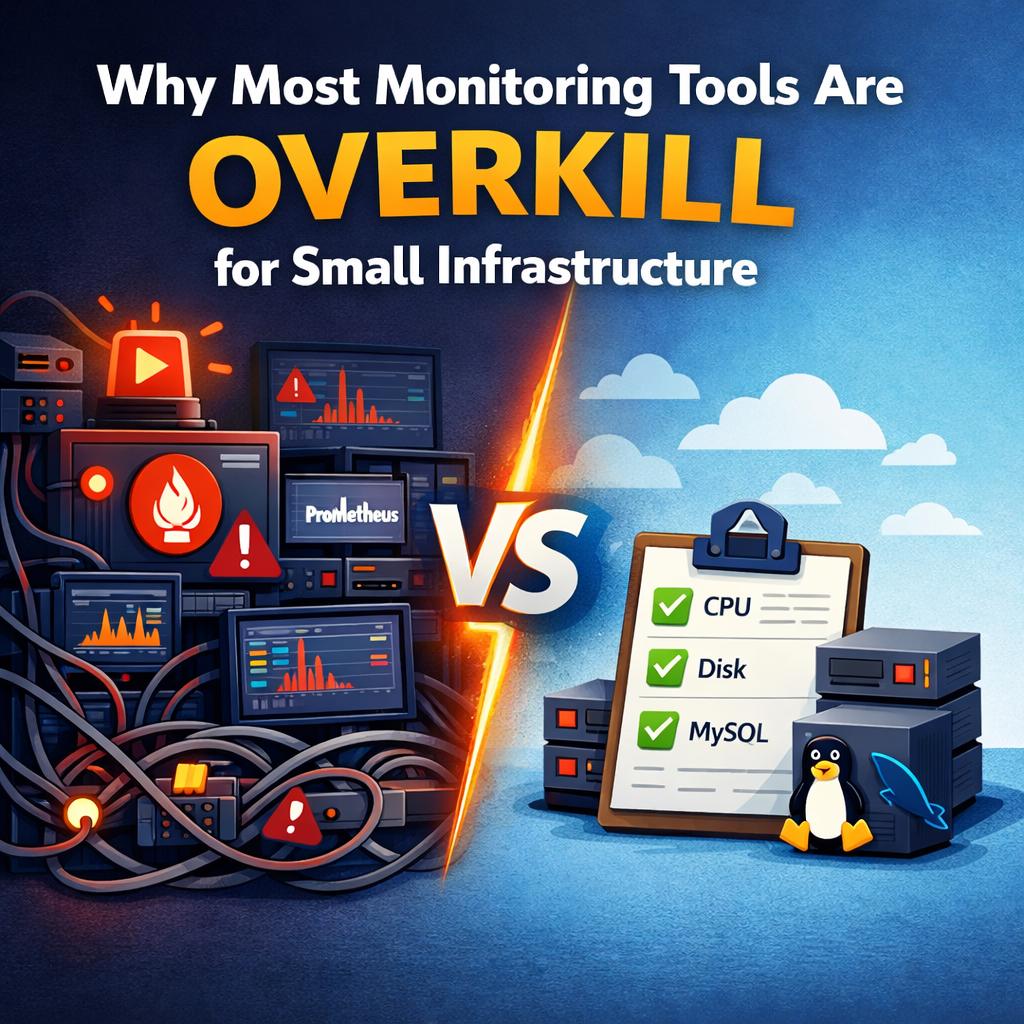
What Most People Do (And Why It Fails)

When developers decide to add monitoring, they often start with:

  • Prometheus

  • Grafana

  • exporters

  • alerting rules

This quickly turns into:

  • multiple services to install

  • dashboards to build

  • alerts to tune

  • ongoing maintenance

For a small environment, this becomes a project of its own.

Most people either:

  • abandon it halfway

  • or run it without really using it


What You Actually Need

For a small production server, you don’t need thousands of metrics.

You need answers to a few critical questions:

  • Is CPU usage stable or increasing?

  • Is memory pressure growing?

  • Is disk space safe?

  • Is MySQL workload changing?

  • Are slow queries increasing?

If you can answer these consistently, you can prevent most outages.


The 5-Minute Monitoring Approach

Instead of building a monitoring system, you use a lightweight health monitoring approach.

Here’s how it works:

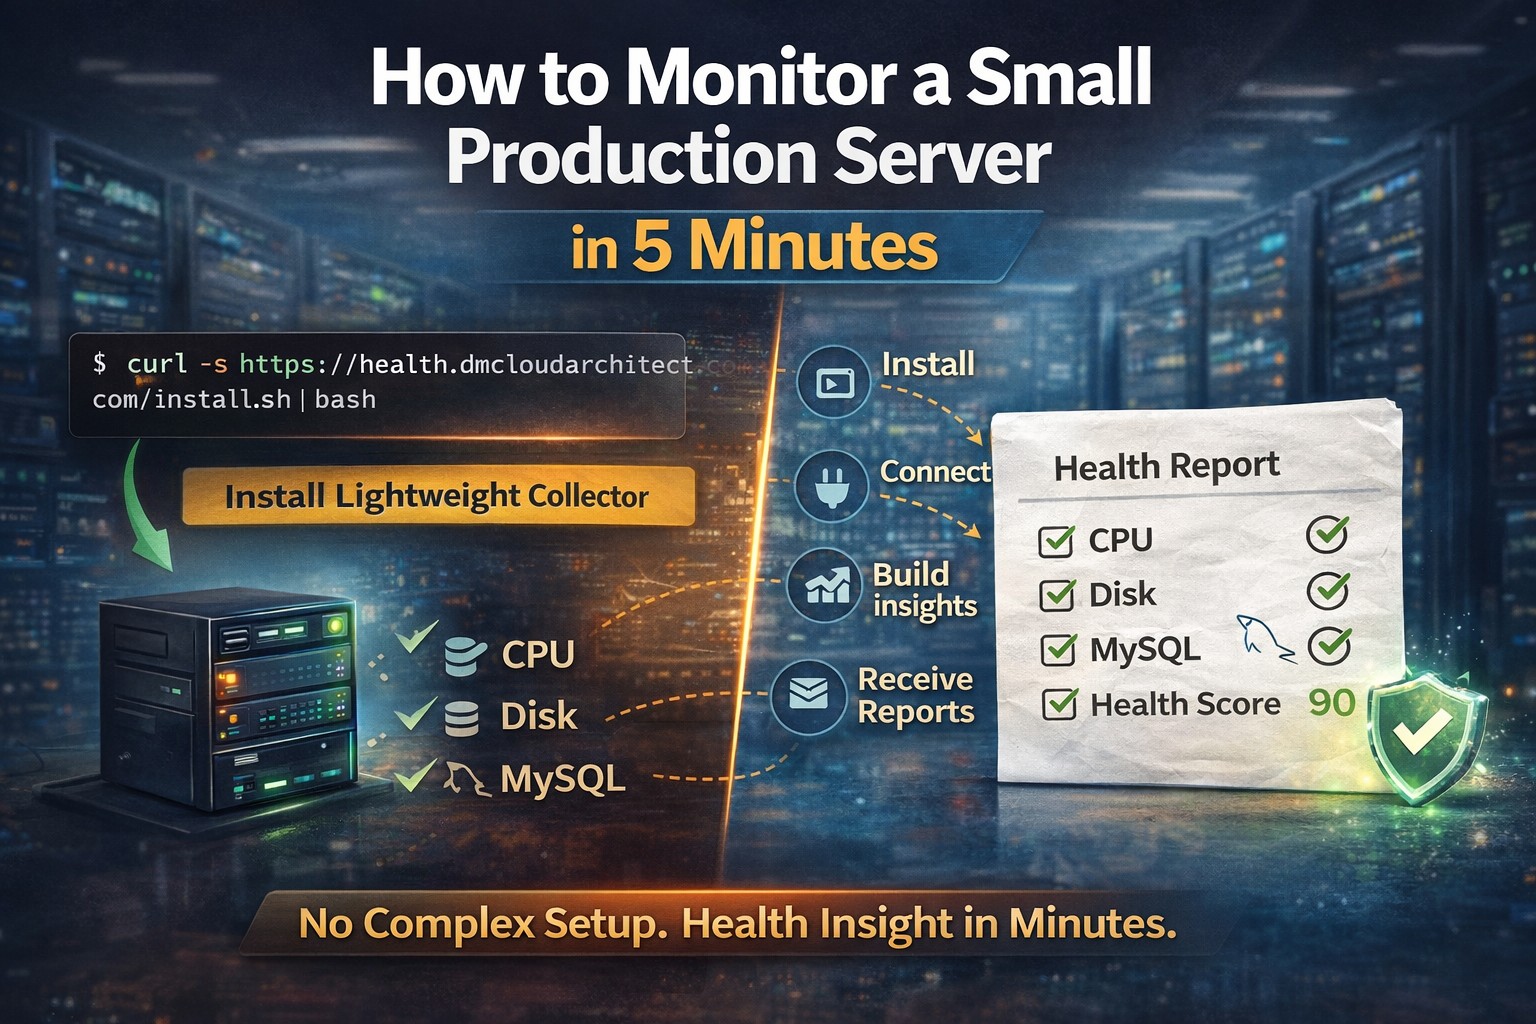
Step 1 — Install a lightweight collector

Run a simple install command on your Linux server.

Example:

 
curl -s https://health.dmcloudarchitect.com/install.sh | bash
 

This installs a small local collector.

No heavy agents. No complex dependencies.


Step 2 — Connect your environment

The collector gathers:

  • CPU, memory, disk metrics

  • system load

  • MySQL activity

  • slow query signals

Everything is collected locally and safely.


Step 3 — Let it build health data

Instead of flooding you with alerts, the system:

  • aggregates data

  • detects trends

  • identifies risk patterns

You don’t need dashboards.

You get structured insight.


Step 4 — Receive health reports

You receive clear reports showing:

  • system health

  • disk growth trends

  • MySQL behavior

  • potential risks

This gives you a weekly operational view instead of constant noise.


Why This Works Better for Small Environments

This approach works because it matches reality.

Small environments:

  • don’t have dedicated monitoring teams

  • don’t need real-time dashboards 24/7

  • don’t want alert fatigue

  • need simple, reliable insight

Instead of reacting to alerts, you:

  • understand trends

  • act early

  • avoid emergencies


Example: What You Can Catch Early

With simple health monitoring, you can detect:

  • disk filling over time

  • increasing MySQL connections

  • growing slow query activity

  • memory pressure before crashes

  • rising load trends

These are the issues that cause downtime later.


No Maintenance Overhead

One of the biggest advantages:

You are not maintaining a monitoring platform.

No:

  • dashboards

  • exporters

  • alert tuning

  • scaling monitoring infrastructure

Just:

  • install once

  • receive insights

  • act when needed


Designed for Real-World Small Infrastructure

This is exactly why DMCloudArchitect Health was created.

It is designed for:

  • solo developers

  • small SaaS environments

  • consultants managing servers

  • small production workloads

It provides:

lightweight infrastructure health monitoring for Linux and MySQL environments

without complexity.


Final Thoughts

Monitoring a small production server should not require a complex system.

You don’t need more tools.

You need better visibility.

And that should take minutes, not days.


Try It in 5 Minutes

If you want to monitor your Linux server and MySQL database without building a monitoring stack:

👉 https://health.dmcloudarchitect.com/install

Start in minutes.
Get structured infrastructure health insight.
Avoid problems before they happen.

About the Author
Mariusz Antonik

Oracle Cloud Infrastructure expert and consultant specializing in database management and automation.

All Tags
#Advanced #alerts #Bash #bash cpu monitoring script #bash monitoring #bash scripting #Beginner #Best Practices #block volume backup #Capacity Planning #cloud backup strategy #cpu bottleneck #CPU Monitoring #cpu monitoring linux #cpu monitoring script linux #cpu trends #cpu usage trends #cpu usage trends linux #create oracle db system in oci #cron cpu monitoring #cron cpu monitoring linux #cron jobs #database monitoring #database performance #detect slow queries mysql #devops #disk capacity planning server #disk forecasting linux #disk growth trend linux #Disk Monitoring #disk usage #disk usage script linux #disk usage trends #Early Detection #easy infrastructure monitoring #free-tier #Guide #health dashboards #Health Reporting #historical server monitoring #how to monitor cpu usage linux #infrastructure #infrastructure health #infrastructure health dashboard #infrastructure health reporting #infrastructure monitoring #infrastructure monitoring report #infrastructure trends monitoring #Infrastructure Visibility #lightweight linux monitoring #lightweight monitoring #linux #linux administration #linux cpu monitoring #linux cpu usage #linux disk capacity planning #linux disk usage #Linux monitoring #linux monitoring setup #linux monitoring tools #linux performance #linux performance monitoring #linux server #linux server monitoring #linux servers #linux storage #linux tools #low maintenance monitoring #monitor cpu usage over time linux #monitor linux server health #monitor server trends #monitor small production server #monitoring without complexity #MySQL #mysql health reporting #MySQL monitoring #mysql optimization #MySQL Performance #mysql performance degradation #mysql performance monitoring #mysql performance trends #mysql query performance issues #mysql server monitoring #mysql slow queries #mysql slow query analysis #mysql slow query monitoring #mysql trends #mysql-health #networking #nsg #OCI #oci backup #oci bastion tutorial #oci block volume #oci infrastructure as code #OCI monitoring #oci networking #oci oracle database private subnet setup #oci oracle database tutorial #oci security #oci setup guide #oci terraform tutorial #oci tutorial for beginners #oci vcn terraform #oci virtual machine db system guide #oracle base database service tutorial #oracle cloud bastion #oracle cloud free tier tutorial #oracle cloud infrastructure step by step #oracle cloud infrastructure tutorial #oracle cloud storage #oracle database on oci setup #oracle-cloud #Performance #Performance Degradation #performance monitoring #performance trend monitoring #performance trends #plan disk growth server #practical server monitoring #predict disk usage growth #private instance access #query optimization #Security #security lists #server health #server health reporting #server health weekly report #server monitoring #Server Performance #server trend analysis #server-trends #simple cpu monitoring linux #simple linux monitoring #simple monitoring small business #simple monitoring system #simple ops monitoring #slow queries #slow query reporting mysql #small business infrastructure #small business IT #small business servers #small infrastructure monitoring #small server monitoring #ssh bastion #storage capacity planning linux #storage monitoring #subnets #system health reporting #terraform oci compute #terraform oracle cloud infrastructure #Trend Monitoring #trend-analysis #trends #Tutorial #vcn