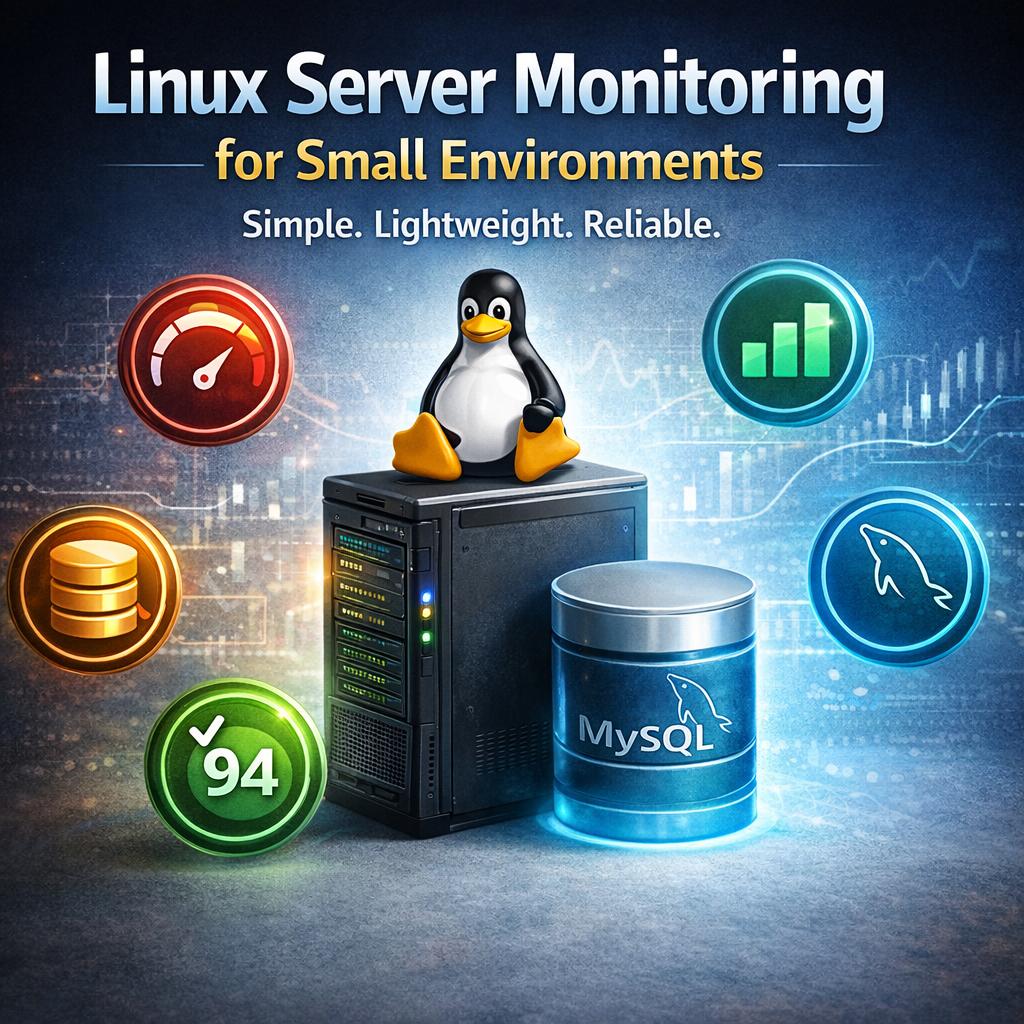
Simple Infrastructure Monitoring for Small Linux Servers (Practical Guide)
If you run a small production server, monitoring should be simple.
But most developers quickly run into the same problem:
👉 monitoring tools are built for large environments — not small ones
You don’t need a full observability platform.
You need a practical way to monitor your infrastructure without complexity.
What “Simple Monitoring” Really Means
Simple monitoring does not mean “no monitoring.”
It means:
- fast to install
- easy to understand
- low maintenance
- focused on key signals
- no unnecessary noise
For small Linux and MySQL environments, this is the most effective approach.
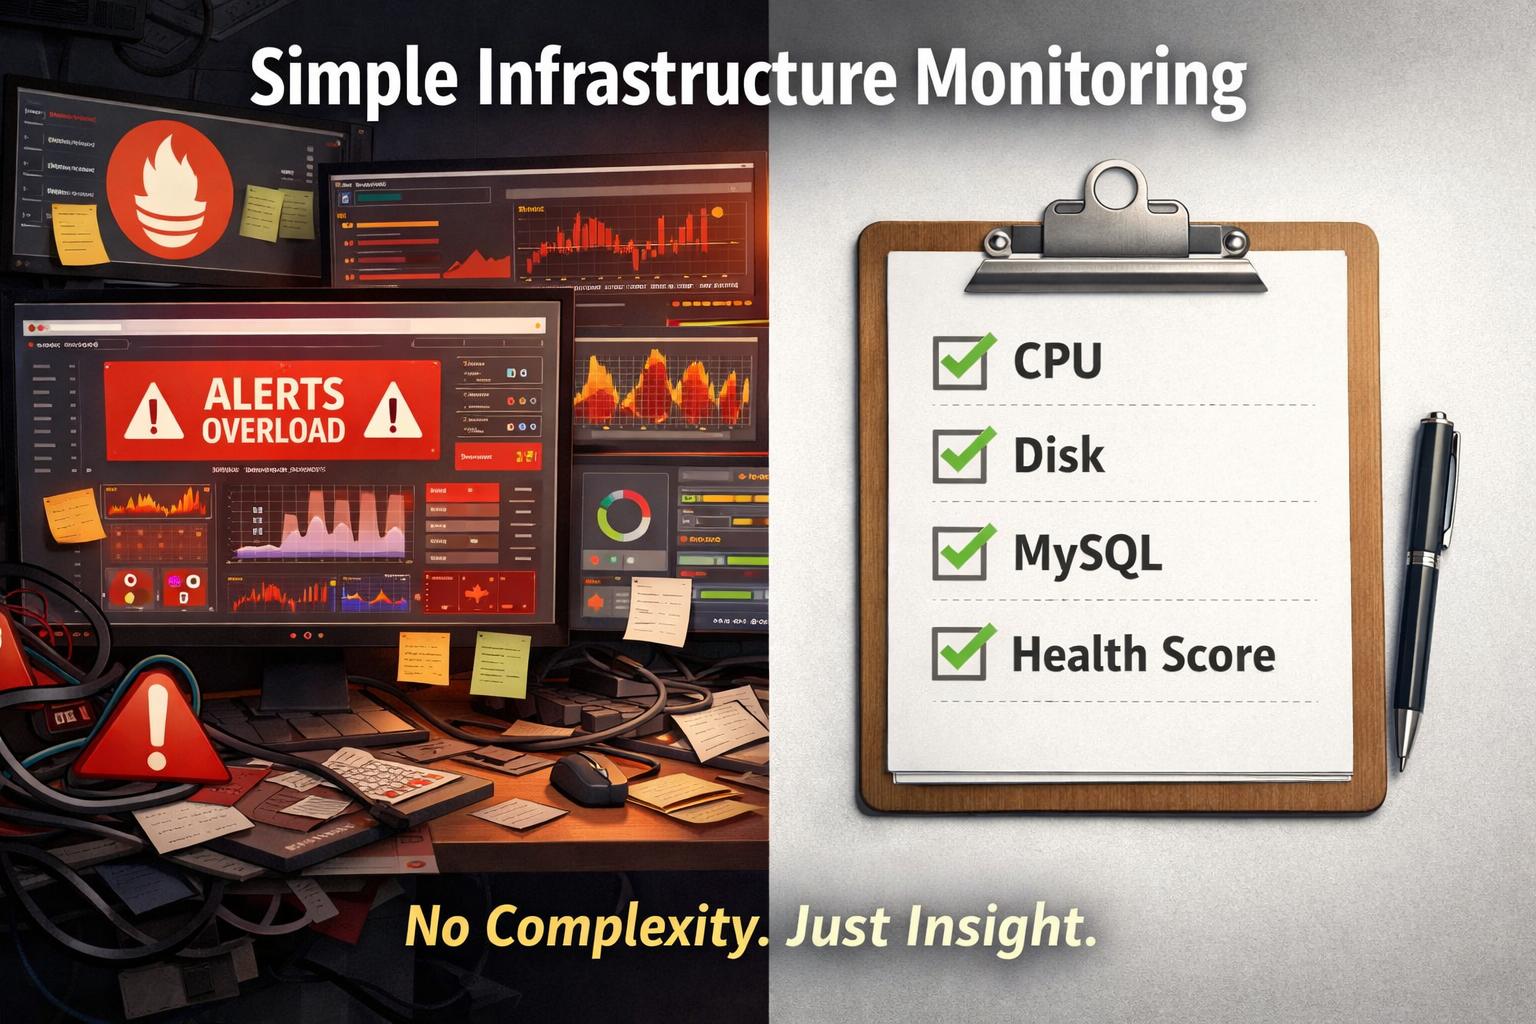
The Typical Mistake: Overbuilding Monitoring
Many developers start with:
- Prometheus
- Grafana
- exporters
- alert systems
This quickly becomes:
- multiple services to manage
- dashboards to maintain
- alerts to tune
- infrastructure overhead
Instead of helping, monitoring becomes a burden.
👉 (See: Why Most Monitoring Tools Are Overkill)
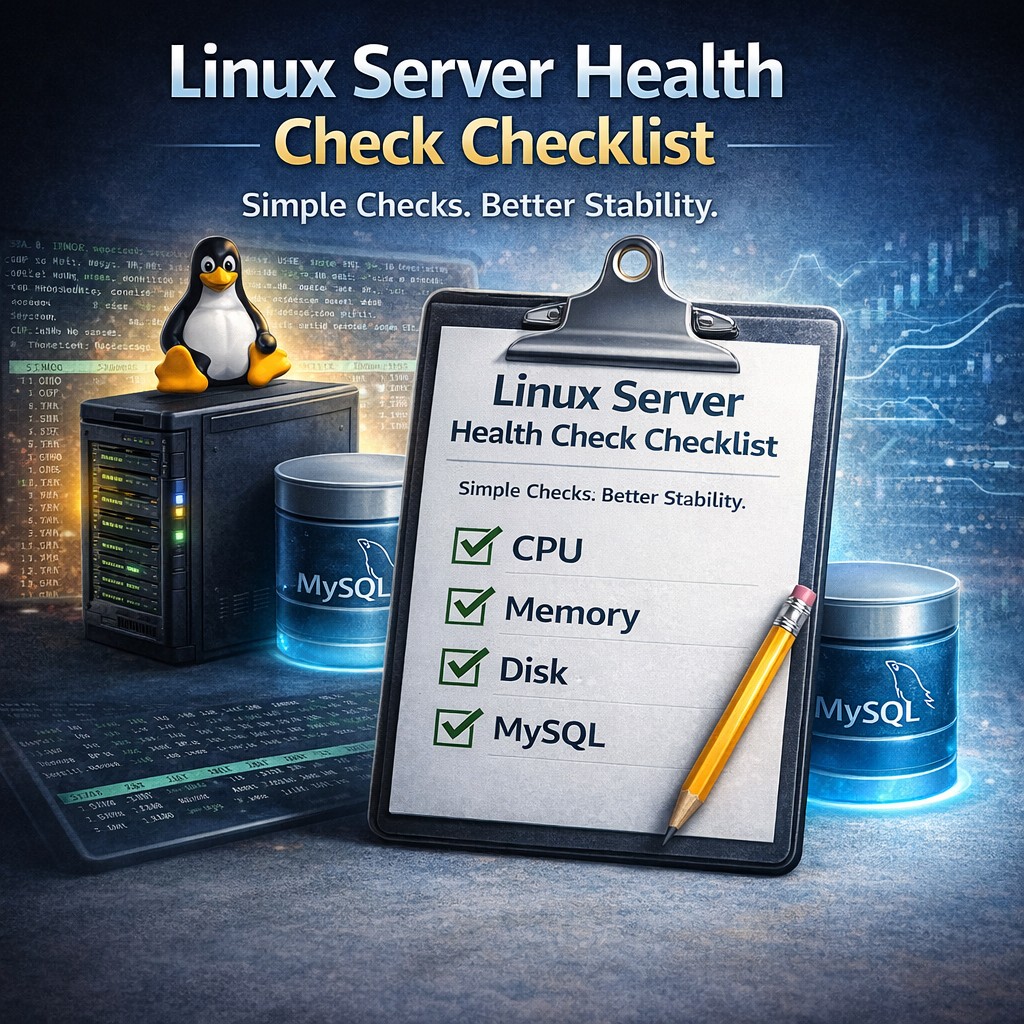
What You Actually Need to Monitor
To monitor a small production server, you only need a few key areas:
1. CPU and Load
- is CPU stable?
- are spikes increasing?
2. Memory
- is memory usage growing?
- is swap being used?
3. Disk
- how fast is disk filling?
- is there risk of failure?
4. MySQL
- connections
- slow queries
- workload changes
That’s it.
These signals detect most real-world issues.
How to Monitor a Linux Server Quickly
A practical monitoring setup should take minutes.
Not days.
The simplest approach:
Step 1 — lightweight installation
Use a small collector instead of a full monitoring stack.
Step 2 — collect key metrics
Focus on:
- CPU
- memory
- disk
- MySQL
Step 3 — track trends
Understand how your system changes over time.
Step 4 — review structured output
Get clear insight instead of raw data.
👉 (Step-by-step: How to Monitor in 5 Minutes)
Monitoring Without Prometheus (And Why It’s OK)
Many guides assume you need Prometheus.
You don’t.
Prometheus is powerful, but it is designed for:
- large-scale systems
- high-frequency metrics
- complex alerting
For small environments, it adds:
- complexity
- maintenance overhead
- unnecessary data
You can monitor your server effectively without it.
Lightweight Monitoring vs Heavy Monitoring
Heavy Monitoring
- dashboards
- alerts
- multiple services
- constant tuning
Lightweight Monitoring
- simple setup
- key signals only
- structured insight
- minimal maintenance
For small environments:
👉 lightweight wins
Real Example: Small Server Monitoring
Let’s say you run:
- 1 Linux server
- 1 MySQL database
- 1 application
With simple monitoring, you can detect:
- disk growing too fast
- MySQL connections increasing
- slow queries appearing
- CPU spikes getting worse
You don’t need a dashboard to see this.
You need consistent visibility.
The Missing Piece: Trend Awareness
Most monitoring setups show current values.
But what matters is:
👉 change over time
Examples:
- disk growing week over week
- memory slowly decreasing
- load increasing
- MySQL workload rising
This is where most failures begin.
Designed for Small Infrastructure
This is exactly what DMCloudArchitect Health focuses on.
Instead of complex monitoring stacks, it provides:
- lightweight infrastructure monitoring
- Linux + MySQL focus
- trend-based analysis
- structured reporting
Built for:
- small production servers
- solo developers
- consultants
- small business infrastructure
Final Thoughts
Simple monitoring is not about doing less.
It’s about doing the right things.
For small Linux environments:
- focus on key signals
- avoid unnecessary complexity
- understand trends
- act early
That’s what keeps systems stable.
Try Simple Infrastructure Monitoring
If you want to monitor your Linux server without complex tools:
👉 https://health.dmcloudarchitect.com
Start in minutes.
Get clear infrastructure insight.
Keep your systems stable.