Monitoring Linux servers is one of those things every developer knows they should do.
But in small environments, it often gets delayed.
Why?
Because most monitoring tools feel too complex, too heavy, and too time-consuming to set up.
If you are running:
-
a small SaaS
-
a personal project in production
-
a few Linux servers
-
a MySQL database
you don’t need enterprise monitoring.
You need simple, reliable visibility into your infrastructure health.
This guide will show you how.
What Is Linux Server Monitoring?
Linux server monitoring is the process of tracking system health and performance over time.
At a basic level, it includes:
-
CPU usage
-
memory usage
-
disk space
-
system load
-
running processes
For database-driven systems, it also includes:
-
MySQL activity
-
slow queries
-
connection load
-
performance trends
The goal is simple:
👉 detect problems before they become outages
Why Monitoring Matters Even for Small Servers
Small environments often assume:
“We only have one or two servers — we don’t need monitoring.”
This is a mistake.
Small systems are actually more fragile because:
-
there is no dedicated operations team
-
issues go unnoticed longer
-
problems are discovered during failure, not before
Most outages in small environments are preventable.
They usually start as:
-
disk filling slowly
-
memory pressure increasing
-
CPU load trending upward
-
MySQL workload growing
-
slow queries accumulating
These are not sudden failures.
They are trends.
👉 (Deep dive: link to Post #2 — Hidden Risk)
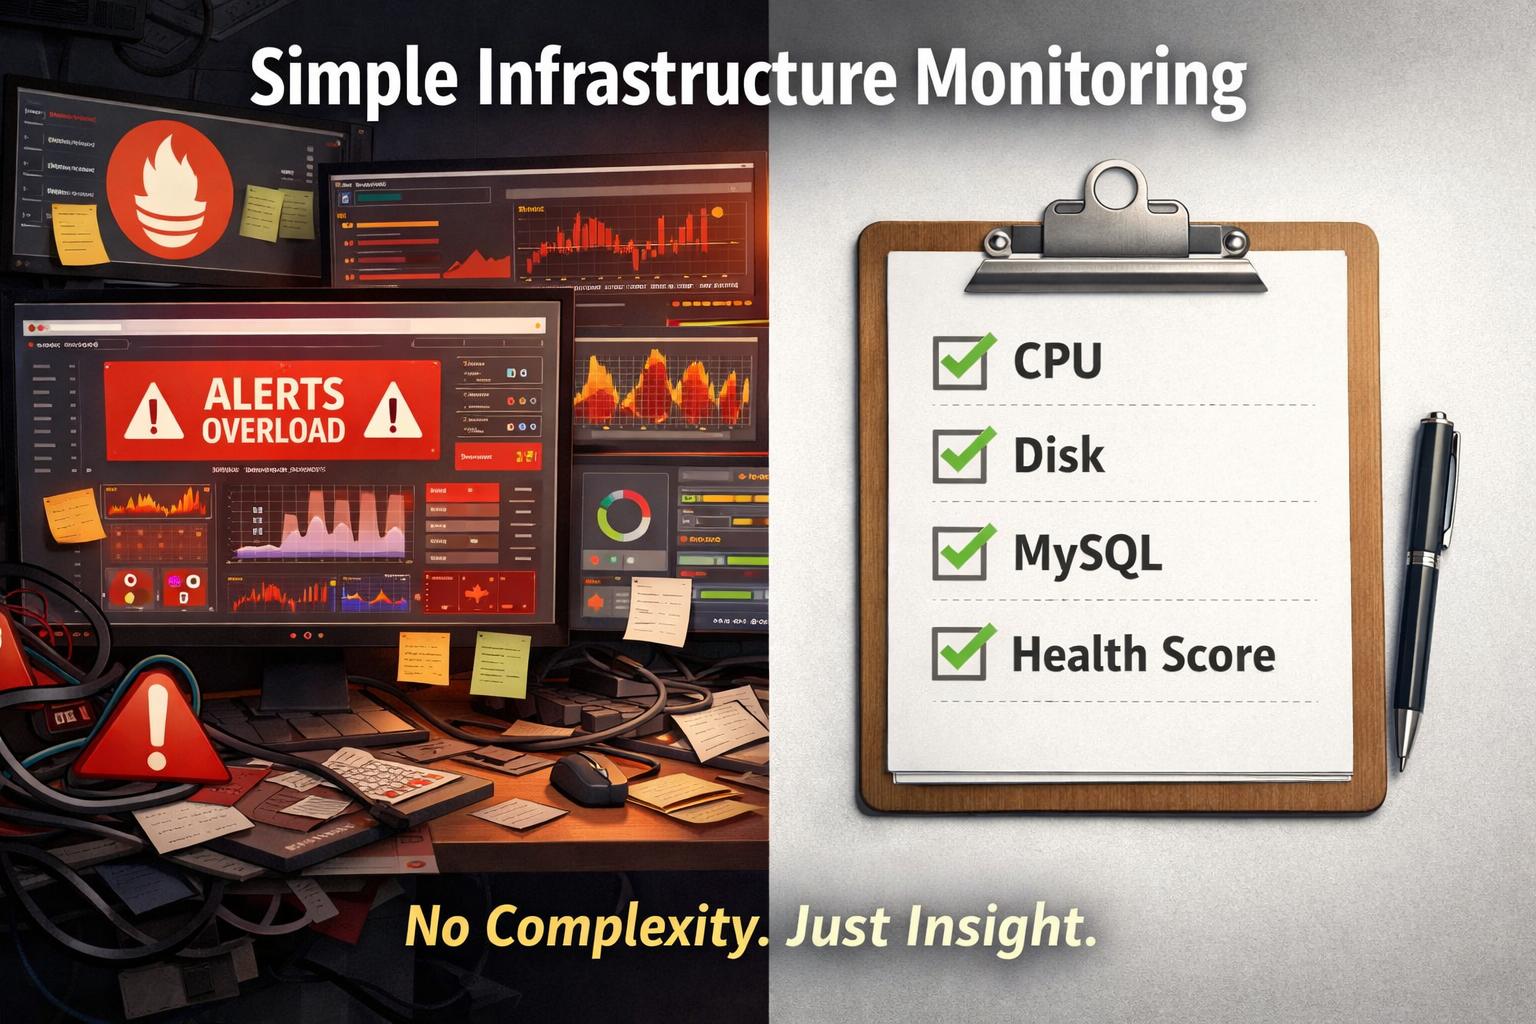
The Problem with Traditional Monitoring Tools
Most monitoring tools were designed for large-scale systems.
They typically require:
-
collectors
-
exporters
-
dashboards
-
alerting systems
-
storage for metrics
Examples include:
-
Prometheus
-
Grafana
-
full observability stacks
These tools are powerful.
But for small environments, they often introduce:
-
setup complexity
-
maintenance overhead
-
alert fatigue
-
unnecessary infrastructure
👉 (Read: Post #1 — Overkill Monitoring)
What Small Infrastructure Actually Needs
Instead of complex monitoring systems, small environments need:
1. Clear health visibility
Not thousands of metrics — just meaningful signals.
2. Trend awareness
Understanding how the system is evolving over time.
3. Early warning signals
Detecting risk before failure.
4. Low maintenance
Monitoring should not become another system to manage.
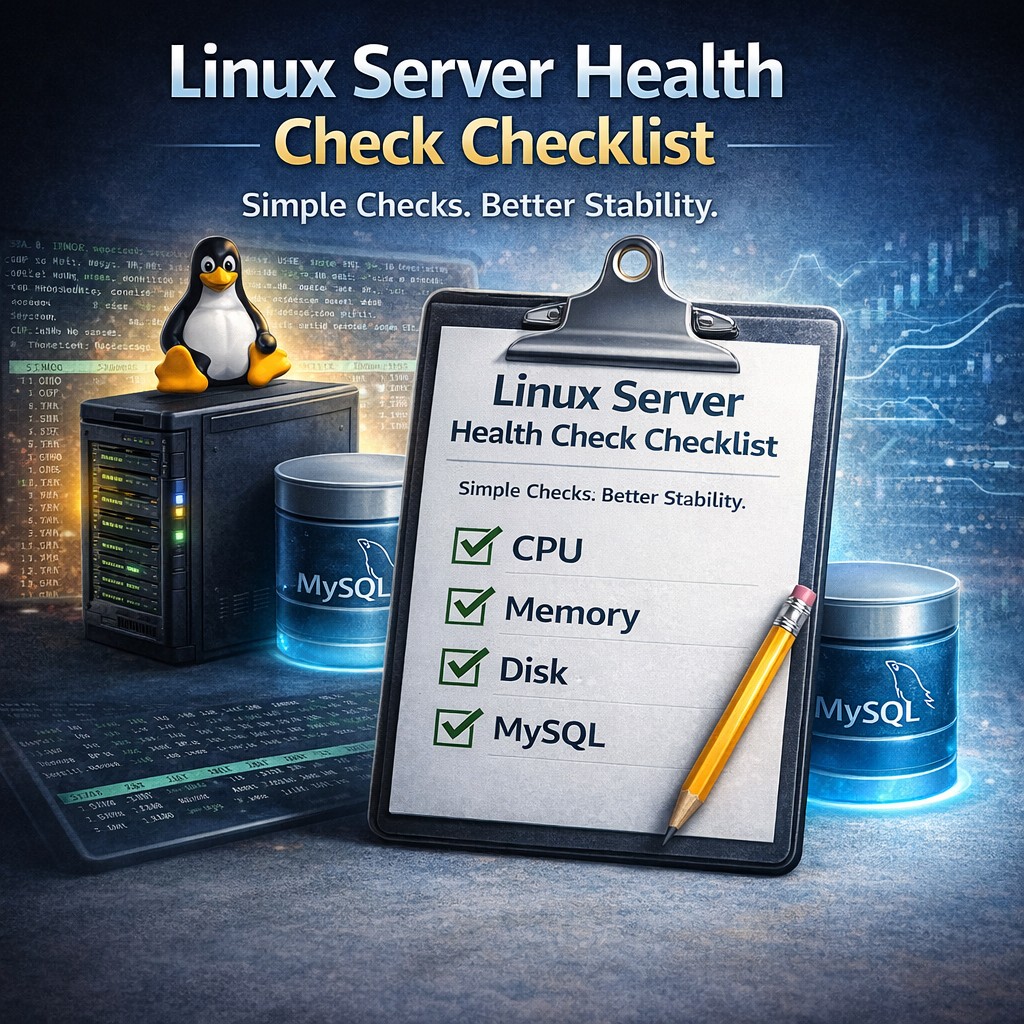
Key Metrics You Should Monitor
Even in the simplest setup, you should track:
System Metrics
-
CPU usage trends
-
memory usage
-
swap activity
-
load average
Disk Metrics
-
total disk usage
-
growth over time
-
risk of exhaustion
MySQL Metrics
-
connections
-
query activity
-
slow queries
-
workload trends
These cover most real-world failure scenarios.
Monitoring vs Health Reporting
This is where most people get it wrong.
Traditional Monitoring
-
real-time alerts
-
dashboards
-
constant observation
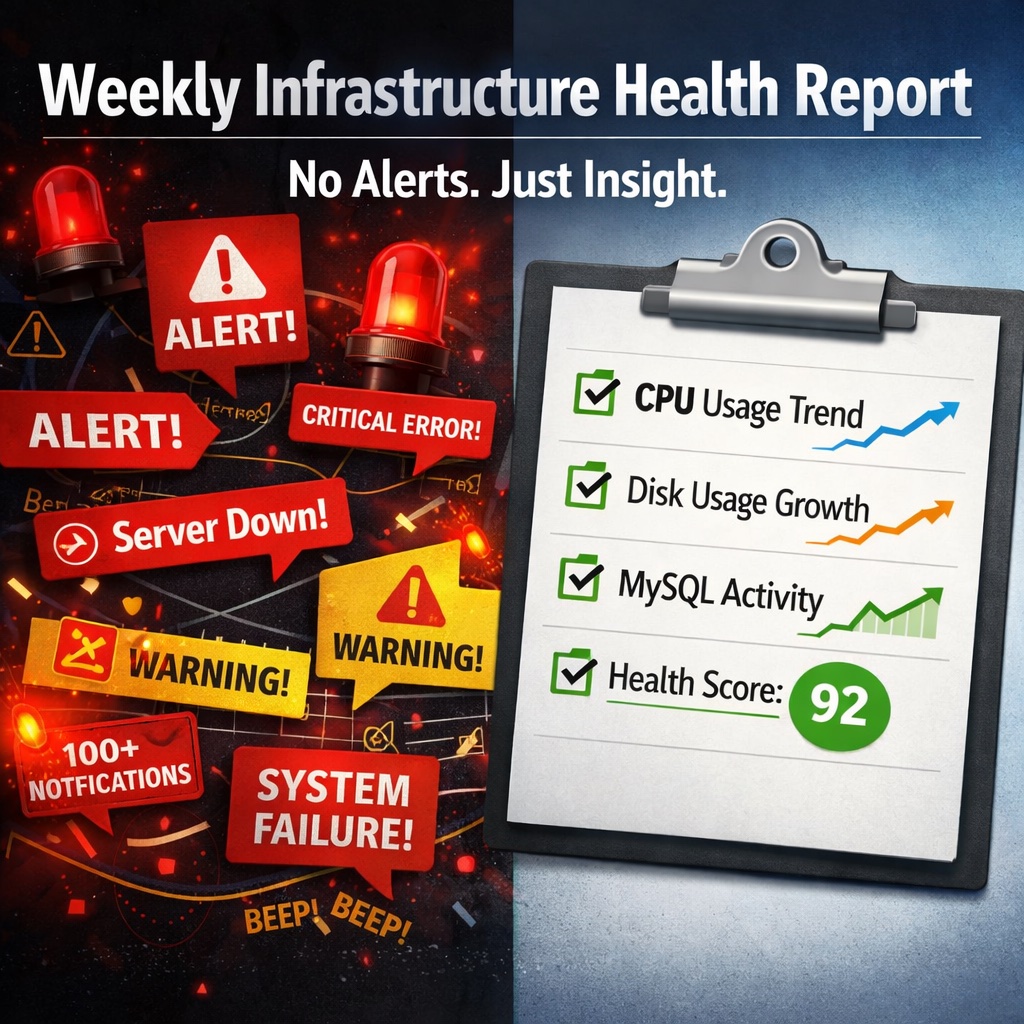
Infrastructure Health Monitoring
-
periodic analysis
-
trend detection
-
structured reporting
For small environments:
👉 health reporting is often more useful than real-time monitoring
👉 (Read: Post #5 — Weekly Health Reports)
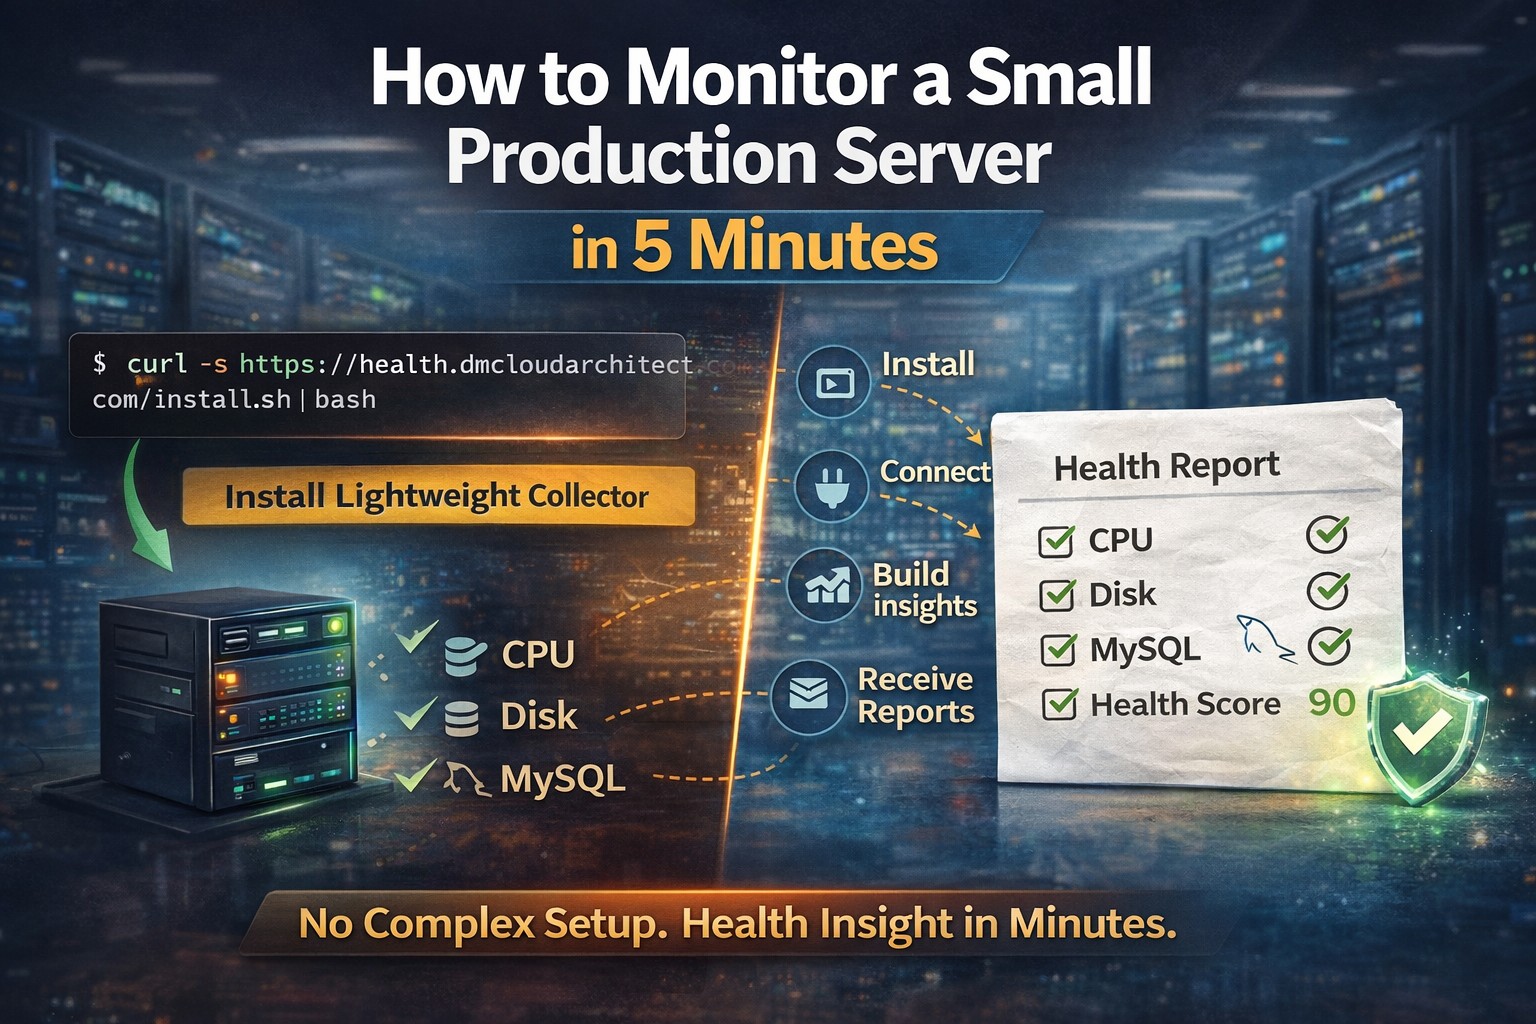
How to Monitor a Linux Server Without Heavy Tools
You don’t need to deploy a full monitoring stack.
Instead, use a lightweight approach:
-
install a small collector
-
gather key system and MySQL signals
-
analyze trends
-
review structured reports
👉 (Step-by-step: Post #4 — 5-minute setup)
👉 (Lightweight approach: Post #3)
The Ideal Monitoring Setup for Small Teams
A practical setup looks like this:
-
minimal installation
-
no dashboards to maintain
-
no alert noise
-
clear periodic reports
-
focus on trends
This reduces operational overhead while still providing visibility.
Common Mistakes to Avoid
1. Overengineering monitoring
Spending more time maintaining monitoring than your actual system.
2. Ignoring monitoring completely
Waiting until something breaks.
3. Relying only on alerts
Missing slow-moving problems.
4. Not tracking trends
Looking only at current state instead of change over time.
A Better Approach for Small Linux and MySQL Environments
This is exactly the gap DMCloudArchitect Health is designed to fill.
It provides:
-
lightweight infrastructure health monitoring
-
Linux and MySQL focus
-
trend-based analysis
-
structured weekly reports
-
minimal setup
Instead of managing monitoring tools, you get:
👉 clear insight into system health
without complexity.
Final Thoughts
Monitoring is not optional.
But it does not have to be complicated.
For small Linux and MySQL environments, the goal is not to build a monitoring platform.
The goal is to:
-
understand your system
-
detect trends early
-
prevent issues
-
stay in control
Simple monitoring done well is better than complex monitoring done poorly.
Start Monitoring in Minutes
If you want a simple way to monitor your Linux servers and MySQL databases:
👉 https://health.dmcloudarchitect.com
Lightweight infrastructure health monitoring designed for small environments.