Infrastructure Trends Monitoring: See Issues Before They Break
Most infrastructure problems don’t appear suddenly—they grow quietly over time. CPU usage creeps up week after week, disk space slowly fills, and query performance degrades just enough to go unnoticed. By the time alerts fire, the issue is already impacting users.
This is where infrastructure trends monitoring becomes essential. Instead of reacting to spikes, teams gain visibility into patterns and can act before systems reach critical thresholds.
Why Trend-Based Monitoring Matters
Traditional monitoring focuses on real-time alerts. While useful, it often creates noise and misses the bigger picture. A server hitting 90% CPU for a few minutes might not matter—but a steady increase from 40% to 80% over two weeks is a clear warning sign.
Trend-based monitoring shifts the focus to:
- Long-term performance changes
- Capacity planning signals
- Gradual degradation in systems
- Predictable failure patterns
For small teams, this approach reduces alert fatigue and provides actionable insights instead of constant interruptions.
What to Track in Server Trend Analysis
Effective server trend analysis focuses on key infrastructure metrics that evolve over time. These are the signals that reveal underlying issues before they escalate.
CPU Usage Trends
Look for gradual increases rather than spikes. A steady rise often indicates growing workloads, inefficient processes, or background jobs accumulating.
Memory Consumption Patterns
Memory leaks or poor caching strategies become visible only when viewed over days or weeks. Short-term monitoring rarely catches these patterns.
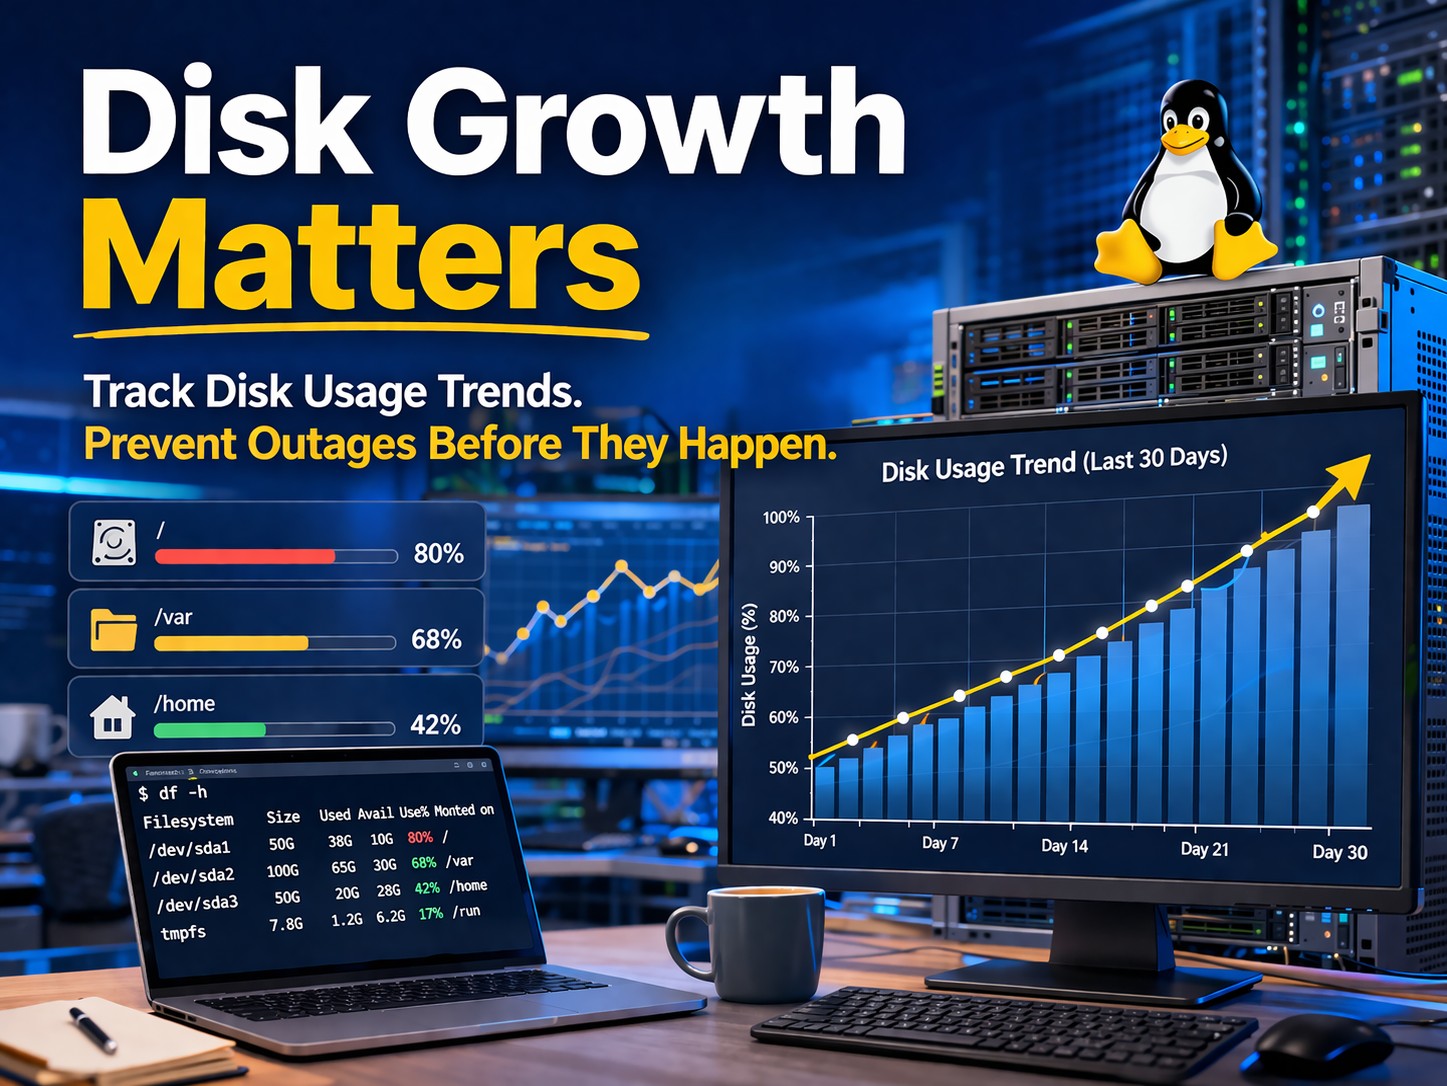
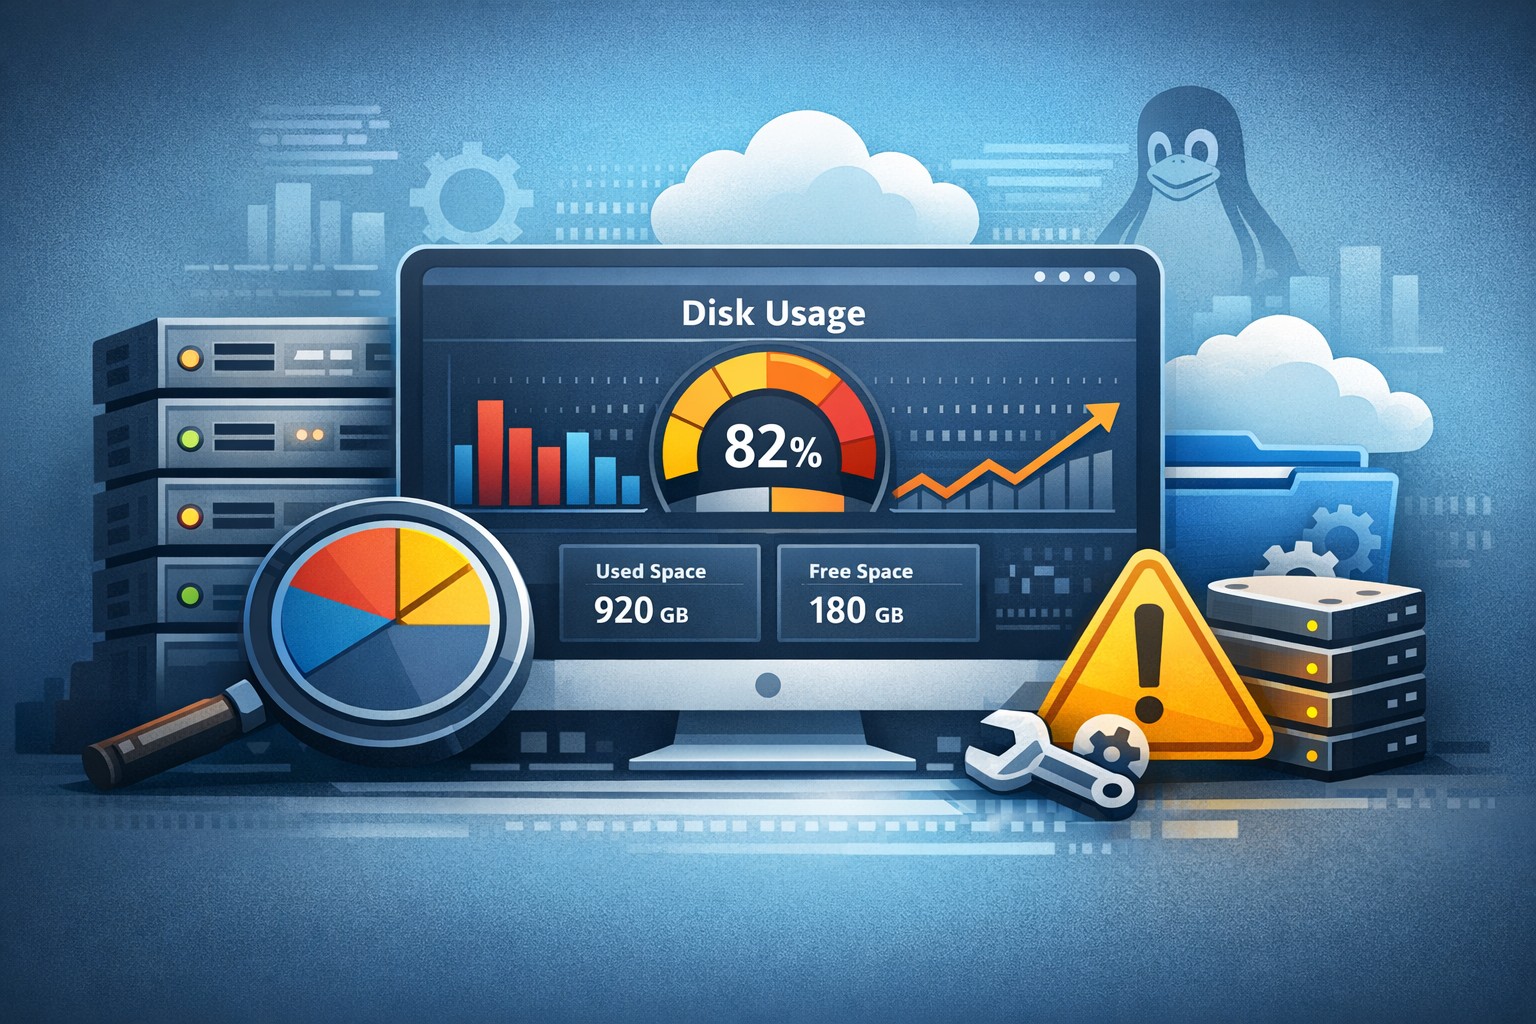
Disk Growth and I/O Behavior
Disk usage rarely jumps instantly. Monitoring how storage fills over time helps predict when capacity will run out—and prevents emergency cleanup situations.
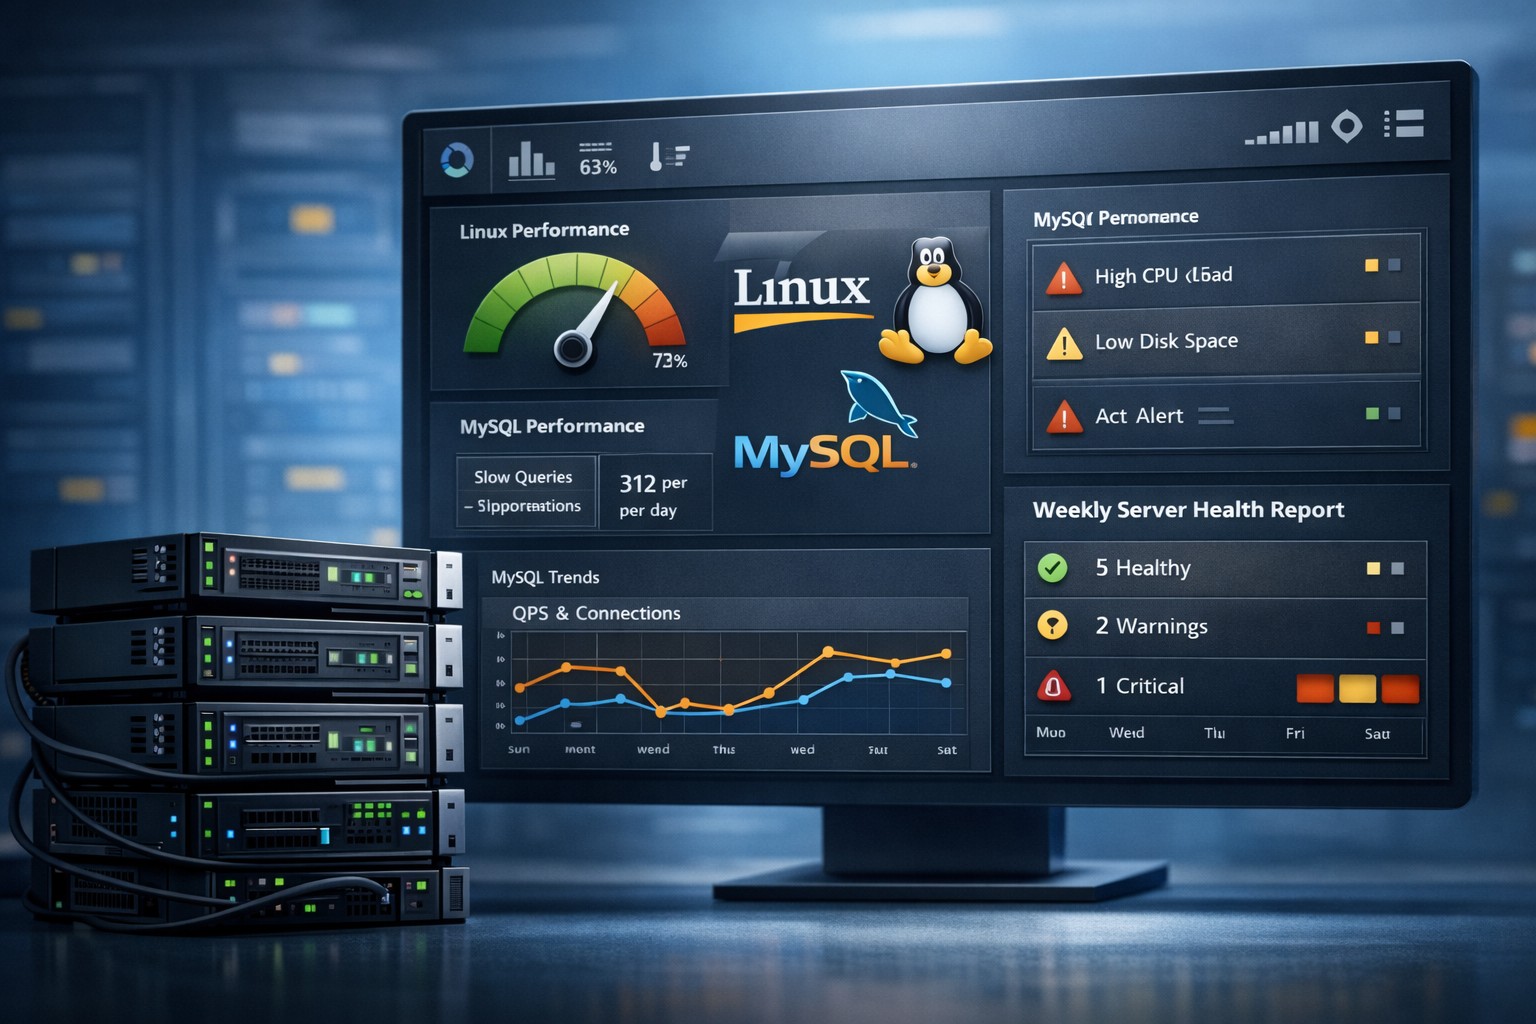
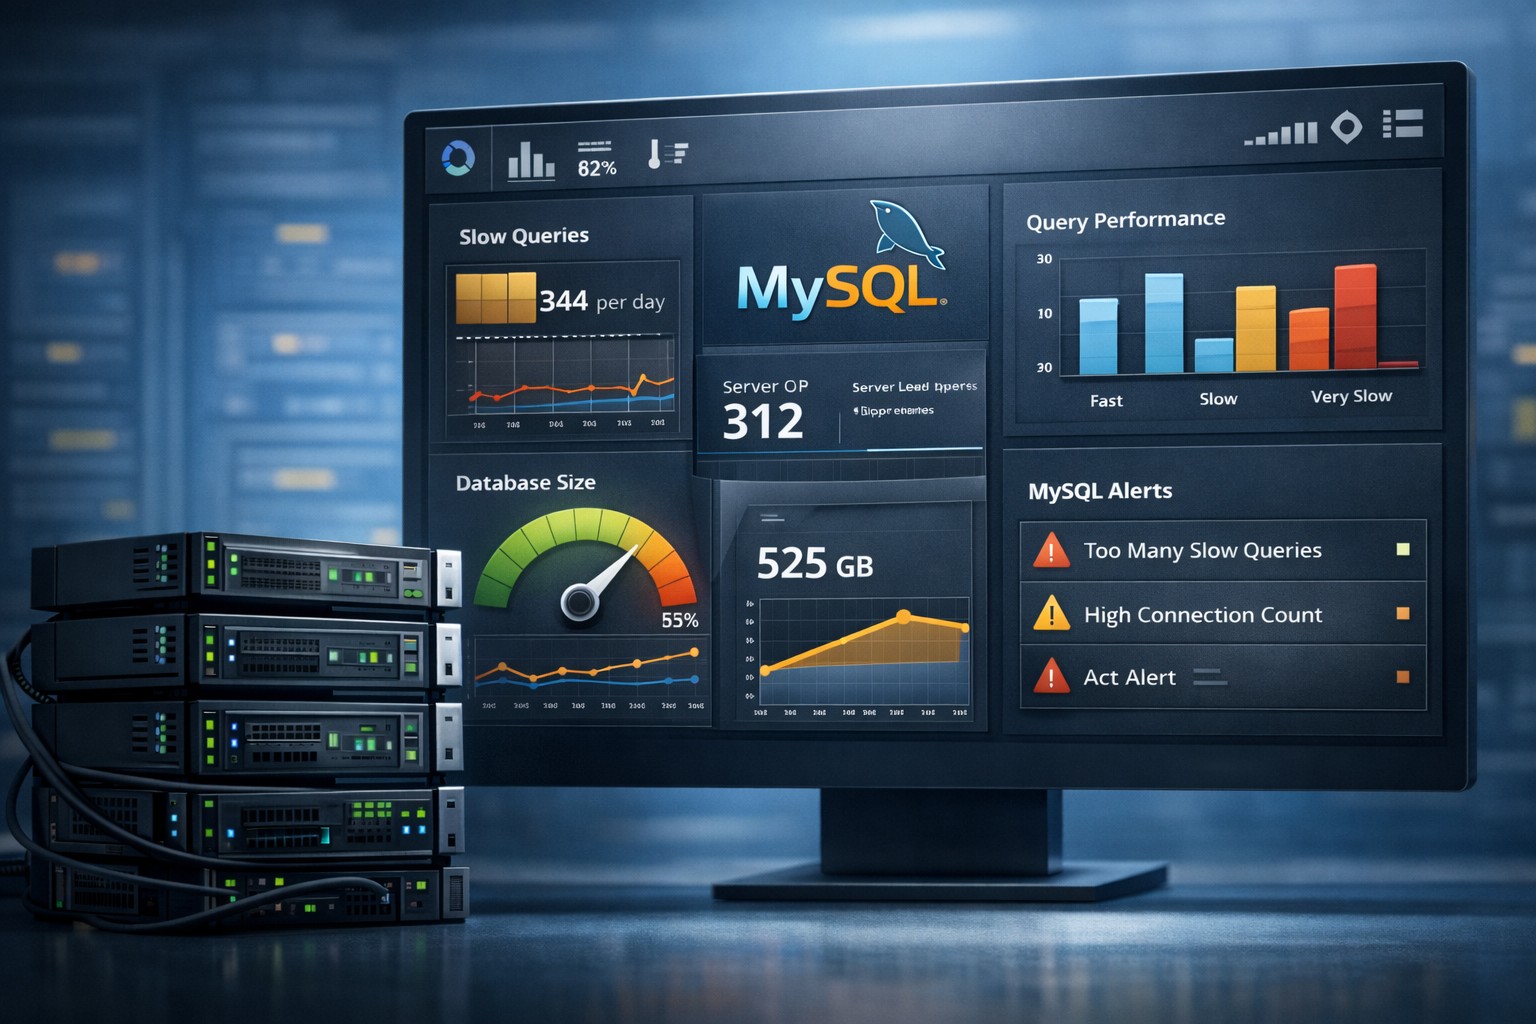
MySQL Performance Trends
Slow queries, increasing execution times, and growing table sizes are classic examples of issues that evolve gradually. Historical visibility is key to understanding them.
How Trend Based Monitoring Works in Practice
A practical trend based monitoring server setup doesn’t need to be complex. The goal is to collect metrics consistently and review them in a structured way.
Typical workflow:
- Collect system and database metrics at regular intervals
- Store historical data for at least several weeks
- Aggregate metrics into daily or weekly summaries
- Visualize trends using simple graphs
- Review reports regularly instead of relying only on alerts
This approach allows teams to monitor server trends over time without introducing heavy observability tools.
Real-World Example: Gradual Resource Saturation
Consider a Linux server running a business-critical application. Everything appears stable in real-time monitoring. No alerts, no obvious spikes.
However, a weekly report shows:
- CPU usage increasing by 5% each week
- Memory utilization slowly rising
- Disk usage growing consistently due to logs
Individually, these changes seem harmless. Together, they indicate a system that will reach its limits within weeks.
With historical server monitoring, the team can:
- Optimize application performance
- Rotate or compress logs earlier
- Plan capacity upgrades in advance
Without it, the first sign of trouble would likely be downtime.
A Lightweight Approach for Small Teams
Many organizations avoid trend monitoring because they associate it with complex observability stacks. In reality, it can be lightweight and highly effective.
The key is consistency, not complexity:
- Simple data collection scripts
- Scheduled reporting instead of constant dashboards
- Focus on meaningful metrics, not everything
- Weekly or daily summaries instead of raw data overload
This aligns especially well with environments running Linux and MySQL, where predictable workloads and gradual changes are common.
From Reactive to Predictive Operations
Performance trend monitoring transforms how teams manage infrastructure. Instead of reacting to incidents, they begin to anticipate them.
This shift leads to:
- Fewer production outages
- Better resource planning
- Reduced firefighting
- More stable systems overall
Over time, teams build confidence in their infrastructure because they understand how it behaves—not just when it fails.
Summary
Infrastructure trends monitoring provides a clear advantage: visibility into how systems evolve over time. By focusing on patterns instead of isolated events, teams can detect issues earlier, plan capacity more effectively, and avoid unnecessary downtime.
If you want a practical way to gain this visibility without adding complexity, explore Infrastructure Health Reporting. It’s designed to help small teams track meaningful trends and stay ahead of infrastructure problems.