Back to Blog
Disk Usage Trends in Linux Servers: Predict Outages Before They Happen

Disk Usage Trends in Linux Servers: Predict Outages Before They Happen

      Disk Monitoring    2 min read    172 views

Disk Problems Are Slow, Not Sudden

Most disk failures in Linux servers are not caused by sudden spikes. They are the result of gradual growth over time.

Logs accumulate. Backups expand. Temporary files never get cleaned up.

Eventually, the system runs out of space — and everything breaks.

You don’t need more alerts. You need better visibility over time.

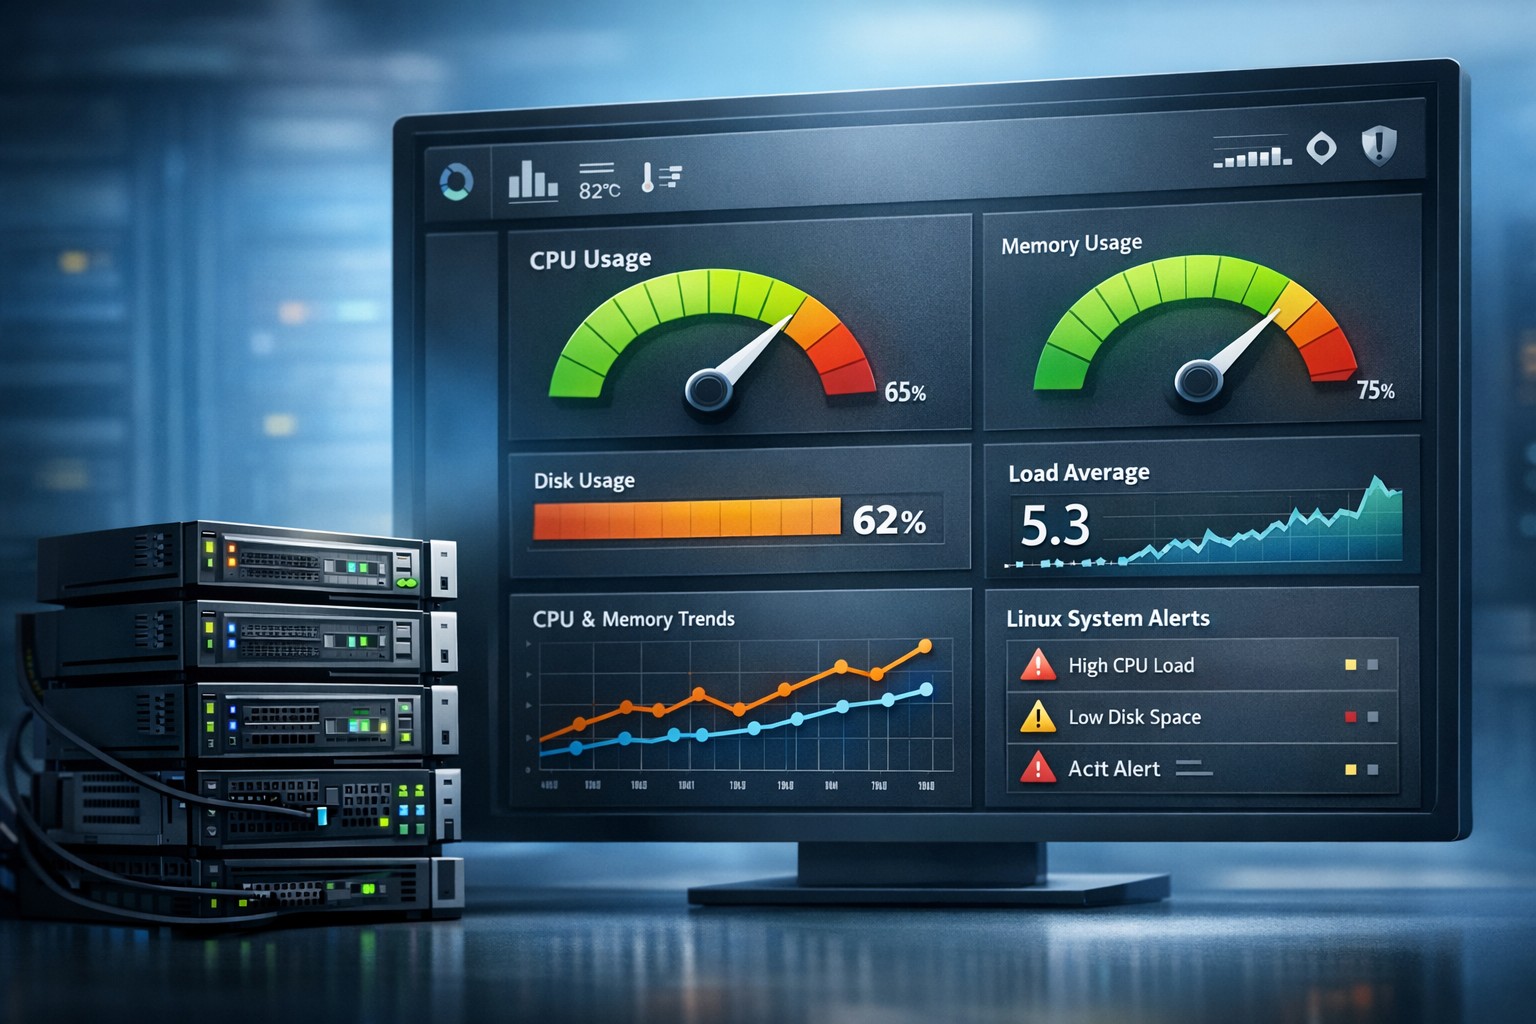
The Problem with Traditional Monitoring

Most monitoring systems only alert when disk usage crosses a threshold (e.g., 90% full).

By then, it's already too late:

  • Applications start failing
  • Databases stop writing
  • System services crash

Threshold-based monitoring reacts late. It does not explain how you got there.

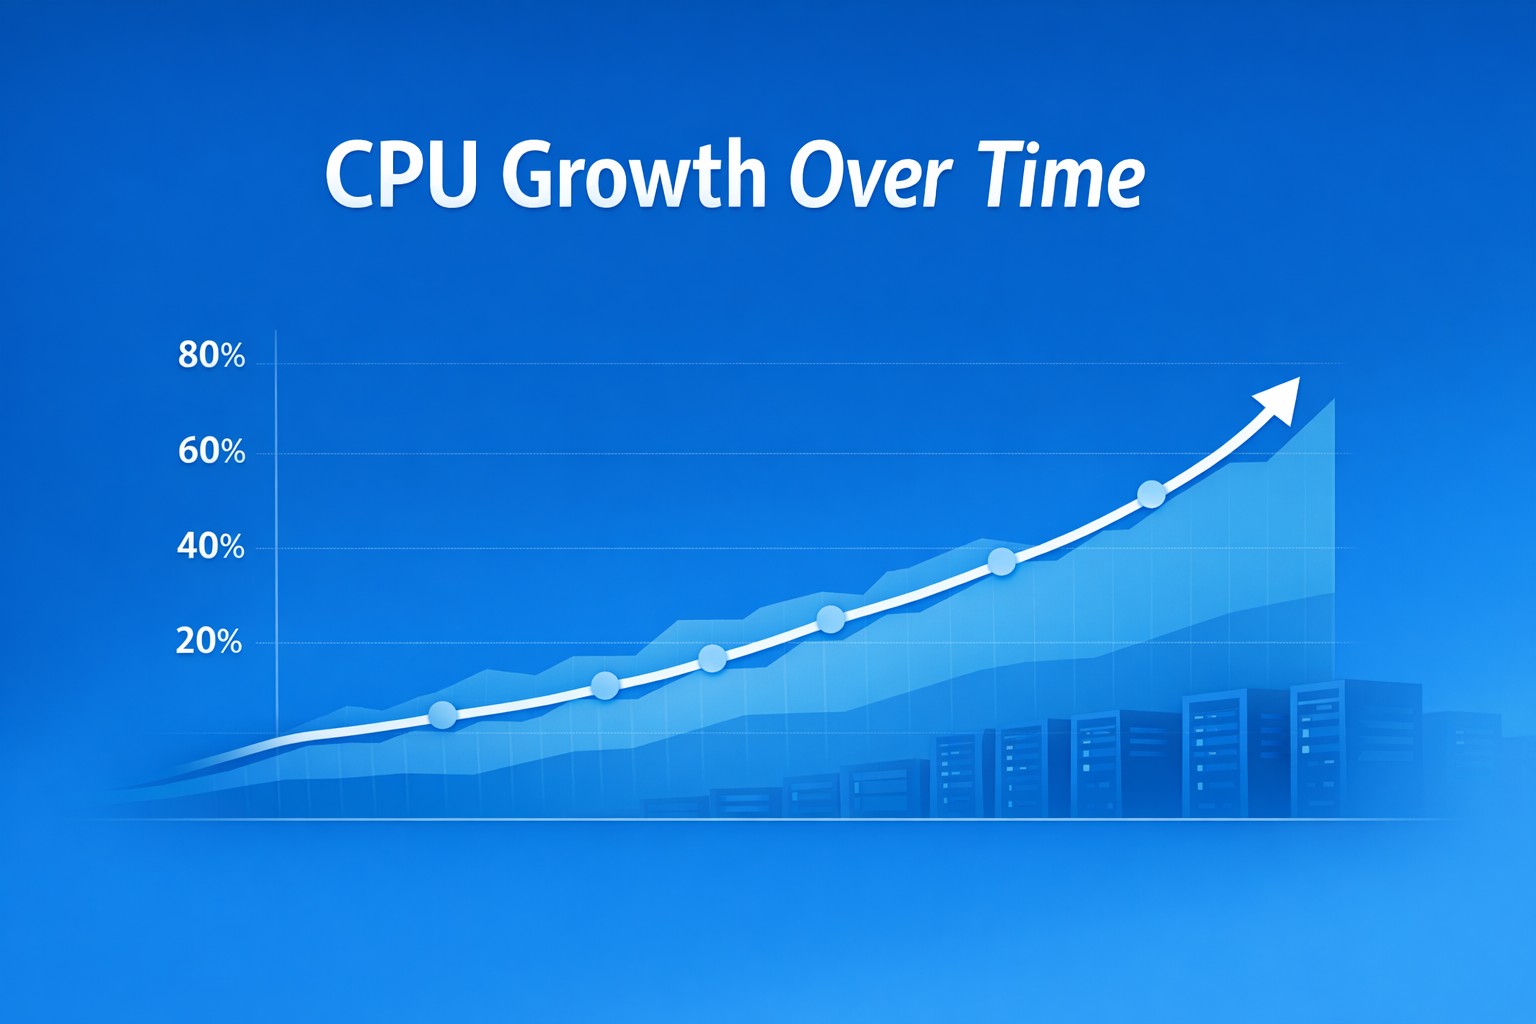
What Disk Usage Trends Reveal

Tracking disk usage trends in Linux servers gives you a completely different perspective.

Instead of asking “How full is the disk?”, you ask:

  • How fast is disk usage growing?
  • When will it reach capacity?
  • Is growth consistent or accelerating?

This is where infrastructure health reporting becomes critical.
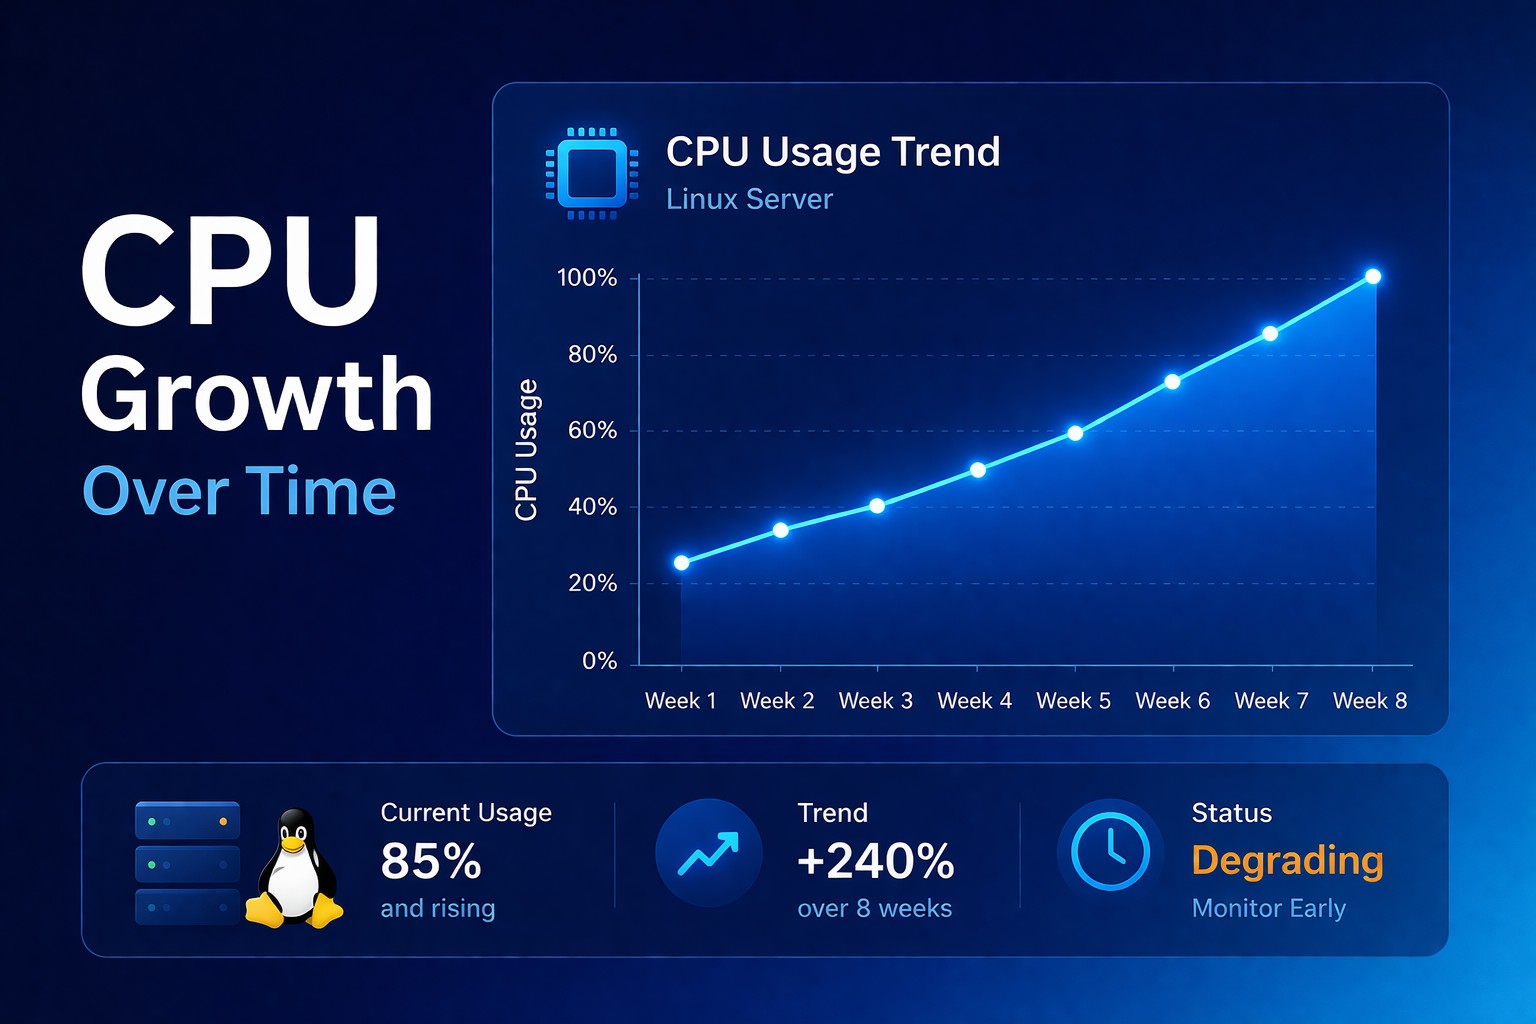
Real-World Example

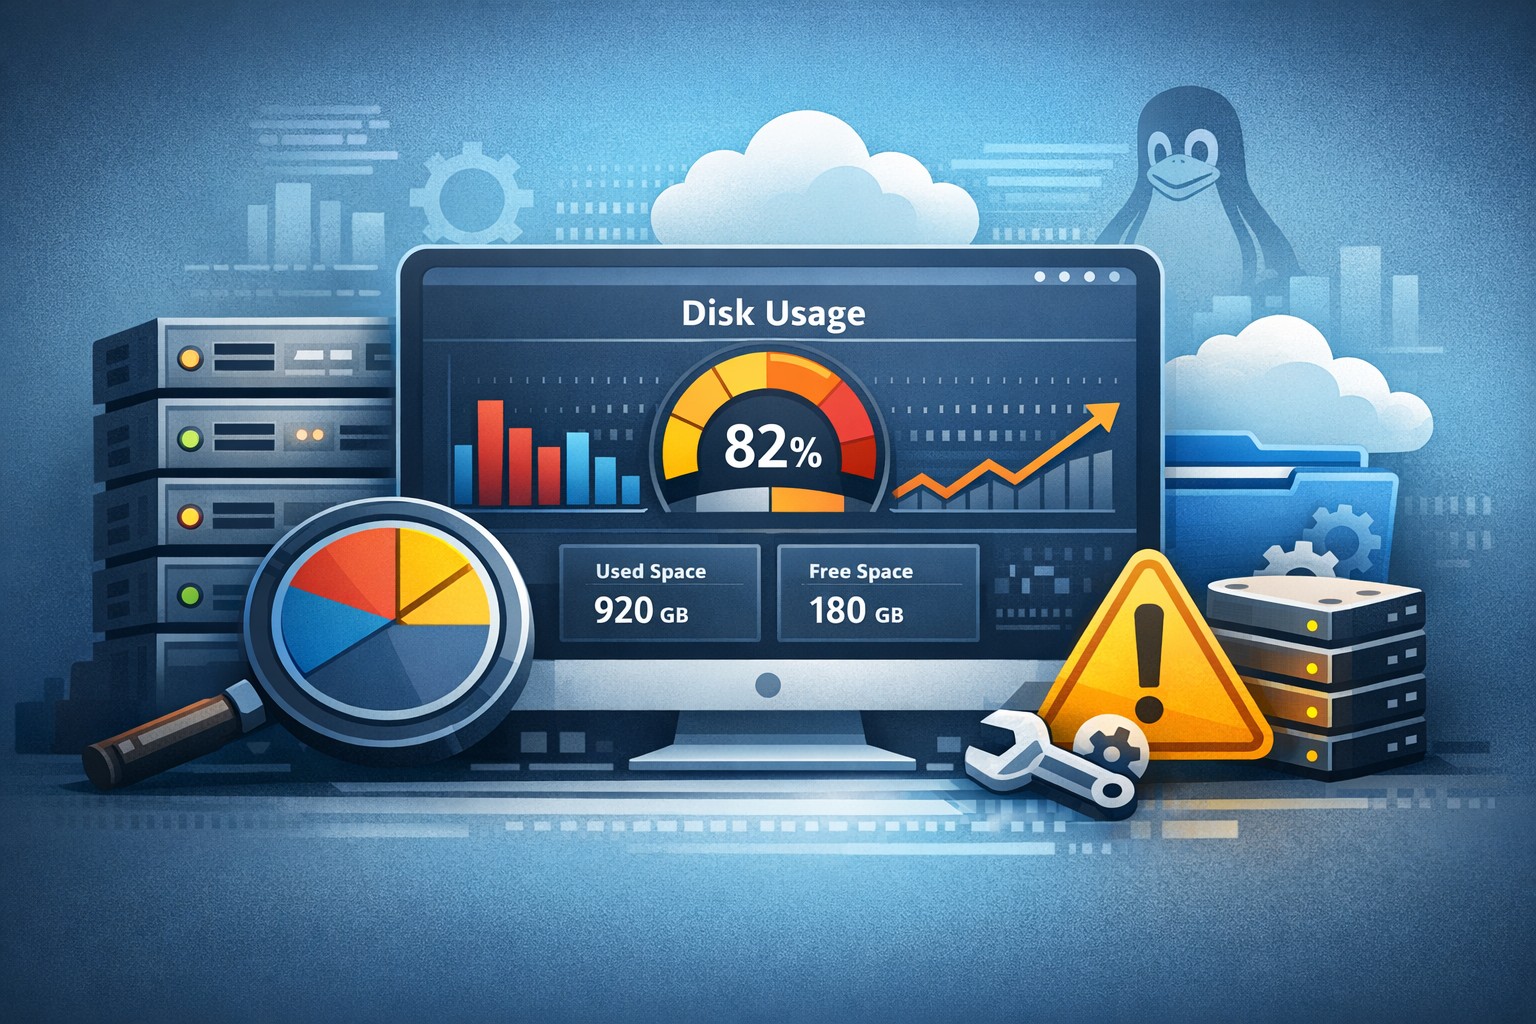
A server shows 65% disk usage. No alerts. Everything looks fine.

But trend data shows:

  • +2% growth per day
  • Consistent increase over 30 days

The disk will be full in less than 3 weeks.

Without trend visibility, this risk remains hidden.

Key Metrics to Track

  • Total disk usage (%)
  • Daily growth rate
  • Top directories by size
  • File system trends over time

Disk Capacity Planning Becomes Simple

When you track disk space usage over time:

  • You can forecast capacity needs
  • You avoid emergency cleanups
  • You eliminate unexpected outages

Early Detection Changes Everything

  • Detect abnormal growth early
  • Identify leaks (logs, temp files, backups)
  • Act before systems fail

Disk problems are predictable if you track trends.

Conclusion

Disk outages are not random events. They are the result of gradual, visible growth.

If you only rely on alerts, you will always react too late.

If you track trends, you can prevent failures before they happen.

You don’t need more alerts. You need better visibility over time.


Take Action

About the Author

Oracle Cloud Infrastructure expert and consultant specializing in database management and automation.

All Tags
#Advanced #alerts #Bash #bash cpu monitoring script #bash monitoring #bash scripting #Beginner #Best Practices #block volume backup #Capacity Planning #cloud backup strategy #cpu bottleneck #CPU Monitoring #cpu monitoring linux #cpu monitoring script linux #cpu trends #cpu usage trends #cpu usage trends linux #create oracle db system in oci #cron cpu monitoring #cron cpu monitoring linux #cron jobs #database monitoring #database performance #detect slow queries mysql #devops #disk capacity planning server #disk forecasting linux #disk growth trend linux #Disk Monitoring #disk usage #disk usage script linux #disk usage trends #Early Detection #easy infrastructure monitoring #free-tier #Guide #health dashboards #Health Reporting #historical server monitoring #how to monitor cpu usage linux #infrastructure #infrastructure health #infrastructure health dashboard #infrastructure health reporting #infrastructure monitoring #infrastructure monitoring report #infrastructure trends #infrastructure trends monitoring #Infrastructure Visibility #lightweight linux monitoring #lightweight monitoring #linux #linux administration #linux cpu monitoring #linux cpu usage #linux disk capacity planning #linux disk usage #Linux monitoring #linux monitoring setup #linux monitoring tools #linux performance #linux performance monitoring #linux server #linux server monitoring #linux servers #linux storage #linux tools #low maintenance monitoring #monitor cpu usage over time linux #monitor linux server health #monitor server trends #monitor small production server #monitoring without complexity #MySQL #mysql health reporting #MySQL monitoring #mysql optimization #MySQL Performance #mysql performance degradation #mysql performance monitoring #mysql performance trends #mysql query performance issues #mysql server monitoring #mysql slow queries #mysql slow query analysis #mysql slow query monitoring #mysql trends #mysql-health #networking #nsg #OCI #oci backup #oci bastion tutorial #oci block volume #oci infrastructure as code #OCI monitoring #oci networking #oci oracle database private subnet setup #oci oracle database tutorial #oci security #oci setup guide #oci terraform tutorial #oci tutorial for beginners #oci vcn terraform #oci virtual machine db system guide #oracle base database service tutorial #oracle cloud bastion #oracle cloud free tier tutorial #oracle cloud infrastructure step by step #oracle cloud infrastructure tutorial #oracle cloud storage #oracle database on oci setup #oracle-cloud #Performance #Performance Degradation #performance monitoring #performance trend monitoring #performance trends #plan disk growth server #practical server monitoring #predict disk usage growth #private instance access #query optimization #Security #security lists #server health #server health reporting #server health weekly report #server monitoring #Server Performance #server trend analysis #server-trends #simple cpu monitoring linux #simple linux monitoring #simple monitoring small business #simple monitoring system #simple ops monitoring #slow queries #slow query reporting mysql #small business infrastructure #small business IT #small business servers #small infrastructure monitoring #small server monitoring #ssh bastion #storage capacity planning linux #storage monitoring #subnets #System Health #system health reporting #terraform oci compute #terraform oracle cloud infrastructure #Trend Monitoring #trend-analysis #trends #Tutorial #vcn