Most infrastructure problems don’t appear suddenly. They build slowly — CPU usage creeps up, disk fills over weeks, and database queries gradually become slower.
But here’s the problem: traditional monitoring rarely shows you this clearly. It focuses on real-time alerts, not long-term behavior.
This is where performance trend monitoring changes everything.
What Is Performance Trend Monitoring?
Performance trend monitoring is the practice of tracking how system metrics evolve over time rather than just observing their current state.
Instead of asking:
- Is CPU high right now?
- Is memory full?
You start asking:
- Is CPU usage increasing week over week?
- Is memory pressure building gradually?
- Is disk growth accelerating?
This shift turns monitoring into something far more useful — visibility.
Why Real-Time Monitoring Falls Short
Here’s the thing… alerts are reactive by design.
They tell you when something is already wrong, not when it's becoming a problem.
In smaller environments, this often leads to:
- alert fatigue
- missed early warning signs
- constant interruptions
- no understanding of long-term behavior
And over time, teams either ignore alerts or get overwhelmed by them.
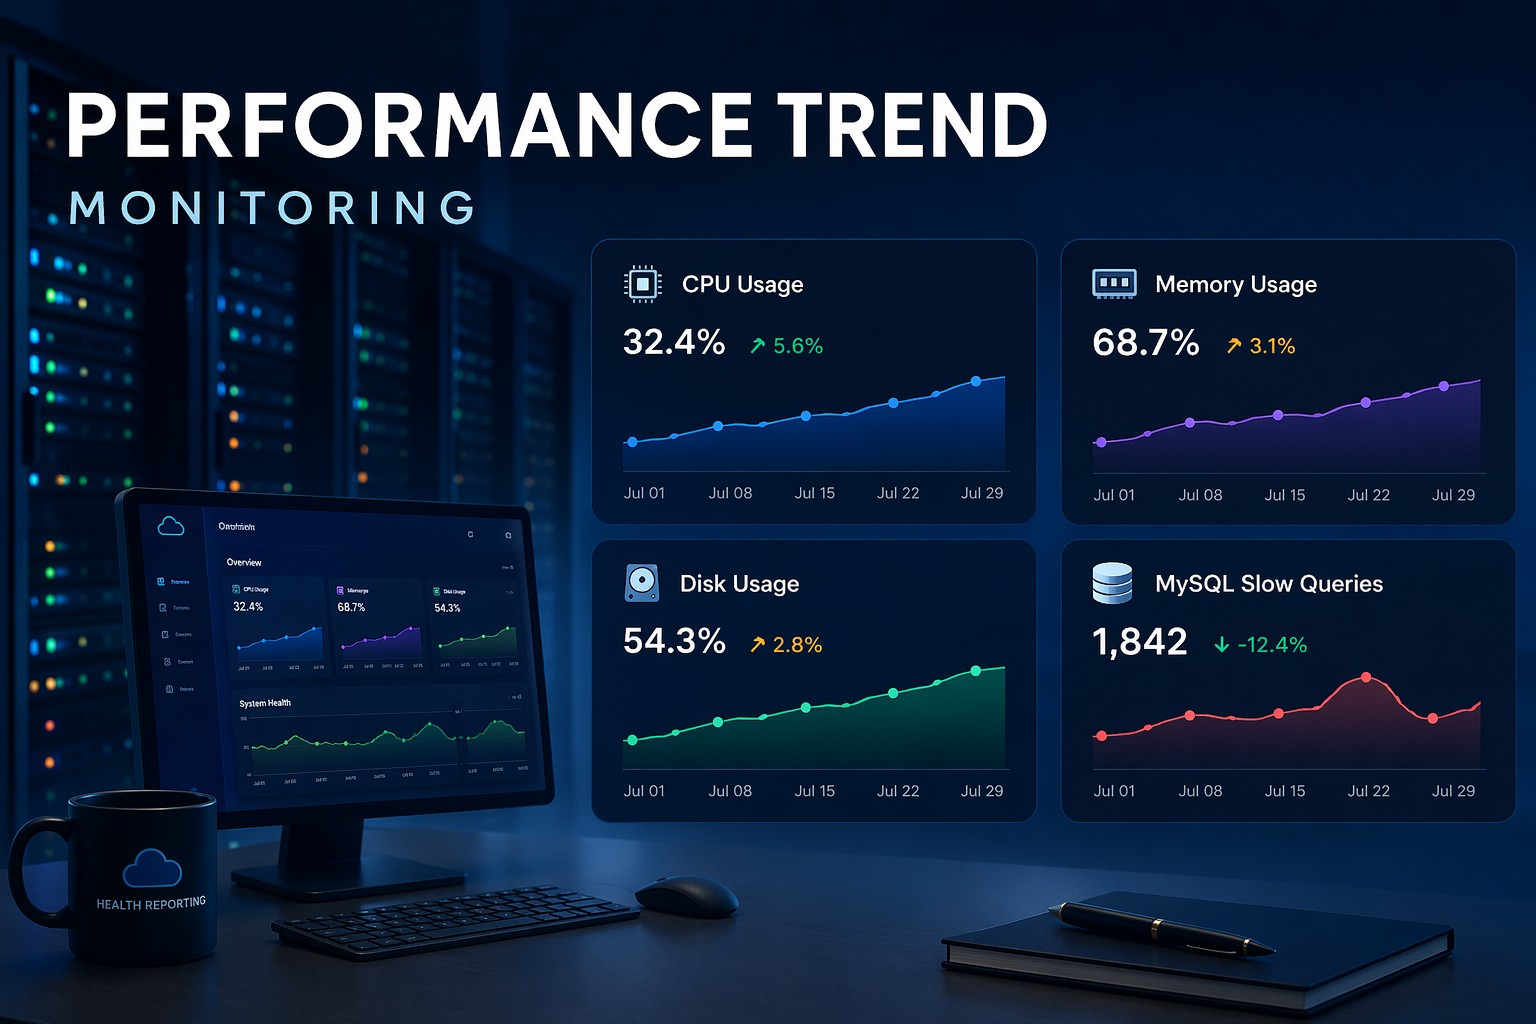
What Trend-Based Monitoring Reveals
Performance trend monitoring focuses on patterns instead of spikes.
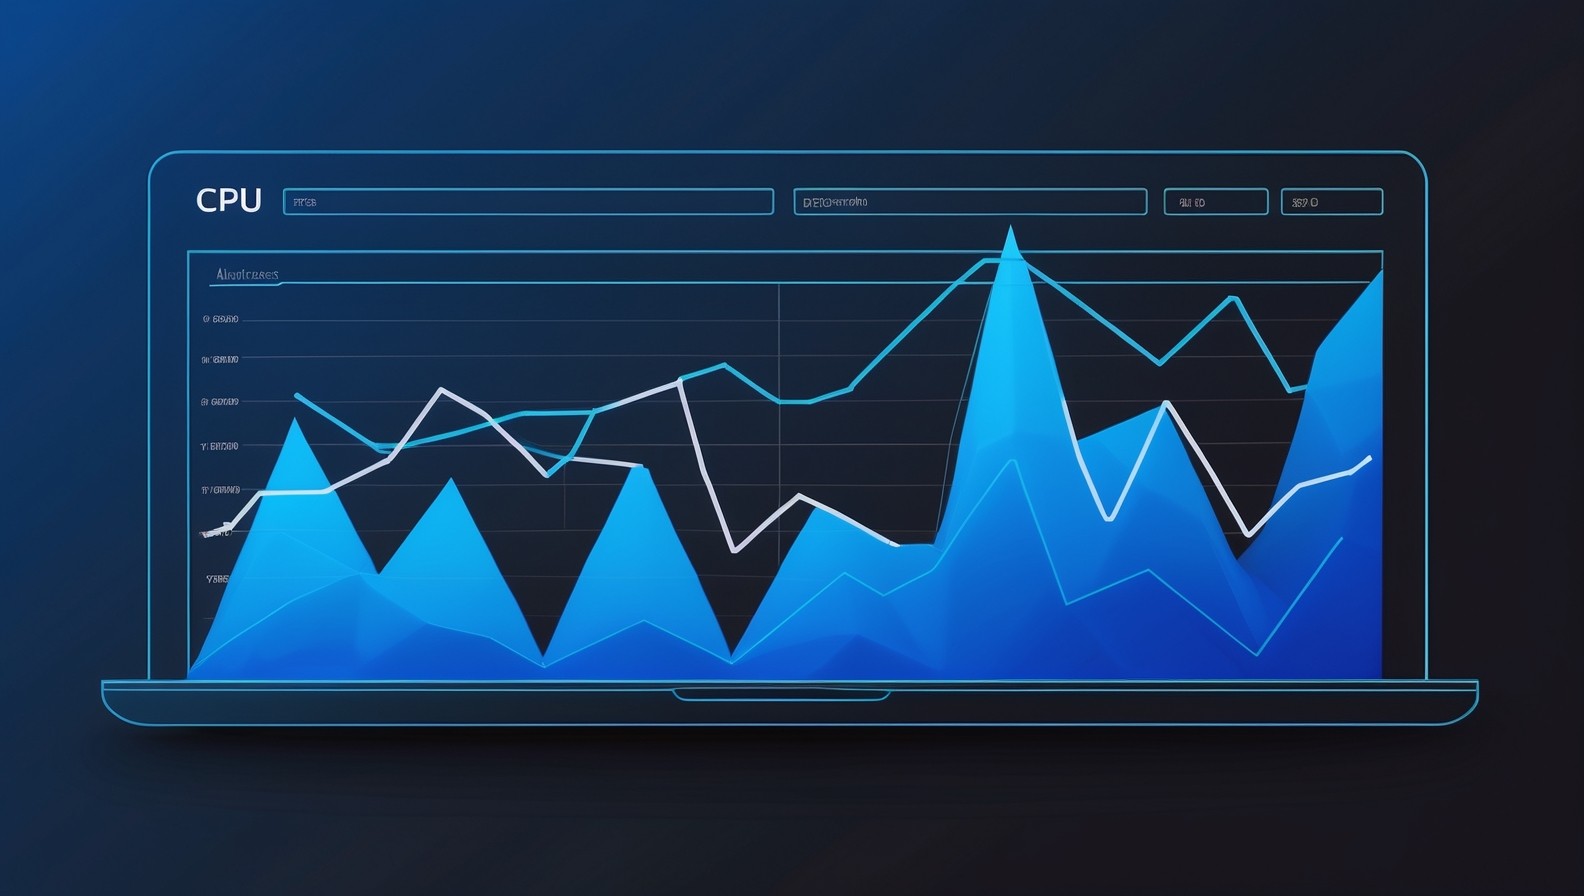
1. CPU Trends
A system running at 40% CPU today might seem fine. But if it was 15% last month, that trend tells a different story.
2. Disk Growth
Disk rarely fills overnight. It grows steadily — like a slow leak. Trend monitoring shows when you’re heading toward a limit before it becomes urgent.
3. Memory Pressure
Gradual increases in memory usage or swap activity often indicate inefficient processes or growing workloads.
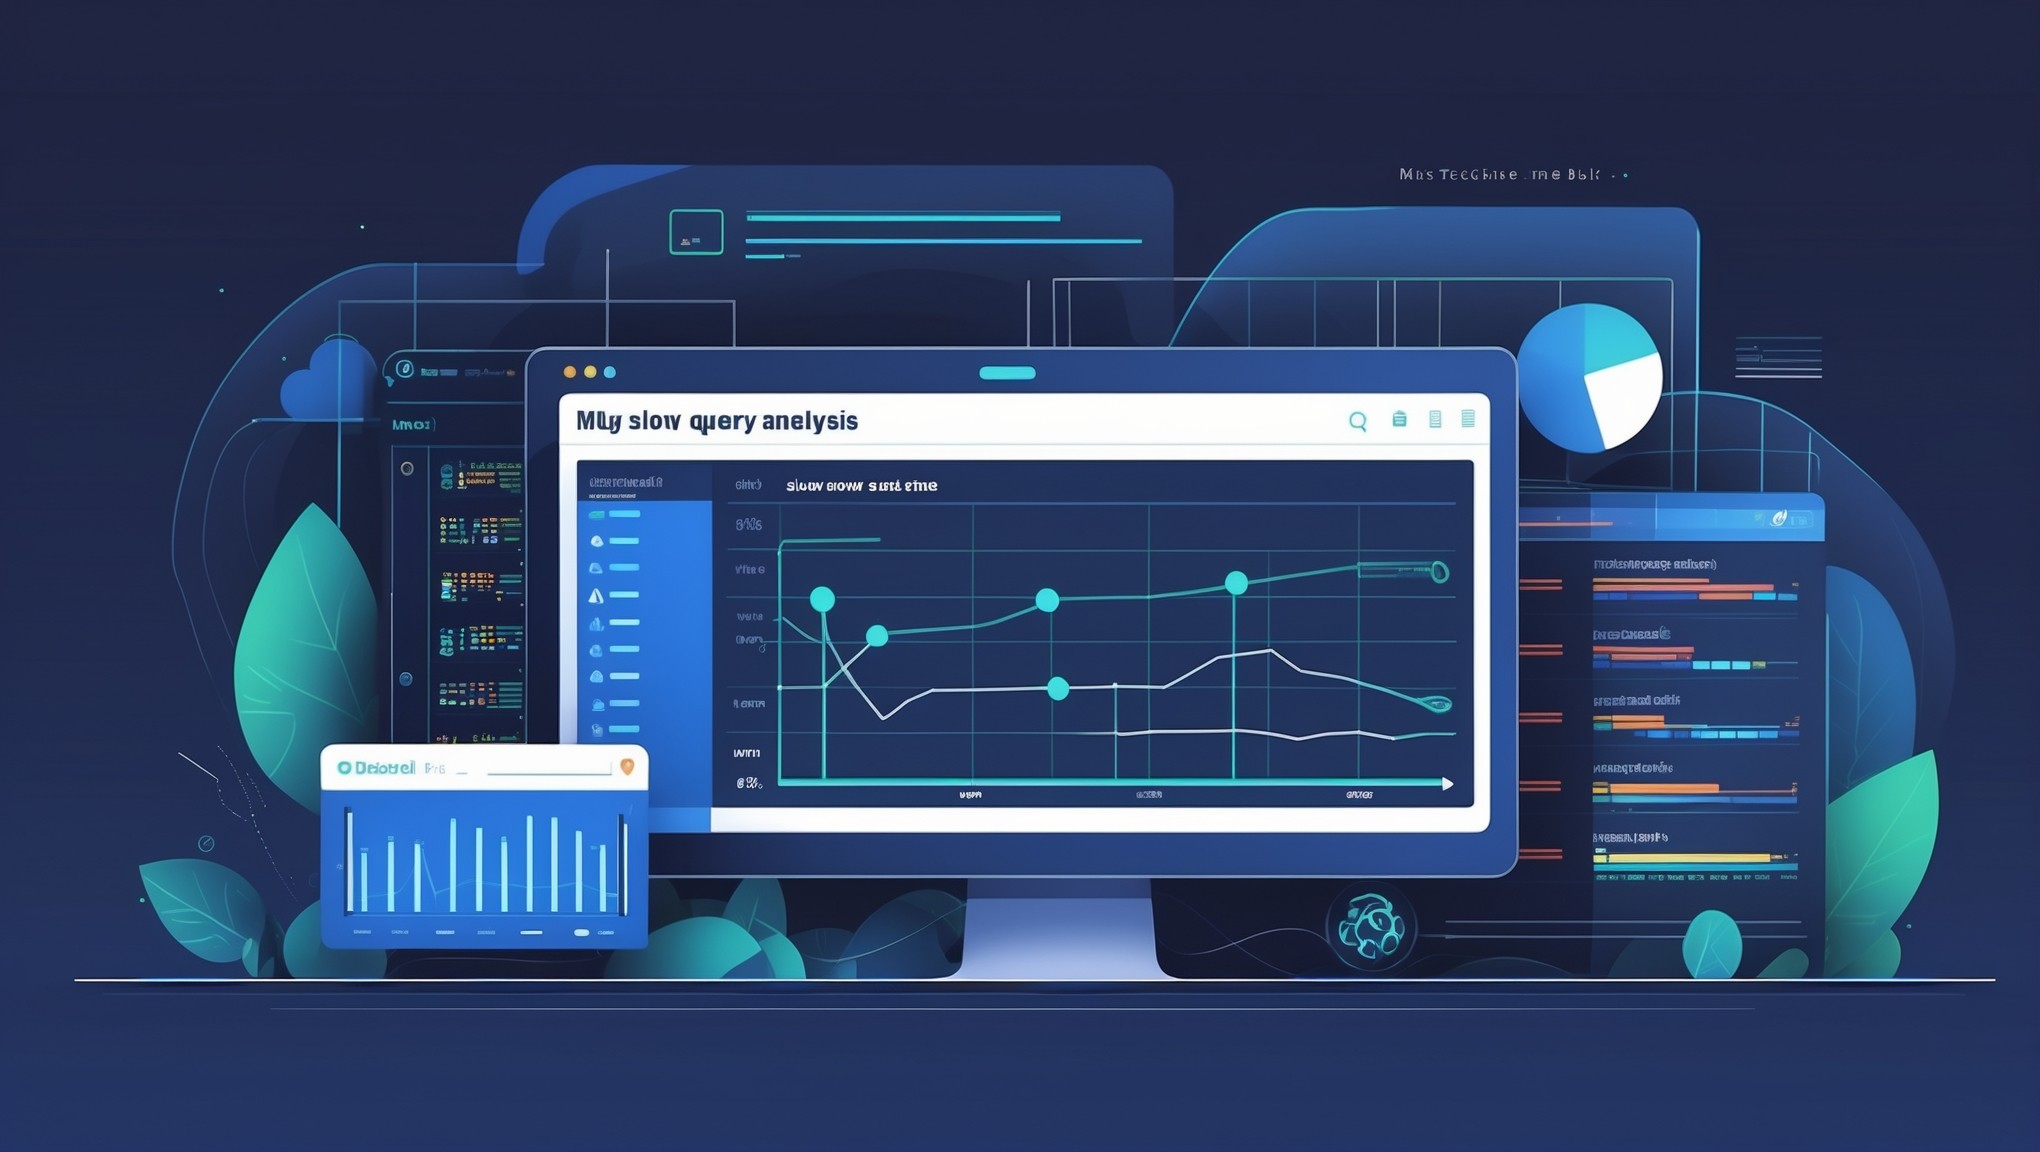
4. MySQL Performance
Slow queries don’t suddenly appear. They increase in frequency. Tracking query trends helps you catch performance degradation early.
Real-World Example
Let’s say you’re running a small production server.
Everything looks stable day-to-day. No alerts. No incidents.
But over three weeks:
- CPU peaks become more frequent
- Disk usage grows faster than expected
- MySQL connections slowly increase
Individually, none of these trigger alerts.
Together, they clearly show a system moving toward risk.
This is exactly what performance trend monitoring is designed to reveal.
How to Implement Performance Trend Monitoring
You don’t need a complex observability stack to do this well.
A practical approach looks like this:
- collect key system metrics (CPU, memory, disk, MySQL)
- store historical data
- aggregate into daily or weekly summaries
- focus on trends instead of raw logs
- review reports regularly
This keeps the system lightweight while still providing meaningful insight.
Why This Approach Works Better
Trend monitoring changes your role from reactive to proactive.
Instead of:
- responding to alerts
- chasing incidents
You:
- understand system behavior
- identify risks early
- plan improvements ahead of time
But this is where it matters — especially for small teams.
You don’t need more tools. You need better visibility.
Summary
Performance trend monitoring gives you a clearer picture of how your infrastructure behaves over time. It helps you detect issues early, reduce alert noise, and make better operational decisions.
If you want a simpler way to understand your system without relying on constant alerts, explore Infrastructure Health Reporting and see how trend-based visibility can improve your infrastructure management.