Most Linux monitoring tools are designed to tell you when something is already wrong. An alert fires, you investigate, and if you are lucky the spike has passed by the time you look. But the real problem is not the spike. It is the pattern that led to it. Understanding how your CPU usage trends over time on Linux is what separates reactive firefighting from genuinely calm operations.
CPU trend monitoring on Linux means tracking how processor utilization changes day over day, week over week. It is not about watching the current percentage. It is about recognizing when average CPU usage on a server has been creeping upward for three weeks before it hits 95% on a Tuesday afternoon and takes down your application. That kind of visibility is surprisingly rare in small infrastructure setups.
If you manage a handful of Linux servers without a dedicated operations team, this guide is for you. We will walk through the practical tools and approaches to capture and review CPU usage history on Linux, so you can actually see trends instead of just reacting to them.
Why CPU Trend Monitoring Matters More Than Real-Time Alerts
Here is the thing. A CPU spike that lasts five minutes and disappears is usually harmless. What you actually need to know is whether your average CPU load has increased by 20% over the past month. That could mean a new background job is misbehaving, a database query pattern has changed, or your server simply needs more capacity. None of those things will trigger a traditional alert.
Real-time monitoring catches emergencies. Trend monitoring helps you prevent them. The distinction matters because most small infrastructure teams are already dealing with alert fatigue, too many notifications and too many false positives. What they rarely have is a clear weekly picture of how their servers are actually performing over time.
Think of it like a slow leak you do not notice until the bucket overflows. CPU usage growing from 30% to 60% over six weeks looks fine in any given moment. Week over week, though, it tells you exactly where things are heading.
Tools for Capturing CPU Usage History on Linux
The good news is Linux ships with tools that make capturing CPU trend data straightforward. You do not need a complex observability stack to get started.
sar (System Activity Reporter) is built into most Linux distributions via the sysstat package. Once installed and enabled, it logs CPU, memory, and IO data at regular intervals automatically. You can view CPU usage history for any day by pointing it at the corresponding log file in /var/log/sysstat. The default retention is typically 7 to 28 days depending on your distribution and sysstat configuration, which is often enough to spot a developing trend.
vmstat is another built-in option. While it does not log automatically, you can run it on a schedule via cron and append to a plain text file. This gives you a record you can grep, sort, or import into a spreadsheet for basic trend visualization. It is not elegant, but for a single server it works reliably.
Prometheus with node_exporter is worth considering if you are managing more than a few servers and want proper time-series data. Node exporter exposes CPU metrics that Prometheus scrapes on a configurable interval. You can then query CPU usage history across all your servers using PromQL. The setup is more involved, but the data quality and retention is much better for cpu growth trend analysis at the server level.
Reading CPU Trends: What to Actually Look For
Raw numbers are only useful if you know what patterns matter. When you start reviewing your cpu usage trends linux data, focus on these signals.
Rising weekly averages. If average CPU across business hours has gone from 25% to 40% over four weeks, that is a trend worth investigating now, not when it hits 80%.
New load patterns at unexpected hours. A server that used to idle overnight and is now spiking at 2am has a new workload. It might be a cron job, a backup task, or something that should not be there at all.
High iowait. When reviewing sar output, separate user and system time from iowait. A rising iowait percentage tells you the CPU is waiting on disk, not actually busy computing. That is a disk or storage trend, not a pure CPU problem, and knowing the difference saves you from buying the wrong fix.
Consistency versus volatility. A CPU averaging 60% but varying wildly between 5% and 95% is a different problem than one sitting steadily at 60%. Consistency matters as much as the average. Tools like sar show min and max alongside averages, which helps here.
So what does this mean in practice? Imagine a small company where the Linux server running order processing starts showing an upward CPU trend every Monday morning. Looking at hourly data from sar, it becomes clear a weekly report job introduced three months ago now takes twice as long as it did initially and it is growing. Caught early, the fix is straightforward. Caught when it starts competing with peak traffic, it is an incident.
Building a Simple Weekly CPU Health Review
The most useful habit you can build for cpu trend monitoring is not setting up more dashboards. It is having a reliable way to review last week data and compare it to the week before. For many small teams, a short weekly review using sar data is enough.
A basic approach is to pull average CPU utilization per day for the past two weeks and review it each Monday morning. Run this check consistently and you will have a simple picture of whether CPU load is trending up, stable, or improving. No dashboard required. No alert thresholds to tune.
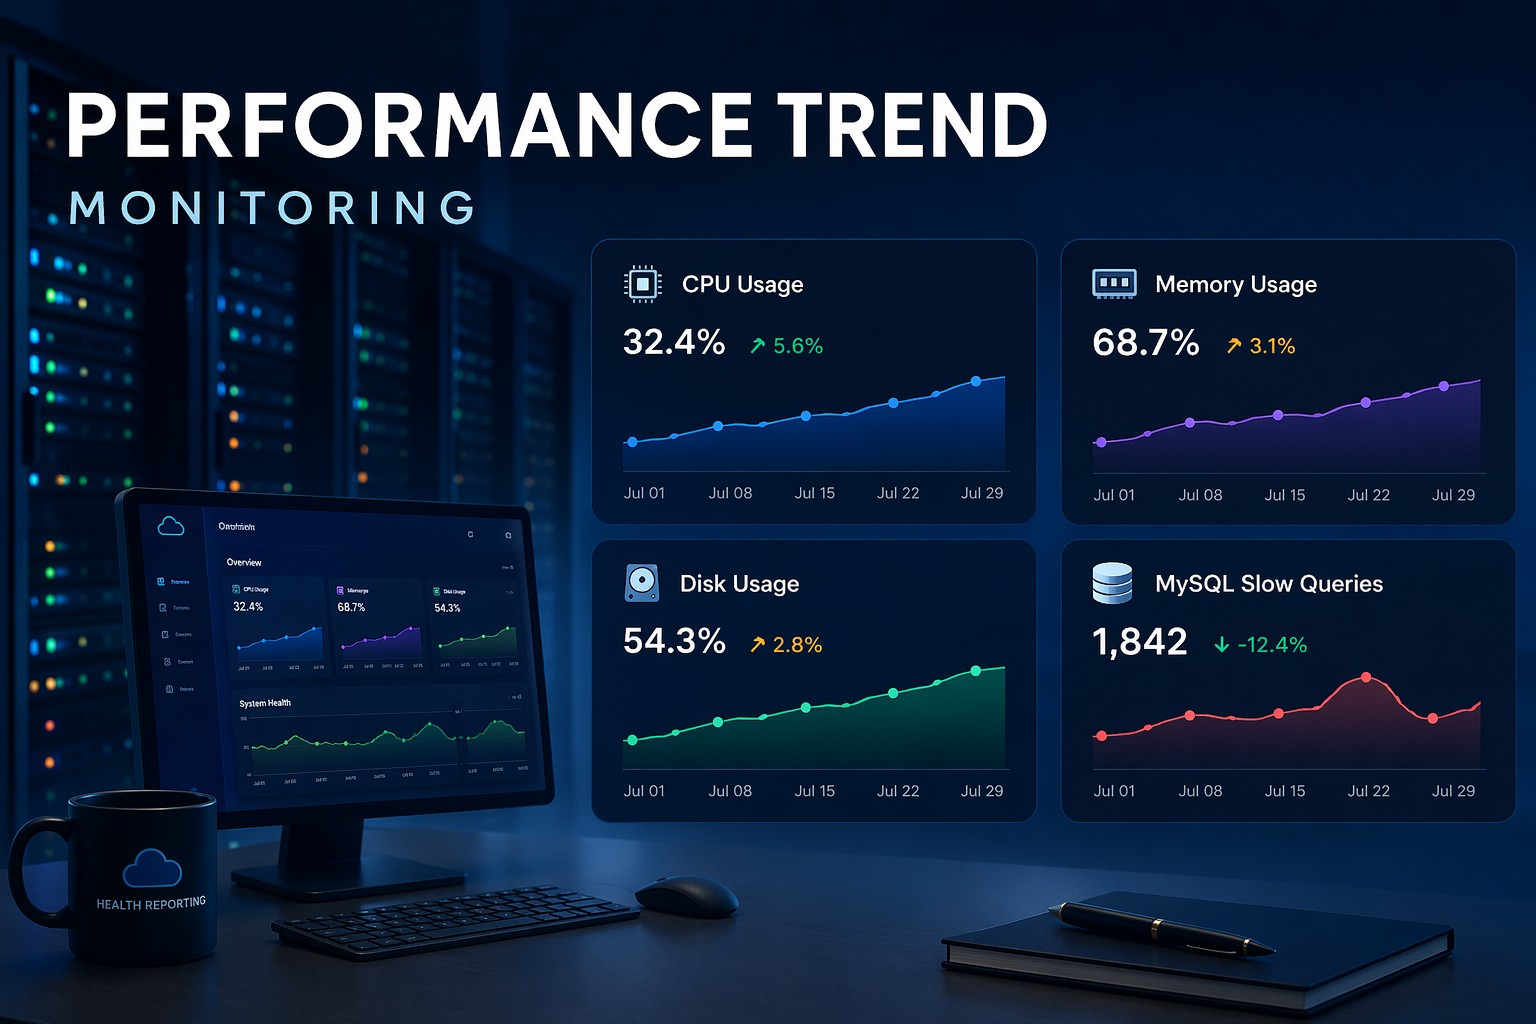
If you want to go further, structuring this data into weekly health reports showing CPU, memory, disk, and database query trends together gives you a much clearer picture of overall server health than any single metric alone. Learn how this approach works in practice with Infrastructure Health Reporting.
Summary
CPU trend monitoring on Linux does not require complex tooling. The built-in sysstat package, a simple cron job, or a lightweight Prometheus setup can all give you the historical CPU data you need to spot problems before they become outages. The key is reviewing trends consistently, not just watching real-time metrics. Rising averages, new overnight load patterns, and increasing iowait are the signals that matter most. Build a habit of weekly review, and you will find yourself spending less time firefighting and more time actually improving your infrastructure.