Introduction: When “Simple” Servers Still Fail
Many small teams assume their infrastructure is too simple to require serious monitoring. A couple of Linux servers, a MySQL database, and some steady traffic — what could go wrong?
The reality is different. Issues rarely appear as sudden failures. They build slowly: CPU usage creeps up, disk fills over weeks, slow queries accumulate quietly. By the time something breaks, it’s already been degrading for days.
This is where small server monitoring becomes critical — not as a complex system, but as a practical way to see problems early.
Why Small Server Monitoring Matters
In small environments, there’s usually no dedicated DevOps team watching dashboards all day. Monitoring needs to work without constant attention.
The goal isn’t alert noise. It’s visibility over time.
- Understand how CPU and memory trends evolve
- Spot disk growth before it becomes critical
- Track MySQL performance degradation
- See patterns across days or weeks
Small infrastructure monitoring should answer one question clearly: is the system getting healthier or worse?
What to Monitor on a Small Production Server
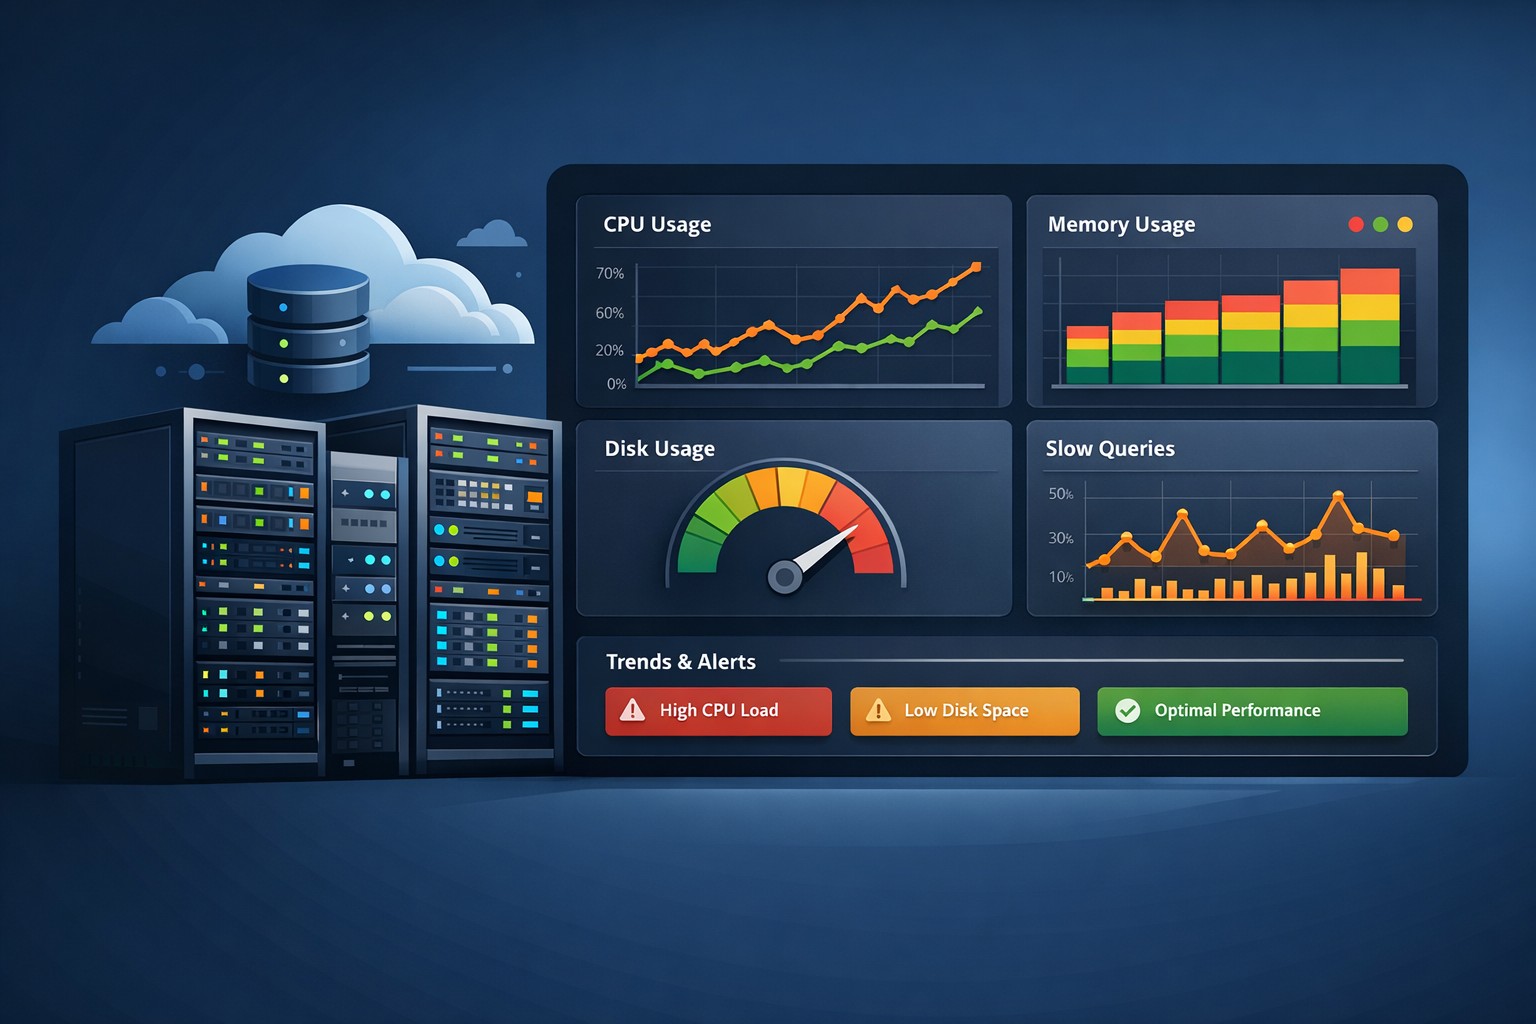
When you monitor a small production server, focus on signals that reflect real operational health:
1. CPU and Load Trends
Short spikes are normal. What matters is sustained growth. If load averages slowly increase week over week, something is changing in your workload or application behavior.
2. Memory Usage Patterns
Memory leaks and caching issues often show as gradual increases. Without trend visibility, they’re easy to miss.
3. Disk Utilization
Disk problems rarely happen overnight. Logs, backups, and temporary files grow steadily until they hit a limit.
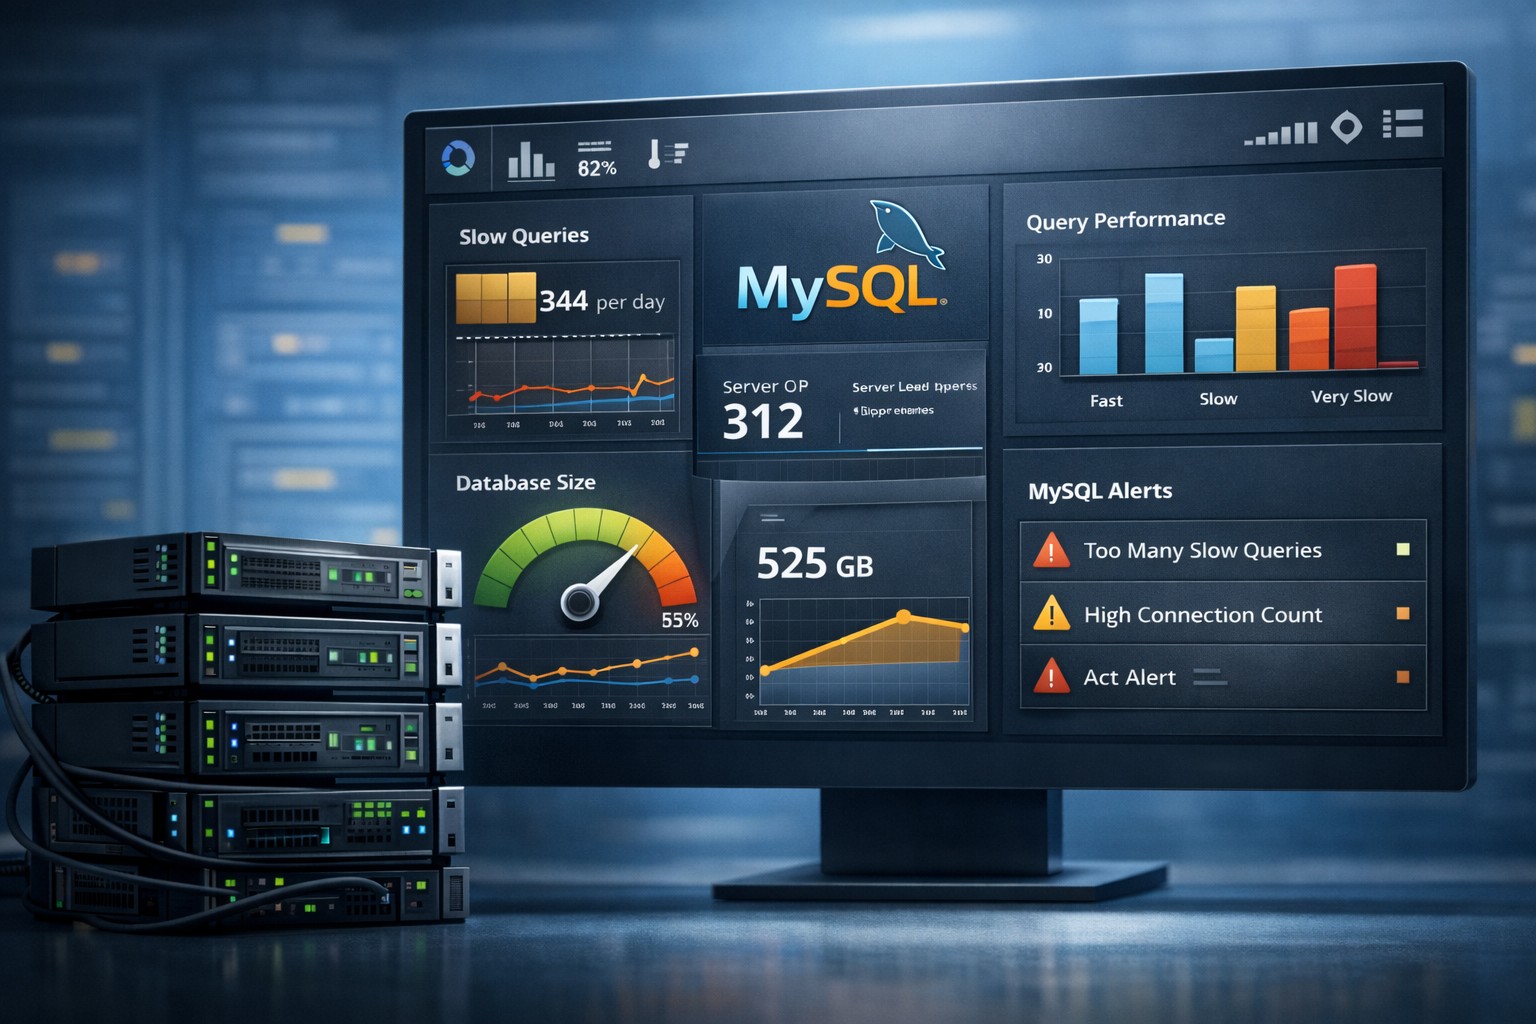
4. MySQL Performance
Slow queries and increasing execution time are early warning signs. Watching trends over time is far more useful than reacting to a single spike.
5. Network Throughput
Unexpected changes in traffic patterns can indicate application changes, abuse, or scaling issues.
Why Traditional Monitoring Fails Small Teams
Many tools are built for large-scale environments. They assume:
- Dedicated engineers to manage alerts
- Complex dashboards that need tuning
- Real-time response workflows
For small teams, this creates friction instead of clarity. Alerts get ignored. Dashboards go unused.
A lightweight monitoring solution works differently. It reduces noise and focuses on long-term visibility instead of constant interruption.
Real-World Example: Slow Growth, Big Impact
Consider a small SaaS application running on a single Linux server with MySQL.
Everything looks fine day-to-day. No outages. No alerts.
But over a month:
- Disk usage grows from 60% to 85%
- Average query time increases by 30%
- CPU load slowly trends upward during peak hours
No single metric crosses a critical threshold, but together they point to a clear trend: the system is under increasing pressure.
Without trend-based monitoring, this pattern is invisible until performance complaints start.
What “Good” Looks Like for Small Server Monitoring
A simple monitoring small business setup should be:
- Lightweight — minimal overhead, easy to deploy
- Trend-focused — weekly or daily reporting instead of constant alerts
- Actionable — highlights changes, not just raw metrics
- Low maintenance — no complex tuning required
This approach is especially useful for teams operating without a dedicated DevOps function.
Monitoring Without a DevOps Team
Many small businesses operate successfully without a full DevOps setup. That doesn’t mean flying blind.
Monitoring without DevOps team support should:
- Summarize system health clearly
- Highlight what changed since last week
- Provide context, not just numbers
This allows IT managers and developers to make informed decisions without deep investigation every day.
Summary
Small server monitoring isn’t about complexity — it’s about clarity. When you can see how your systems evolve over time, you can act before small issues become outages.
A lightweight, trend-based approach gives small teams exactly what they need: visibility without noise, and insight without overhead.
If you want a simple way to start seeing how your infrastructure behaves over time, explore tools designed specifically for this purpose at https://health.dmcloudarchitect.com/.