Simple Monitoring System for Small Infrastructure Teams
Many teams start with good intentions around monitoring, but quickly end up overwhelmed. Alerts become noisy, dashboards multiply, and instead of clarity, you get more confusion. This is especially common in smaller environments where time and resources are limited.
A simple monitoring system focuses on what actually matters: understanding how your infrastructure behaves over time, spotting trends early, and avoiding unnecessary complexity.
Why Simplicity Matters in Monitoring
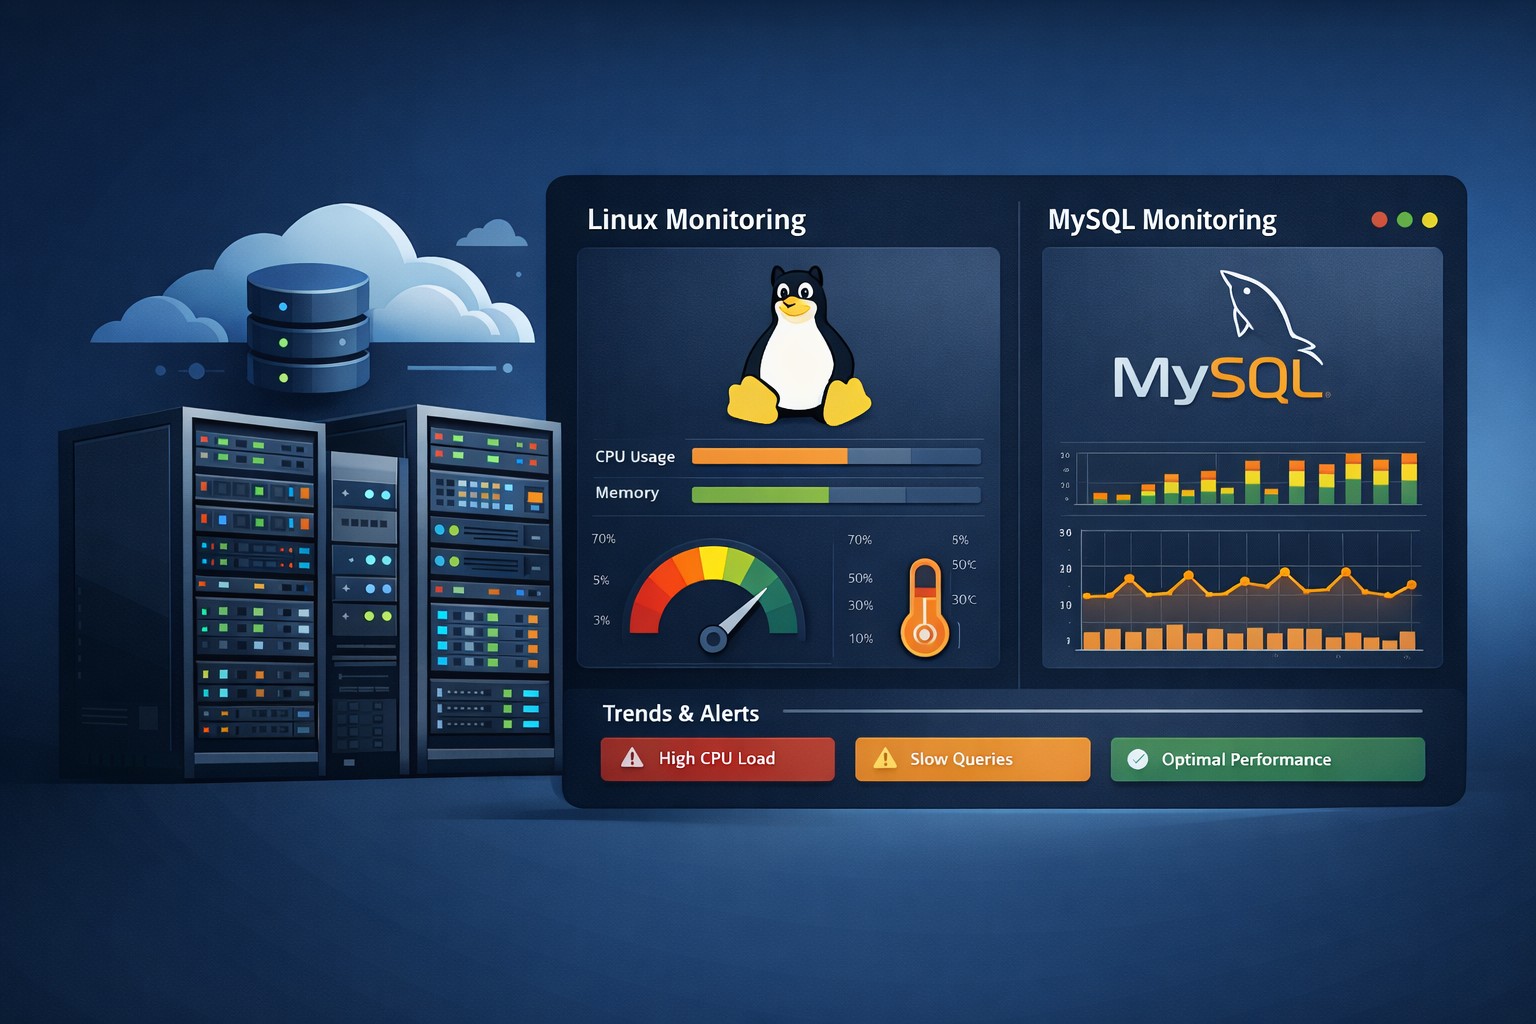
Modern observability stacks can be powerful, but they often come with operational overhead. For small teams managing Linux servers and MySQL databases, maintaining these systems can become a job in itself.
Simple monitoring avoids this by prioritizing:
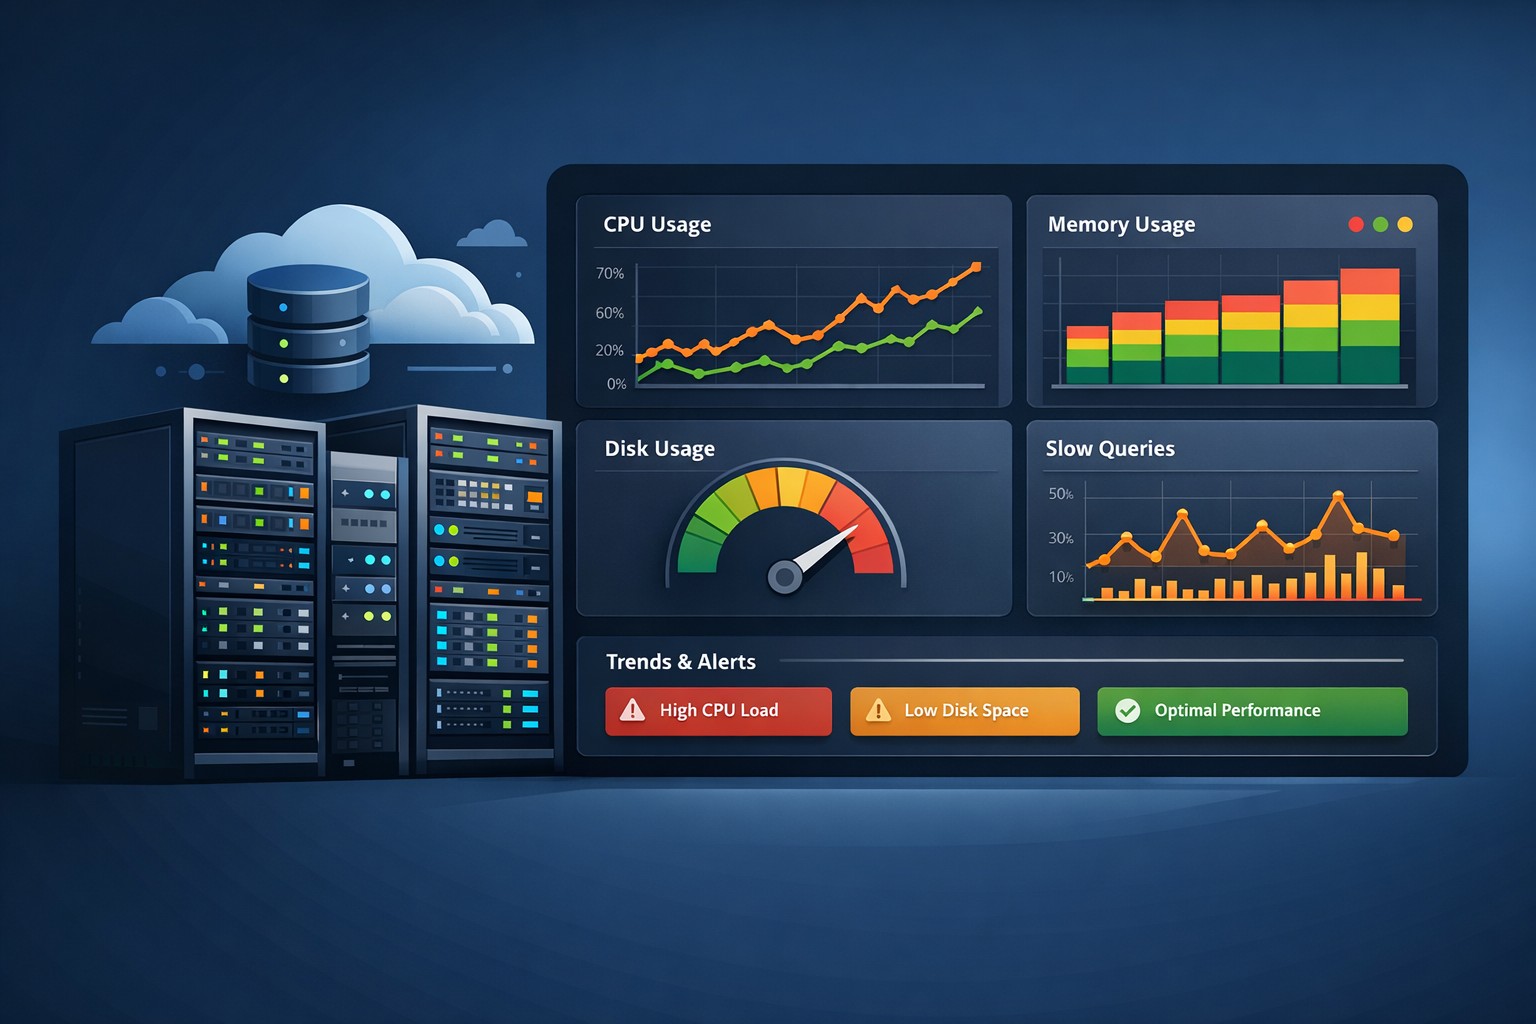
- Clear visibility into CPU, memory, disk, and database behavior
- Trend-based insights instead of constant alert noise
- Low maintenance and predictable setup
This approach aligns better with real-world operations, where the goal is not to collect more data, but to understand what the data is telling you.
What a Practical Monitoring Setup Looks Like
An effective but simple system doesn’t try to track everything. Instead, it focuses on a few critical layers:
1. System Resource Trends
Track CPU usage, memory consumption, and disk growth over time. Weekly patterns often reveal slow issues like memory leaks or storage creep before they become urgent.
2. MySQL Health Indicators
Rather than deep query tracing, focus on practical metrics such as:
- Slow query counts
- Connection trends
- Buffer pool efficiency
These provide a strong signal of database health without requiring complex tooling.
3. Capacity Awareness
Simple monitoring should answer one key question: when will something run out?
Disk growth, CPU saturation, and connection limits are all predictable when viewed over time.
Monitoring Without Complexity
One of the biggest mistakes teams make is equating more tools with better monitoring. In reality, adding layers often introduces:
- More configuration overhead
- More systems to maintain
- More noise to filter
Monitoring without complexity means choosing visibility over volume. Instead of chasing real-time alerts, you build a consistent view of system health that helps you make decisions calmly and early.
Real-World Example
Consider a small infrastructure team running a handful of Linux servers with MySQL.
Without a simple monitoring system, they might only react when something breaks—like a disk filling up or queries slowing down.
With a practical setup in place, they start noticing:
- Disk usage increasing steadily week over week
- A gradual rise in slow queries during peak hours
- Memory usage creeping higher after deployments
None of these trigger urgent alerts, but together they tell a clear story. The team can act early—clean up storage, optimize queries, or adjust capacity—before users are impacted.
Low Maintenance Monitoring That Works
The goal is not to build a perfect system. It’s to build one that you will actually use.
Low maintenance monitoring focuses on:
- Automated data collection
- Simple, readable reports
- Consistent weekly visibility
This keeps the operational burden low while still delivering meaningful insights.
Summary
A simple monitoring system is often more effective than a complex one, especially for small teams. By focusing on trends, practical metrics, and clear visibility, you can understand how your infrastructure evolves and prevent issues before they escalate.
If you want a straightforward way to see how your servers and databases behave over time, you can Sign Up Now and start building a clearer picture of your infrastructure health without unnecessary complexity.