Back to Blog
Disk Usage Trends in Linux Servers: Why They Matter

Disk Usage Trends in Linux Servers: Why They Matter

   Mariusz Antonik    Server Health    3 min read    122 views

Disk Usage Trends in Linux Servers: Why They Matter

Disk space rarely becomes a problem overnight. In most Linux environments, storage issues build gradually—log files grow, databases expand, backups accumulate. Yet many teams only notice disk problems when systems are already close to failure.

This is where understanding disk usage trends in Linux servers becomes critical. Instead of reacting to alerts at 95% capacity, you can see growth patterns early and make informed decisions before outages happen.

Why Disk Usage Trends Matter

Traditional monitoring often focuses on real-time alerts: “disk is full” or “disk is at 90%.” While useful, these alerts come late in the lifecycle of a problem.

Trend-based monitoring answers more important questions:

  • How fast is disk space growing?
  • Which partitions are expanding over time?
  • When will we run out of space if nothing changes?

For small infrastructure teams, this visibility is the difference between proactive maintenance and emergency firefighting.

How to Monitor Disk Growth in Linux

To effectively monitor disk growth in Linux, you need more than a snapshot—you need historical data.

1. Capture Disk Usage Regularly

Use simple tools like df or du on a scheduled basis:

df -h >> /var/log/disk-usage.log

This creates a baseline of disk usage history in Linux, which can later be analyzed for patterns.

2. Store Data Over Time

Instead of overwriting logs, store them daily or hourly. This allows you to build a timeline of disk space usage over time on your server.
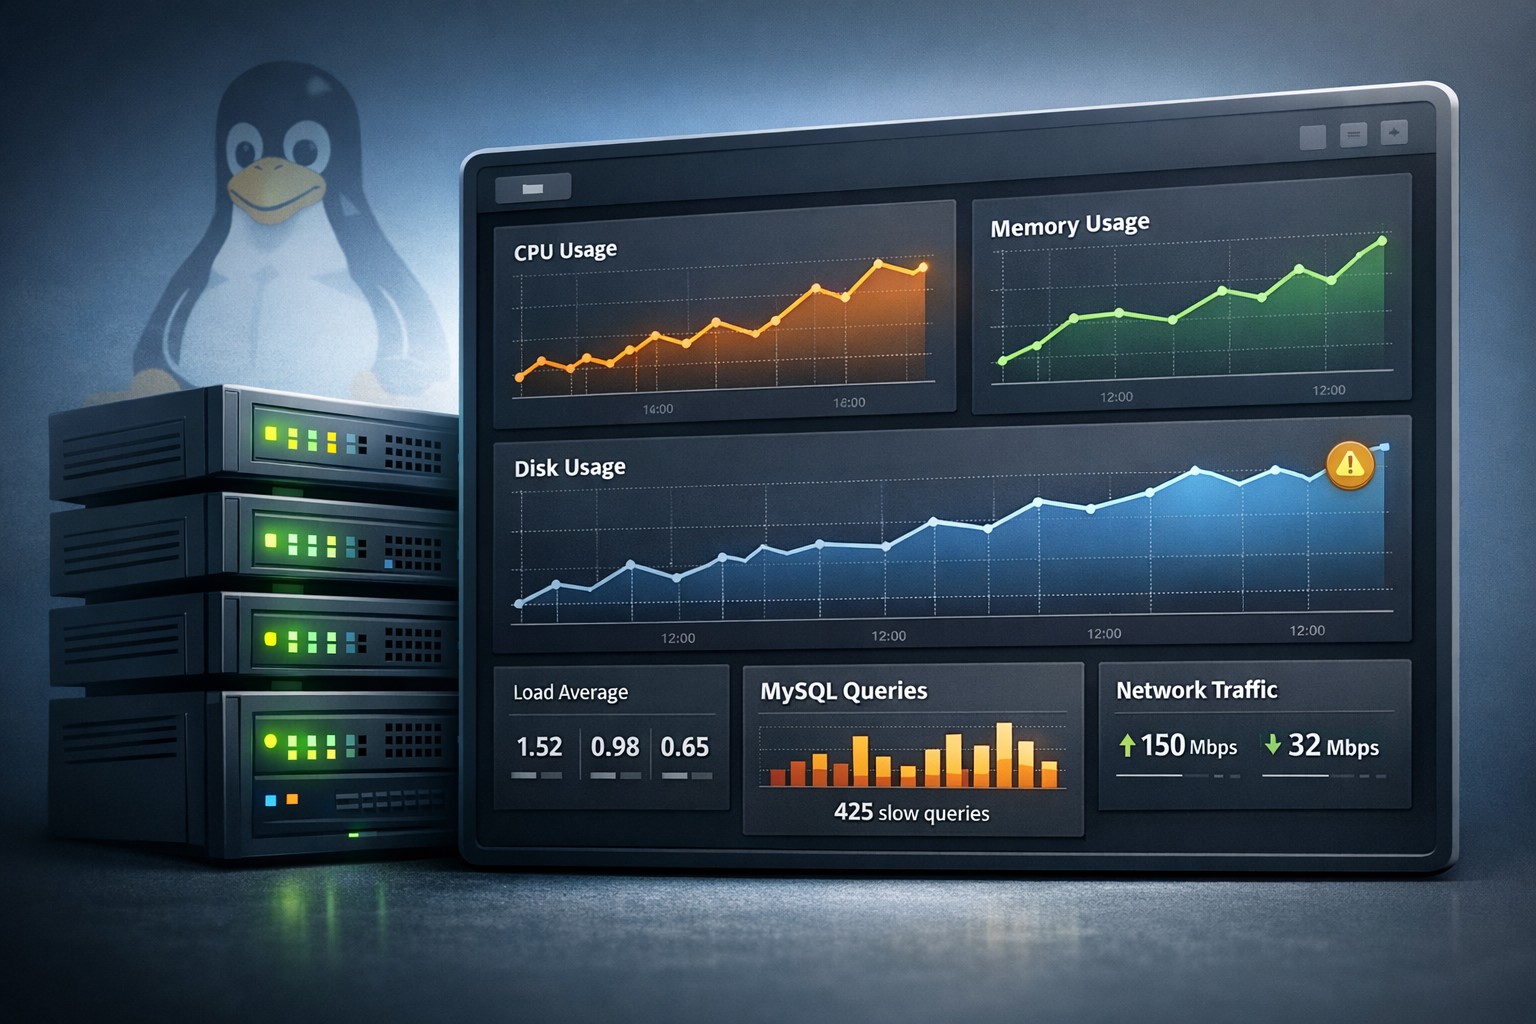
3. Visualize Trends

Raw logs are useful, but visualizing data makes trends obvious. Even simple graphs can reveal:

  • Steady linear growth
  • Sudden spikes due to deployments or backups
  • Unexpected drops after cleanup jobs

What Disk Growth Trends Reveal

Tracking disk growth trends in Linux environments often uncovers hidden operational issues.

Log File Accumulation

Applications that don’t rotate logs properly can quietly consume gigabytes of storage over weeks.

Database Expansion

MySQL databases tend to grow steadily. Without trend tracking, capacity planning becomes guesswork.

Backup Misconfiguration

Duplicate or unpruned backups can cause exponential growth in disk usage.

Temporary File Buildup

Cache directories and temp files often grow unnoticed until they trigger disk pressure.

Real-World Example

Consider a Linux server running a production application. Disk usage appears stable at 60%, so no alerts are triggered.

However, when you track disk usage trends, you notice a steady increase of 2% per week. At that rate, the server will hit critical capacity in about 5 months.

With this insight, the team can:

  • Expand storage in advance
  • Optimize log rotation
  • Review database growth patterns

Without trend data, this issue would only surface when the disk is nearly full.

Moving Beyond Reactive Monitoring

Tracking disk usage history in Linux shifts your approach from reactive to proactive. Instead of asking “what is happening right now,” you start asking “what will happen next?”

This approach is especially valuable for small teams that don’t have time to constantly watch dashboards. Weekly or daily reports highlighting disk growth trends provide actionable insights without adding noise.

Summary

Disk issues are predictable when you have the right visibility. By tracking disk usage trends in Linux servers, you can identify growth patterns early, prevent outages, and plan capacity with confidence.

If you want a simpler way to understand how your infrastructure evolves over time, explore Infrastructure Health Reporting. It helps surface disk growth trends alongside CPU, memory, and database behavior—giving your team practical insights without the complexity of heavy monitoring tools.

About the Author
Mariusz Antonik

Oracle Cloud Infrastructure expert and consultant specializing in database management and automation.

All Tags
#Advanced #alerts #Bash #bash cpu monitoring script #bash monitoring #bash scripting #Beginner #Best Practices #block volume backup #Capacity Planning #cloud backup strategy #cpu bottleneck #CPU Monitoring #cpu monitoring linux #cpu monitoring script linux #cpu trends #cpu usage trends #cpu usage trends linux #create oracle db system in oci #cron cpu monitoring #cron cpu monitoring linux #cron jobs #database monitoring #database performance #detect slow queries mysql #devops #disk capacity planning server #disk forecasting linux #disk growth trend linux #Disk Monitoring #disk usage #disk usage script linux #disk usage trends #Early Detection #easy infrastructure monitoring #free-tier #Guide #health dashboards #Health Reporting #historical server monitoring #how to monitor cpu usage linux #infrastructure #infrastructure health #infrastructure health dashboard #infrastructure health reporting #infrastructure monitoring #infrastructure monitoring report #infrastructure trends #infrastructure trends monitoring #Infrastructure Visibility #lightweight linux monitoring #lightweight monitoring #linux #linux administration #linux cpu monitoring #linux cpu usage #linux disk capacity planning #linux disk usage #Linux monitoring #linux monitoring setup #linux monitoring tools #linux performance #linux performance monitoring #linux server #linux server monitoring #linux servers #linux storage #linux tools #low maintenance monitoring #monitor cpu usage over time linux #monitor linux server health #monitor server trends #monitor small production server #monitoring without complexity #MySQL #mysql health reporting #MySQL monitoring #mysql optimization #MySQL Performance #mysql performance degradation #mysql performance monitoring #mysql performance trends #mysql query performance issues #mysql server monitoring #mysql slow queries #mysql slow query analysis #mysql slow query monitoring #mysql trends #mysql-health #networking #nsg #OCI #oci backup #oci bastion tutorial #oci block volume #oci infrastructure as code #OCI monitoring #oci networking #oci oracle database private subnet setup #oci oracle database tutorial #oci security #oci setup guide #oci terraform tutorial #oci tutorial for beginners #oci vcn terraform #oci virtual machine db system guide #oracle base database service tutorial #oracle cloud bastion #oracle cloud free tier tutorial #oracle cloud infrastructure step by step #oracle cloud infrastructure tutorial #oracle cloud storage #oracle database on oci setup #oracle-cloud #Performance #Performance Degradation #performance monitoring #performance trend monitoring #performance trends #plan disk growth server #practical server monitoring #predict disk usage growth #private instance access #query optimization #Security #security lists #server health #server health reporting #server health weekly report #server monitoring #Server Performance #server trend analysis #server-trends #simple cpu monitoring linux #simple linux monitoring #simple monitoring small business #simple monitoring system #simple ops monitoring #slow queries #slow query reporting mysql #small business infrastructure #small business IT #small business servers #small infrastructure monitoring #small server monitoring #ssh bastion #storage capacity planning linux #storage monitoring #subnets #System Health #system health reporting #terraform oci compute #terraform oracle cloud infrastructure #Trend Monitoring #trend-analysis #trends #Tutorial #vcn