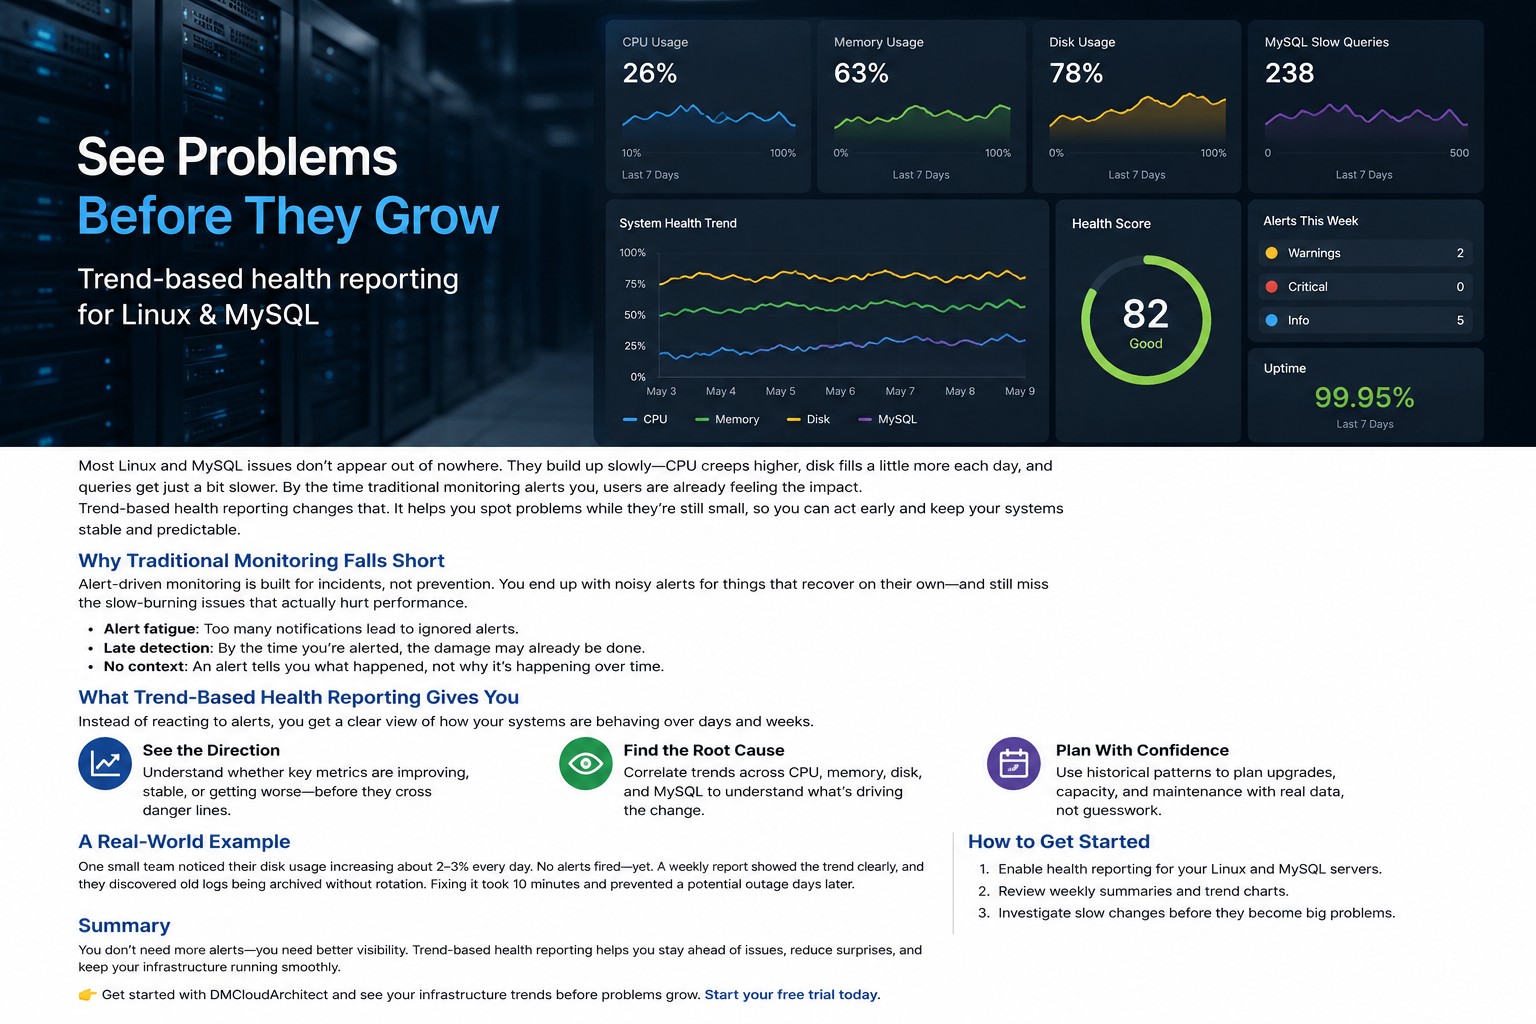
Most server monitoring tools can tell you what is happening right now. The challenge is understanding what has been happening over days, weeks, or months. A trend based monitoring server helps infrastructure teams move beyond real-time alerts and identify patterns that reveal performance degradation, capacity issues, and long-term operational risks.
Instead of reacting to isolated events, teams can use historical data to understand how systems behave over time. This approach improves planning, troubleshooting, and infrastructure reliability.
What Is a Trend Based Monitoring Server?
A trend based monitoring server collects, stores, and analyzes performance metrics over extended periods. Rather than focusing only on current utilization, it builds a historical record that allows administrators to compare performance across different time ranges.
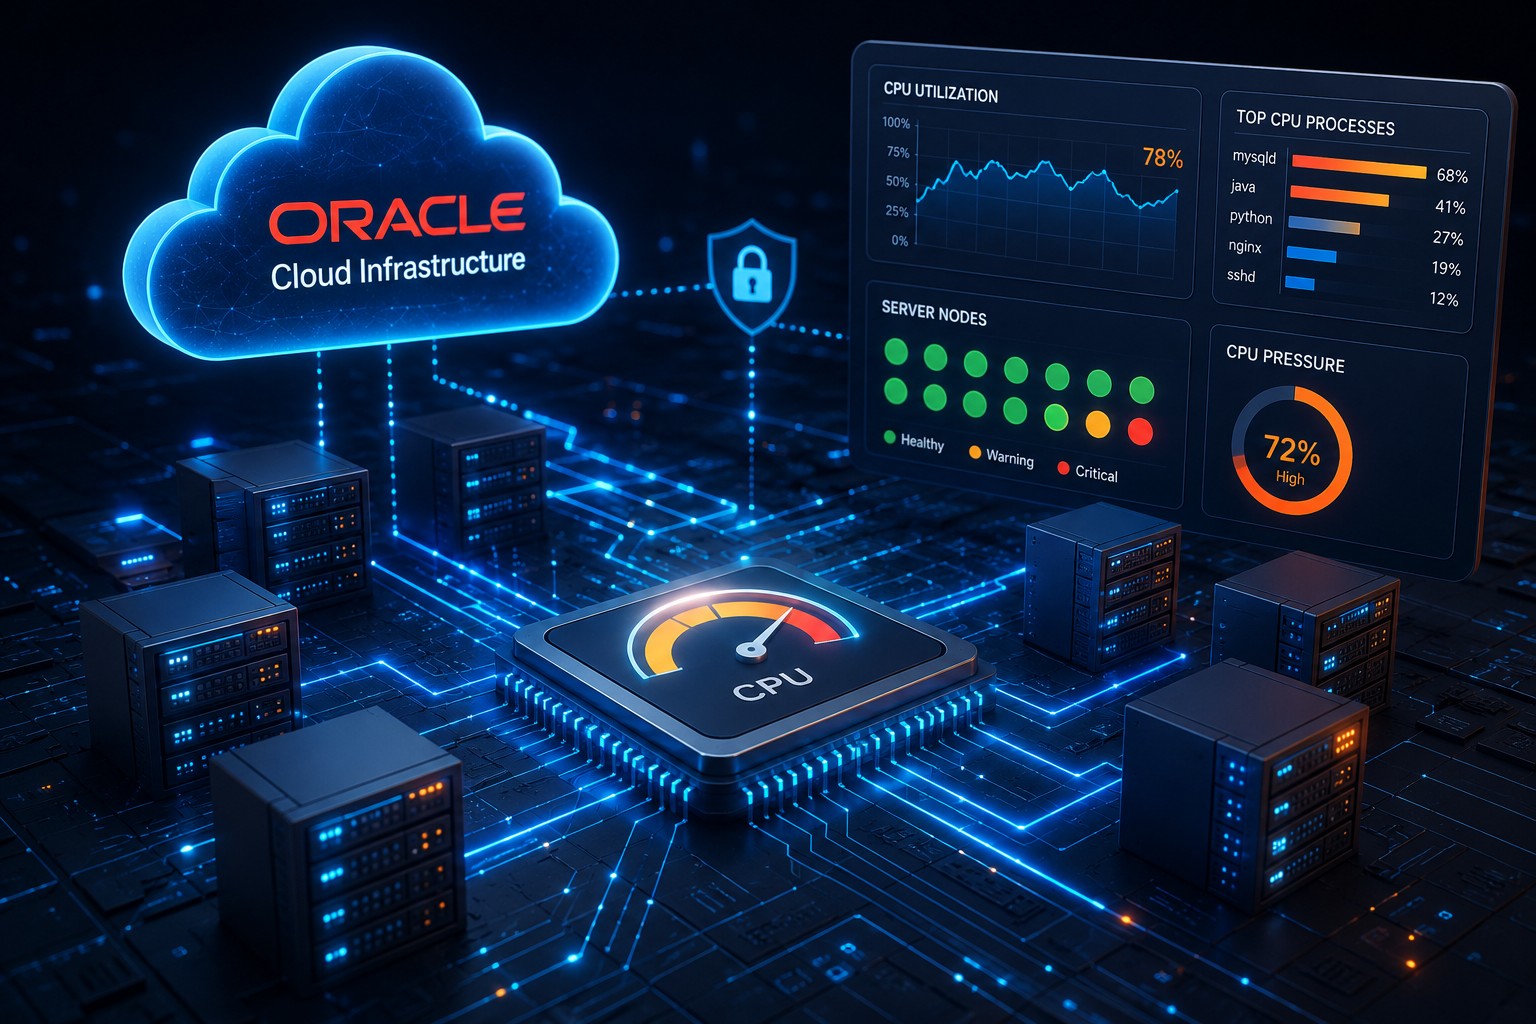
Common metrics include CPU utilization, memory consumption, disk activity, network throughput, application response times, and database performance indicators.
Why Infrastructure Trends Monitoring Is Important
Short-term monitoring helps identify immediate failures. Long-term trend analysis provides context that is often missing during troubleshooting.
- Detect gradual performance degradation.
- Identify seasonal workload patterns.
- Forecast infrastructure capacity requirements.
- Reduce unexpected outages.
- Support budgeting and growth planning.
When organizations monitor server trends over time, they gain a clearer understanding of how workloads evolve and where future bottlenecks may appear.
Key Components of Server Trend Analysis
Metric Collection
Data must be gathered consistently from servers, applications, databases, and network devices. Reliable collection intervals ensure accurate historical comparisons.
Historical Data Retention
Trend analysis requires long-term storage. Retaining metrics for several months allows teams to identify recurring patterns and compare current performance against previous periods.
Visualization and Reporting
Charts, graphs, and dashboards make performance trend monitoring easier to interpret. Visual representations help administrators quickly identify unusual changes.
Real-World Example
Consider a Linux application server supporting a business platform. Real-time monitoring shows CPU utilization averaging 40%, which appears healthy. However, server trend analysis reveals CPU usage has increased steadily by 5% each month for six months.
Without historical monitoring, the issue may remain unnoticed until performance problems occur. With trend-based monitoring, administrators can plan hardware upgrades, optimize workloads, or scale infrastructure before users are affected.
Best Practices for Historical Server Monitoring
- Collect metrics at consistent intervals.
- Retain sufficient historical data for comparison.
- Establish performance baselines.
- Review reports regularly instead of only during incidents.
- Correlate server metrics with application and database performance.
These practices improve visibility and help teams make proactive operational decisions.
Using Trends for Capacity Planning
Capacity planning becomes significantly more accurate when based on historical data. Infrastructure trends monitoring allows organizations to predict when resources will reach critical thresholds and budget for upgrades before performance suffers.
This is particularly valuable in cloud environments where resource allocation directly impacts costs and service quality.
Conclusion
A trend based monitoring server provides much more than real-time visibility. By analyzing historical server monitoring data, infrastructure teams can identify patterns, predict future needs, and improve overall system reliability. To learn more about building effective monitoring strategies and understanding long-term infrastructure performance, explore Infrastructure Health Reporting at https://dmcloudarchitect.com/infrastructure-health-reporting.html.