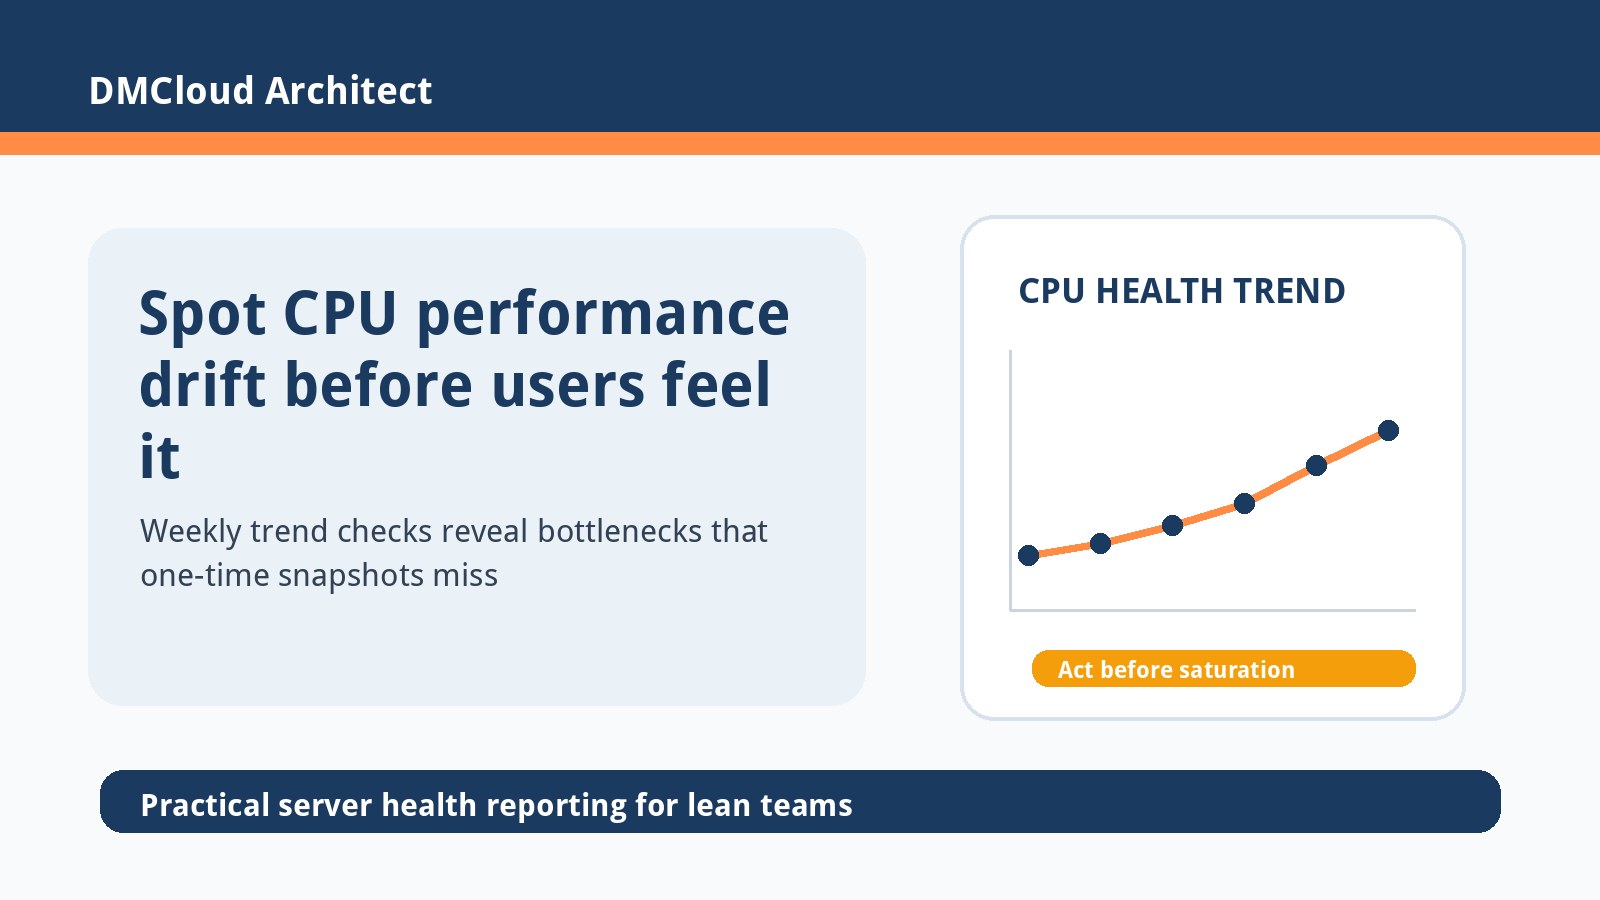
CPU problems rarely begin as a dramatic crash. More often, a server that felt comfortable last month starts taking longer to respond, nightly jobs run past their normal window, or MySQL queries that used to finish quickly begin stacking up. The danger for lean teams is that this kind of drift can be easy to miss when nobody is watching the trend.
To detect performance degradation cpu, look for patterns instead of single moments. A one-minute spike may be harmless, but a rising weekly load average, more time spent waiting on the same application workers, or recurring CPU steal on a small cloud instance can point to a capacity issue that is becoming normal. The earlier you spot that baseline shift, the easier it is to fix without emergency resizing.
Start with a normal baseline
You cannot identify a CPU bottleneck confidently until you know what normal looks like for the server. Capture basic readings during quiet periods, business-hour traffic, scheduled jobs, backups, and known reporting windows. This gives you a reference point when someone later says the site or internal app “just feels slower.”
For a small Linux server, a useful baseline includes load average, CPU utilization by mode, process-level CPU consumers, run queue pressure, and any recurring high-usage windows. The exact tool matters less than collecting the same signals consistently enough to compare week over week.
Watch load average in context
Load average is helpful, but it should never be read alone. Compare the one-, five-, and fifteen-minute values against the number of available CPU cores, then ask whether the pattern is brief, sustained, or becoming more frequent. A short burst during a backup or deployment may be expected; a fifteen-minute load that keeps creeping upward during normal traffic deserves attention.
Context also matters when the server runs MySQL, queue workers, cron jobs, and a web application together. If a weekly health check shows that routine jobs are now overlapping with the busiest customer period, the fix may be scheduling or worker tuning rather than immediately buying a larger instance.
Separate real CPU work from waiting
High load does not always mean the CPU is doing useful work. A server can look busy because processes are waiting on disk, network storage, locks, or database responses. Before treating every slowdown as a CPU shortage, check CPU user time, system time, I/O wait, and steal time.
- User time: application or database code is using CPU cycles directly.
- System time: the kernel is doing more work, sometimes because of networking, storage, or process churn.
- I/O wait: processes may be blocked on disk or storage rather than short on compute.
- Steal time: a virtual machine may be waiting because the underlying host is busy.
This distinction keeps troubleshooting practical. If CPU steal is repeatedly high on a small VPS, moving instance class or provider tier may help. If I/O wait is the culprit, resizing CPU alone could waste money while the real problem continues.
Find the repeat offenders
When a server slows down, teams often check the top process at that exact moment and stop there. A better habit is to compare recurring offenders over time. If the same backup compressor, report generator, image processor, web worker, or database query pattern appears in every weekly review, it is no longer a random spike; it is an operational trend.
For developers, this can lead to focused work: optimize a query, cap worker concurrency, move a batch job, adjust cache behavior, or split background processing away from the web tier. For business owners, it turns “the server is slow” into a concrete action item with an owner.
Include database signals
Many CPU performance issues on small business servers are really application and database issues showing up as compute pressure. A MySQL server with inefficient queries, missing indexes, too many connections, or heavy reports can consume CPU long before the web server itself looks unusual.
Basic MySQL checks can reveal whether CPU performance decline is tied to slow queries, table scans, connection spikes, or a new reporting workload. Even without a full observability stack, reviewing slow-query symptoms and database growth alongside operating-system metrics gives a more complete picture.
Use trend checks before alert fatigue sets in
Real-time alerts are valuable for urgent failures, but they are not always the best first step for small teams. If every small spike triggers a notification, people learn to ignore the noise. A weekly infrastructure health report can be calmer: it highlights what changed, what is trending the wrong way, and which items need action before customers notice.
This approach is especially useful when a server has a predictable business rhythm. You can compare similar days, review whether peaks are increasing, and decide whether the right next move is code tuning, schedule changes, instance resizing, or deeper monitoring.
A practical CPU degradation checklist
Use a short checklist when reviewing Linux server health. The goal is not to collect every metric; it is to answer whether CPU pressure is becoming a business risk.
- Compare current one-, five-, and fifteen-minute load averages with prior weekly checks.
- Review user, system, I/O wait, and steal time so CPU pressure is not misdiagnosed.
- List the top recurring CPU consumers and note whether they match expected jobs.
- Check whether cron jobs, backups, imports, or reports are overlapping with peak traffic.
- Look for MySQL slow-query symptoms, connection spikes, and new reporting workloads.
- Record one recommended action, owner, and urgency level when a trend is moving the wrong way.
Know when simple monitoring is enough
If you run many hosts, need incident correlation, or support strict uptime targets, a central monitoring platform may be the right choice. But for many developers and small business owners, the first win is simply noticing CPU saturation warning signs early and turning them into clear maintenance tasks.
A consistent review can reveal capacity drift before it becomes a customer-facing problem. That gives your team time to tune the application, clean up schedules, adjust database workload, or resize infrastructure on your own terms.
Want help spotting infrastructure drift before it becomes urgent?
DMCloud Architect provides weekly Linux and MySQL infrastructure health reports that summarize CPU trends, capacity risks, service issues, backups, certificates, and practical next steps for small teams.
Get the free starter plan for weekly infrastructure health reports.