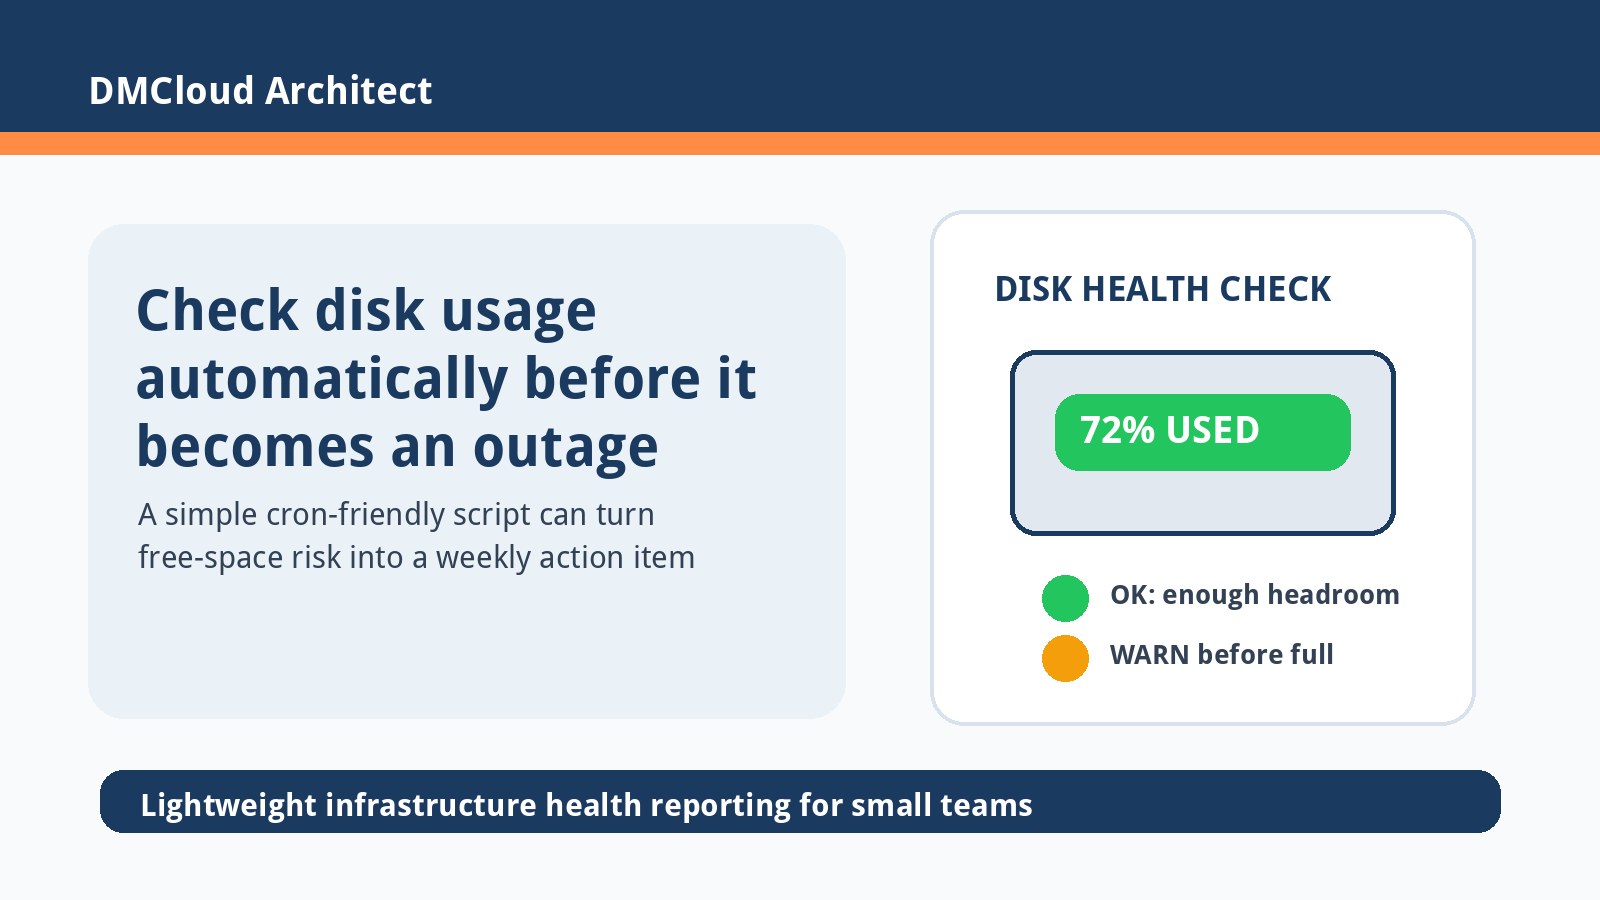
Running out of disk space is one of those infrastructure problems that feels minor right up until it interrupts the business. A full filesystem can break uploads, prevent logs from rotating, stop backups, cause package updates to fail, or leave a database without room for temporary files. For small teams, the best fix is not a giant monitoring rollout first; it is a reliable habit for checking the few disks that matter.
A practical check disk usage linux script should be simple enough to understand, safe enough to run from cron, and specific enough to avoid noisy alerts. The goal is to catch capacity drift while there is still time to clean old files, resize a volume, tune retention, or move heavy data before it becomes an outage.
Start by choosing the mount points that matter
The first mistake in disk monitoring is treating every mounted filesystem the same. Temporary container mounts, read-only system paths, and snap or package manager mounts can create noise. Watch the places that can actually hurt the application if they fill up.
For many small Linux servers, the most important paths are /, /var, /var/lib/mysql, /home, and any application upload or backup directory under /opt or /srv. If MySQL stores data on a dedicated volume, check that separately instead of assuming the root filesystem tells the whole story.
Use thresholds that leave time to act
An alert at 99% used is usually a notification that the emergency has already arrived. A better default is to warn around 80% and treat 90% as urgent, then adjust based on how quickly each volume grows. A log-heavy web server may need earlier warnings than a quiet utility host.
Thresholds should also reflect business rhythm. If backups, imports, reports, or month-end jobs temporarily use extra disk, review the high-water mark after those jobs run. Disk monitoring is most useful when it tells you whether normal operations are leaving less headroom over time.
A simple cron-friendly Bash script
The script below uses df -hP so the output is predictable, filters to important mount points, and exits with a non-zero status when something needs attention. That makes it easy to run from cron, a maintenance wrapper, or a larger health-reporting process.
#!/usr/bin/env bash
set -euo pipefail
THRESHOLD=80
HOST=$(hostname -f 2>/dev/null || hostname)
WARNINGS=0

while read -r filesystem size used avail pct mount; do
  usage=${pct%%%}
  case "$mount" in
    /|/var|/var/lib/mysql|/home|/opt)
      if [ "$usage" -ge "$THRESHOLD" ]; then
        echo "WARN $HOST $mount is ${usage}% used (${avail} free)"
        WARNINGS=$((WARNINGS + 1))
      fi
      ;;
  esac
done < <(df -hP | awk 'NR > 1 {print $1, $2, $3, $4, $5, $6}')

if [ "$WARNINGS" -gt 0 ]; then
  exit 1
fi

echo "OK $HOST disk usage is below ${THRESHOLD}% on watched mounts"
Save it as something like /usr/local/sbin/check-disk-usage.sh, make it executable with chmod +x, and run it manually first. If it reports a warning, confirm whether the mount is actually business-critical before wiring it into automated notifications.
Run the check from cron
For lightweight monitoring, cron is often enough. A daily check gives a small team visibility without adding another platform to maintain. For example, this runs the script every morning and appends output to a local log:
15 7 * * * /usr/local/sbin/check-disk-usage.sh >> /var/log/disk-health.log 2>&1If your environment sends cron mail, a non-zero exit can also create a simple warning. If it does not, have the script write to a monitored log, send a webhook, or feed the result into a weekly infrastructure health report.
Look beyond percentage used
Percentage is a useful starting point, but it is not the only disk risk. A filesystem can have plenty of bytes available and still run into inode exhaustion when there are too many small files. Add an occasional df -i review for upload directories, cache directories, mail spools, and application folders that create many small files.
Growth rate matters too. A server that moved from 45% to 55% over six months is very different from one that moved from 45% to 70% in a week. When reviewing disk health, record both the current value and whether the trend is accelerating.
Common causes of surprise disk growth
When a disk warning appears, the next step is to identify what changed. Developers and business owners do not need a perfect forensic process; they need a short list of likely causes and a safe way to clean up.
- Logs: application, web server, and database logs may grow quickly if rotation is missing or errors spike.
- Backups: local backups can silently accumulate when retention rules are not enforced.
- Uploads and exports: customer files, generated reports, and CSV exports may never be pruned.
- Package caches: update tools can leave cached packages behind on long-running servers.
- Database files: MySQL data, binary logs, temporary tables, or slow query logs can consume space faster than expected.
Turn warnings into maintenance actions
A disk usage script is most valuable when it leads to a clear next step. Each warning should answer three questions: which mount is at risk, what changed since the last review, and what action should happen next. That action might be pruning old backups, increasing log rotation, moving uploads to object storage, resizing a volume, or investigating database growth.
For small business infrastructure, this translation matters. A vague “disk is high” alert creates anxiety; a weekly note that says “/var/lib/mysql grew 12 GB after reporting imports; review retention before Friday” creates an actionable task.
When to move past a script
A Bash script is a good starting point, not the final answer for every environment. If you manage many servers, need historical dashboards, or want service-level alert routing, a full monitoring tool may be worth it. But even then, the discipline is the same: monitor the right mount points, alert before the emergency, and review trends regularly.
The lightweight approach works well for lean teams because it lowers the barrier to action. You can start with one server, one script, and one weekly review, then expand only when the operational value is clear.
Want disk, Linux, and MySQL risks summarized before they become urgent?
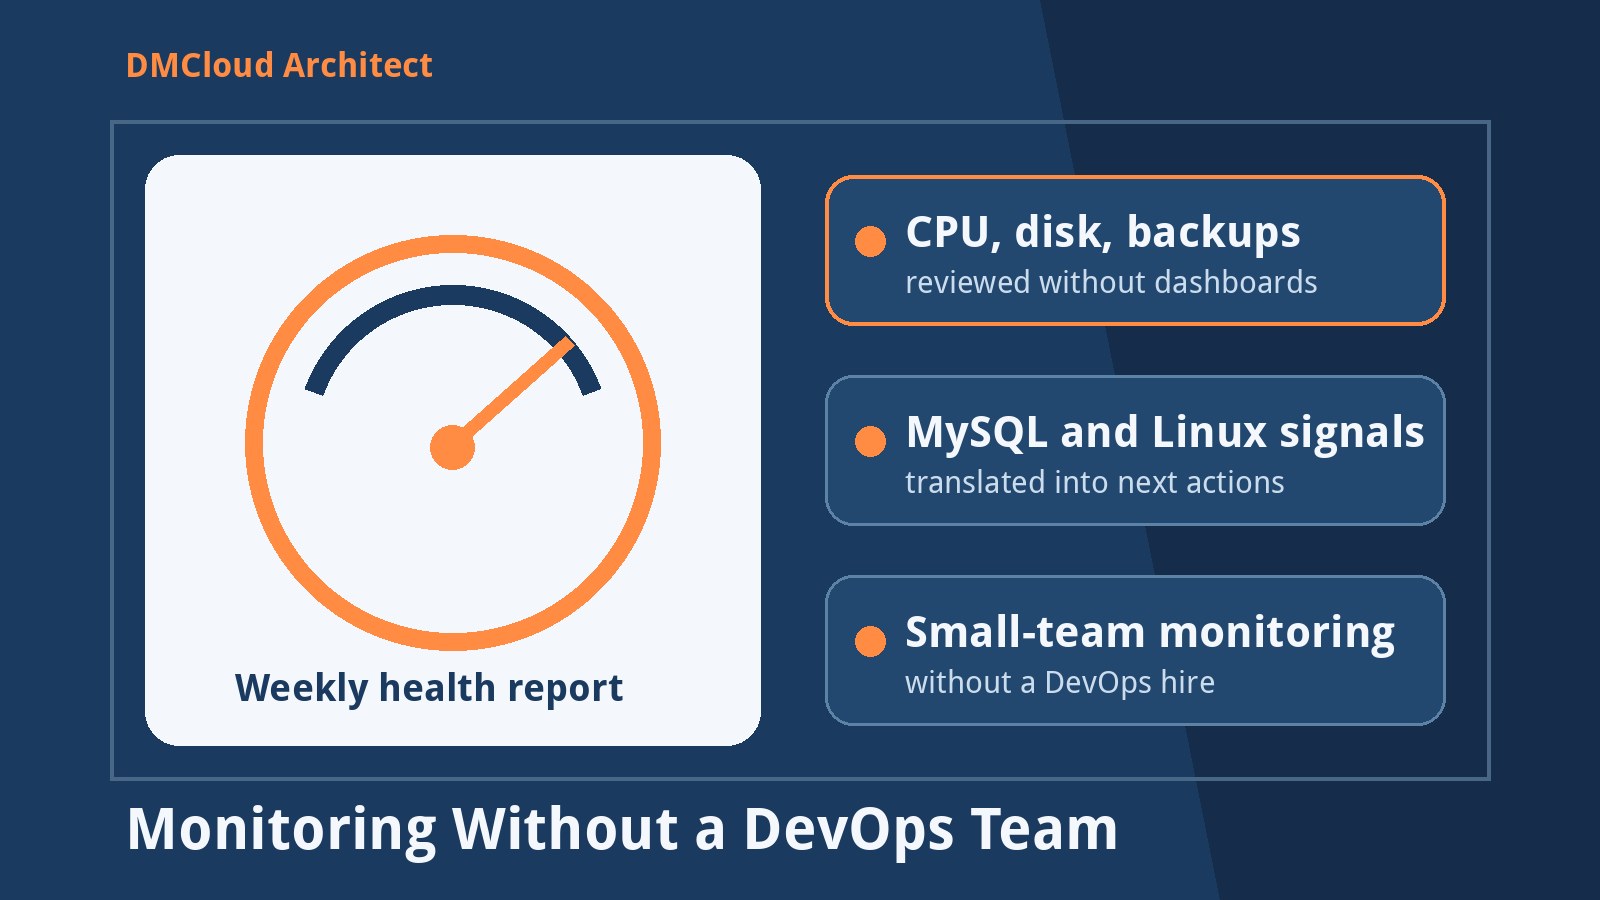
DMCloud Architect provides weekly infrastructure health reports that review disk usage, server load, MySQL signals, backups, certificates, and practical maintenance actions for small teams.
Get the free starter plan for weekly infrastructure health reports.