When a production Linux server is suddenly slow, experienced operators do not start by memorizing a magic command. They start by protecting the user experience, checking the scope of the problem, and building a timeline from real signals. That same thinking is useful for developers and small business owners who need practical linux server monitoring without turning every alert into a dashboard marathon.
This checklist turns a classic production troubleshooting scenario into an operations playbook. Use it when a website feels sluggish, an application times out, a database starts lagging, or a customer reports that “everything is slow.” The goal is not to prove how many tools you know; the goal is to narrow the cause safely, communicate clearly, and leave better monitoring behind for next time.
1. Confirm the symptom and blast radius first
Before logging into the server, define what “slow” means. Is one endpoint slow, the whole site slow, SSH slow, database queries slow, uploads slow, or every service on the host slow? Check whether the issue affects all users, one geography, one customer, one deployment, or one backend dependency.
This matters because a server-level investigation may be the wrong first step. A CDN issue, DNS problem, third-party API delay, load balancer health check, regional network problem, or database lock can all feel like a “slow server” to users. Good triage starts with scope.
2. Stabilize the service while preserving evidence
If customers are affected, think about safe mitigation in parallel with investigation. You may need to disable an expensive job, shift traffic, roll back a recent release, restart a clearly wedged worker, increase a queue worker count, or enable a maintenance message. But avoid destroying evidence before you capture the basics.
Record the time, host, affected service, recent deployment or maintenance activity, current load, disk pressure, memory pressure, key errors, and any customer-visible impact. A quick snapshot gives you a reference point after mitigation and helps prevent the same incident from becoming a mystery again next month.
3. Check the four core resource signals
Most slow-server investigations should quickly look at CPU, memory, disk I/O, and network behavior. You are not looking for one perfect number. You are looking for pressure, saturation, errors, and change from normal.
- CPU: sustained high utilization, runaway processes, high load average compared with CPU count, excessive context switching, or steal time on virtual machines.
- Memory: swap activity, out-of-memory kills, rapidly growing processes, cache behavior, and whether the application is leaking or simply busier than usual.
- Disk: full filesystems, slow I/O waits, saturated volumes, inode exhaustion, noisy logs, backup jobs, database flushes, or snapshot activity.
- Network: packet loss, connection floods, slow upstream dependencies, DNS delays, load balancer errors, or unusual inbound/outbound traffic.
4. Compare current behavior with a known baseline
A number is much more useful when you know what normal looks like. A load average of 4 may be fine on one server and alarming on another. A database with 80 active connections may be normal during business hours and strange at midnight. This is where weekly linux server monitoring helps small teams make better decisions.
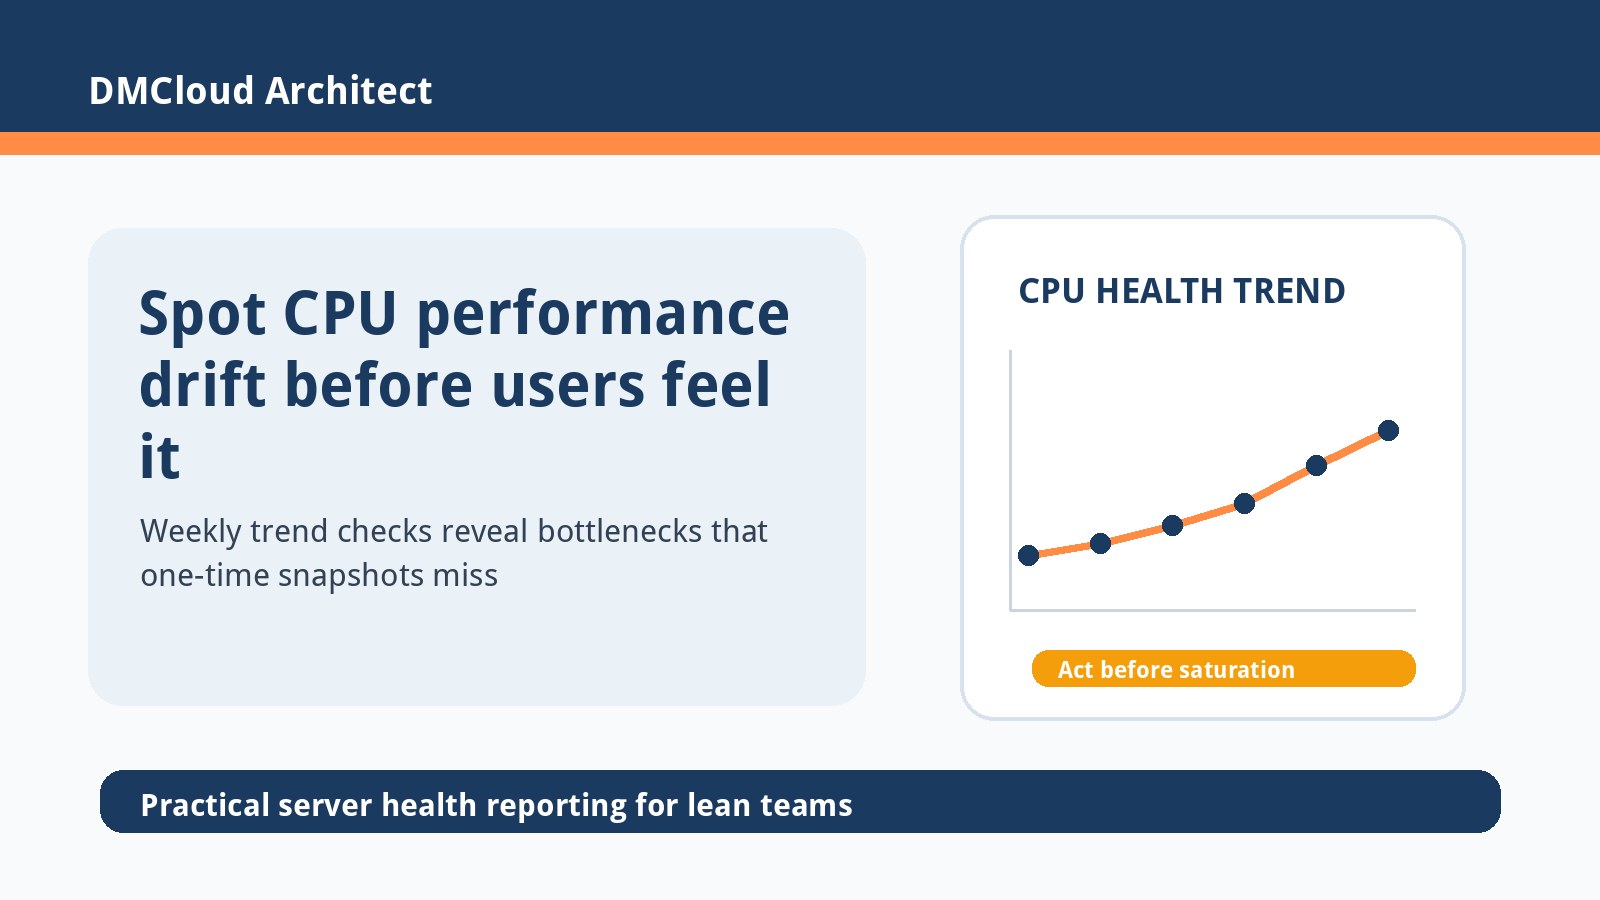
Compare today’s CPU, memory, disk, MySQL, service restart, and error trends with the last few days or weeks. If the server has been slowly creeping toward capacity, the incident may be growth rather than a sudden bug. If the change began right after a release, package update, backup schedule change, or traffic spike, your investigation has a useful direction.
5. Build a timeline from logs and changes
Production experience shows up in the timeline. Check application logs, web server logs, system logs, authentication logs, deployment records, cron jobs, systemd timers, package updates, database slow query logs, and cloud provider events around the first reported slowdown. Look for the earliest abnormal signal, not just the loudest one.
For example, the web server may show 504 errors, but the earliest cause could be a stuck database migration, a full disk, a disabled cache, a DNS resolver issue, or a backup process consuming I/O. The timeline keeps you from fixing symptoms while missing the root cause.
6. Separate host pressure from application pressure
If the host is healthy but the service is slow, move up the stack. Review application response times, dependency latency, database query plans, cache hit rates, queue depth, worker saturation, thread pools, external APIs, and error rates by endpoint. A Linux server can have plenty of CPU and memory while one application route waits on a slow query or remote service.
If the host is under pressure, identify which process or workload is responsible before restarting everything. Map resource usage back to services, containers, users, scheduled jobs, or database activity. The right fix depends on ownership: tune a query, rotate logs, resize storage, pause a backup, rollback a release, block abusive traffic, or add capacity.
7. Communicate what you know, what you do not know, and the next check
During a real incident, communication is part of the technical work. Give stakeholders a short status: impact, current hypothesis, mitigation in progress, next update time, and known risks. Avoid confident guesses that you cannot support with evidence.
A useful update might be: “Checkout requests are timing out for some users. CPU is normal, but database disk I/O is saturated and slow queries started after the 01:10 deployment. We are reviewing the migration and temporarily reducing background jobs. Next update in 15 minutes.” That level of clarity builds trust even before the incident is fully resolved.
8. Turn the incident into a better monitoring checklist
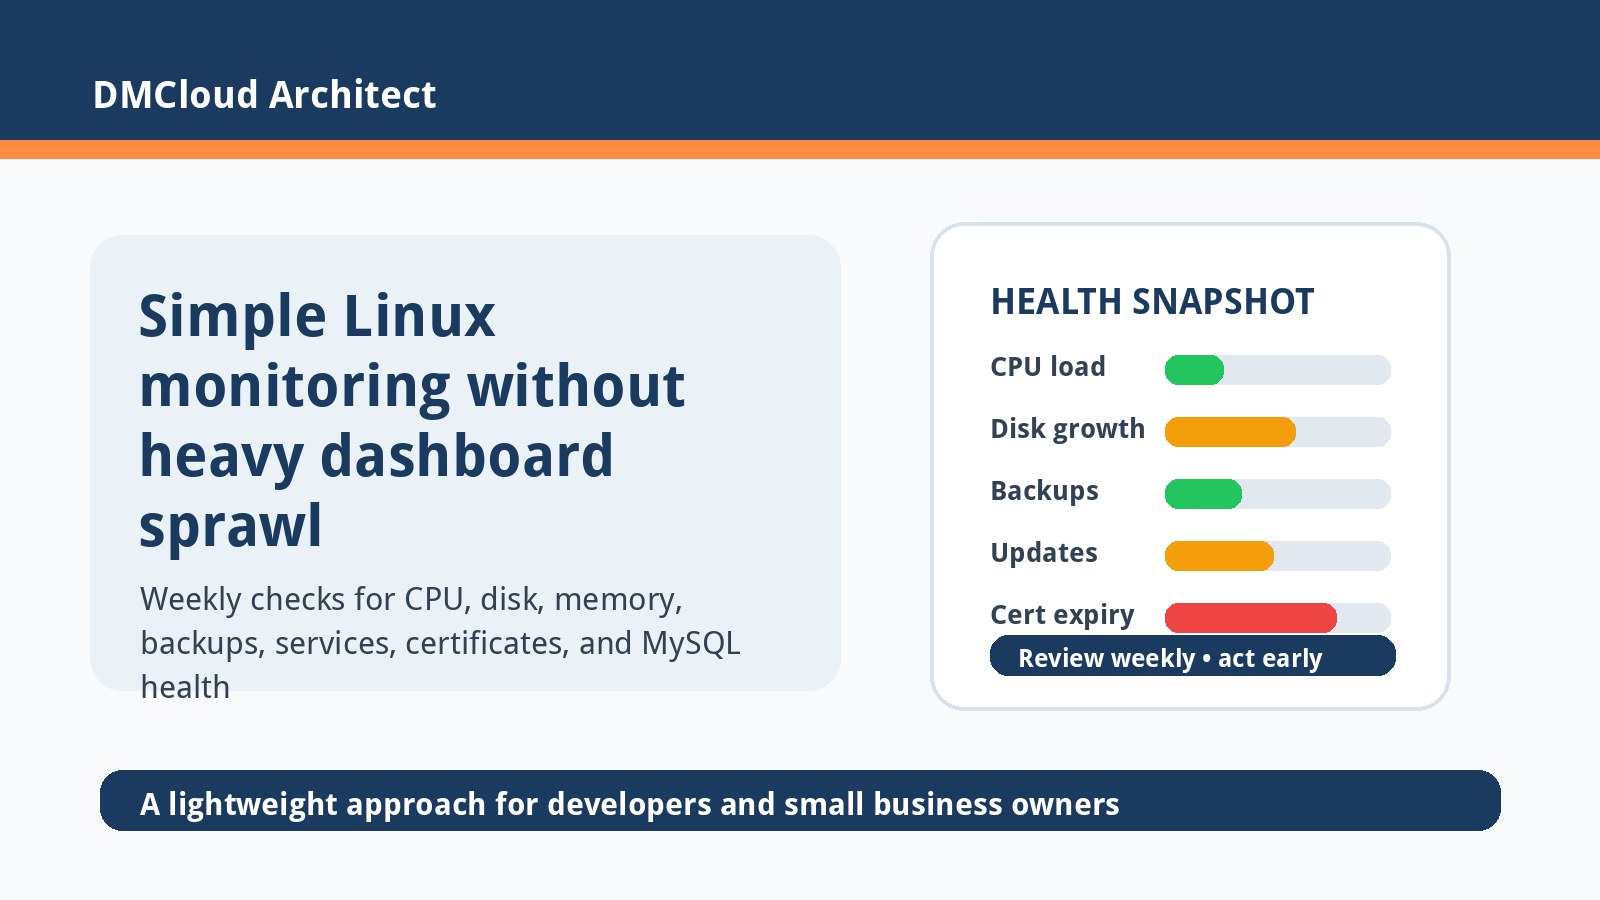
After the server is stable, write down the cause, detection gap, customer impact, mitigation, permanent fix, and what would have warned you earlier. Then adjust monitoring so the next signal is easier to understand. Small teams do not need every enterprise metric at once; they need a reliable starter set that catches meaningful changes.
- CPU load and top processes over time.
- Memory usage, swap activity, and OOM events.
- Disk usage, inode usage, and I/O wait trends.
- Service restarts, failed units, and process health.
- Web/application error rates and latency.
- Database connection counts, slow queries, and storage growth.
- Backup freshness and recent backup duration.
- Security signals such as failed logins and unexpected network exposure.
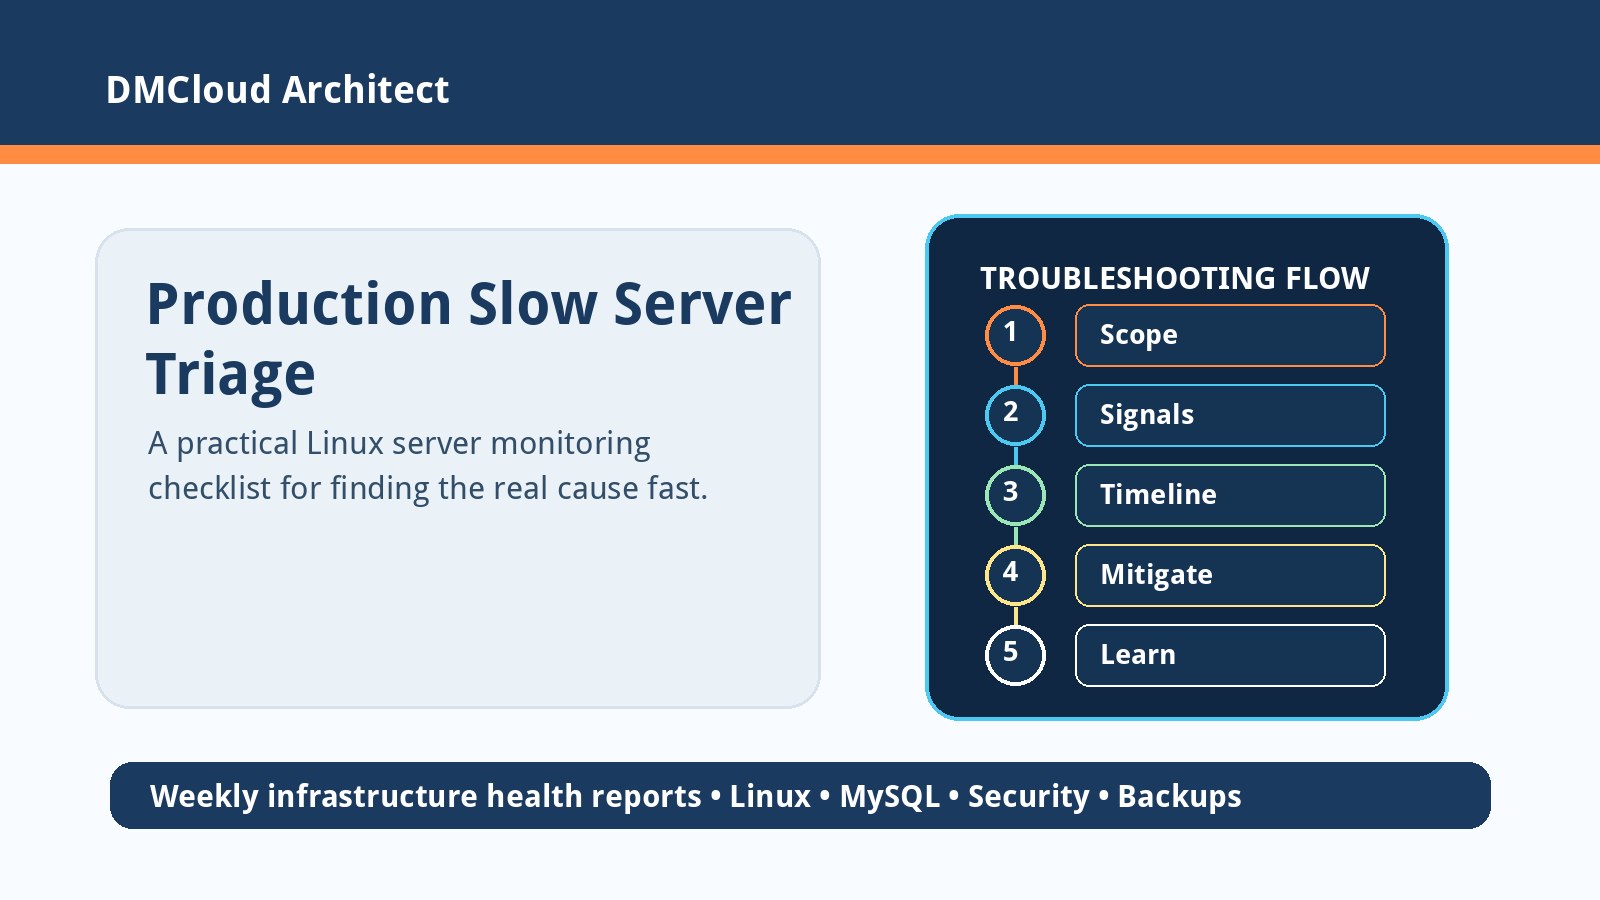
A practical slow-server triage flow
- Define the symptom and affected users.
- Check recent changes: deploys, packages, cron jobs, backups, traffic, and provider events.
- Capture a quick evidence snapshot before restarting services.
- Review CPU, memory, disk, network, and service status.
- Compare the current signal with the server’s normal baseline.
- Correlate logs and metrics into a timeline.
- Mitigate safely, then confirm whether user impact improved.
- Document the root cause and improve monitoring.
Why this mindset matters for small teams
The strongest production engineers are not the ones who can list the most commands. They are the ones who ask better questions under pressure: What changed? Who is affected? What signal proves or disproves the hypothesis? What mitigation is safe? What can we learn so the next incident is shorter?
That mindset is exactly what healthy infrastructure reporting should support. A weekly summary of capacity, database, service, backup, and security signals gives small teams context before an outage, not just a pile of charts after customers complain.
Want weekly Linux server health checks without dashboard fatigue?
DMCloud Architect turns practical infrastructure signals into plain-language reports so developers and small business owners can spot capacity, database, service, and security risks early.
Get the free starter plan for weekly infrastructure health reports.