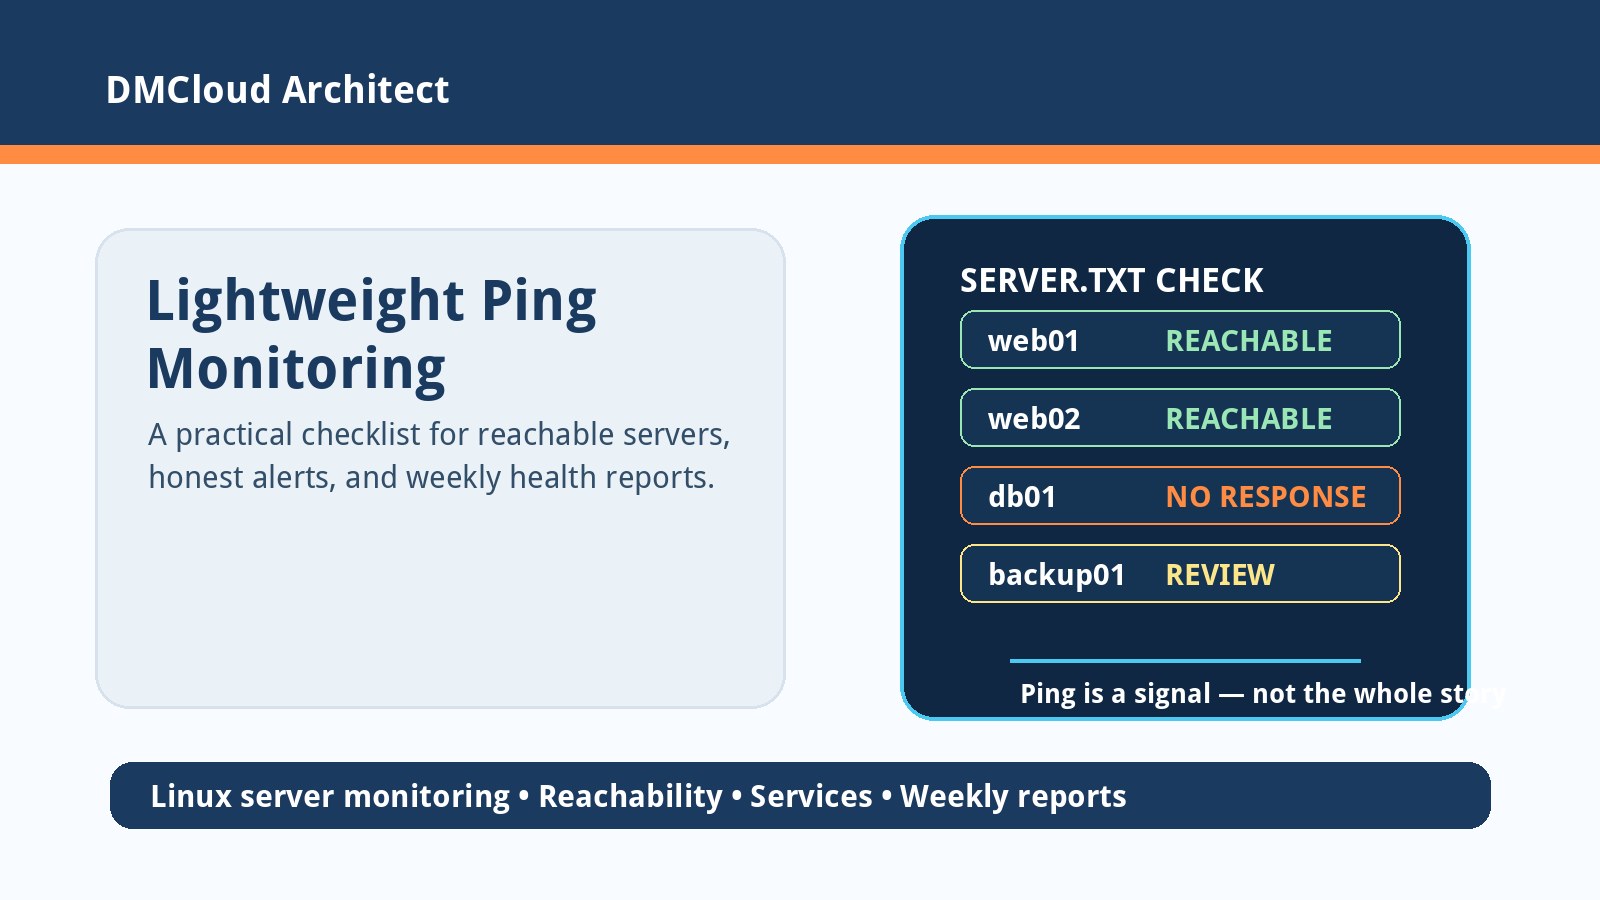
A small team does not always need a full observability stack just to answer one urgent question: are these servers reachable right now? A short Bash script that reads a server list and runs ping can be a useful first step, especially for developers, consultants, and small business owners who manage a handful of Linux hosts. The key is to treat ping as one signal inside a practical linux server monitoring checklist, not as proof that everything is healthy.
This guide shows how to make a lightweight ping check more reliable, what it can and cannot tell you, and when to graduate from an ad hoc script to a repeatable infrastructure health report. Use it when you want a simple reachability check without building a dashboard that nobody has time to maintain.
Start with a clean server list
A file such as server.txt is easy to maintain, but it needs a little structure. Put one host per line, avoid trailing comments that your script cannot parse, and decide whether each entry should be a hostname, private IP, public IP, or load balancer address. If some hosts should only be reachable over VPN or a private network, keep them in a separate list so public checks do not create false alarms.
For small environments, a simple format is often enough:
web01.example.com
web02.example.com
10.0.2.15
db01.internal.example.com
Before checking live status, trim blank lines, ignore comments, and validate that entries only contain expected hostname or IP characters. Validation is not about being fancy; it prevents a typo or pasted shell fragment from becoming a confusing monitoring result.
Use ping for reachability, not health
ping tells you whether ICMP echo replies are coming back. That is helpful, but it is not the same as saying Nginx is serving pages, MySQL is accepting connections, disk space is safe, backups are current, or CPU load is normal. Some networks block ICMP entirely. Some servers reply to ping while the application is down. Some load balancers answer even when a backend is unhealthy.
That means your status wording should be honest. Prefer labels such as “reachable by ping” and “no ping response” instead of “server running” and “server down.” This small wording change prevents false confidence and makes the report more useful during troubleshooting.
A lightweight checklist for a better Bash ping script
If you keep the script simple, make the output consistent and easy to scan. The most useful version usually includes:
- Input hygiene: skip empty lines, allow comments, and validate hostnames or IP addresses before testing.
- Short timeouts: use a small count and timeout so one unresponsive host does not delay the whole run.
- Clear labels: report reachable, no response, invalid entry, and skipped entry separately.
- Timestamps: include when the check ran so results can be compared later.
- Exit codes: return a non-zero exit when one or more required hosts fail, especially if cron or another wrapper watches the script.
- Optional logging: append results to a dated log file when you need history, not just terminal output.
Here is a compact pattern that keeps those ideas visible:
#!/usr/bin/env bash
set -euo pipefail

server_file="${1:-server.txt}"
failures=0

while IFS= read -r raw || [[ -n "$raw" ]]; do
  host="${raw%%#*}"
  host="$(echo "$host" | xargs)"

  [[ -z "$host" ]] && continue

  if [[ ! "$host" =~ ^[A-Za-z0-9._:-]+$ ]]; then
    printf '%s INVALID %s
' "$(date -Is)" "$host"
    failures=$((failures + 1))
    continue
  fi

  if ping -c 2 -W 2 "$host" >/dev/null 2>&1; then
    printf '%s REACHABLE %s
' "$(date -Is)" "$host"
  else
    printf '%s NO_PING_RESPONSE %s
' "$(date -Is)" "$host"
    failures=$((failures + 1))
  fi
done < "$server_file"

exit "$failures"
This is intentionally modest. It does not pretend to replace service monitoring, but it does create a repeatable first check that can run from a terminal, cron job, deployment script, or jump host.
Add service checks where ping is not enough
Once the ping list works, add one or two checks that match the business impact. A web server should have an HTTP or HTTPS health check. A database server may need a lightweight connection check from an approved host. A backup server should report recent successful backup time. A VPN-only server should be checked from inside the network path users actually depend on.
For example, if web01 replies to ping but HTTPS returns a 502, customers still have a problem. If db01 replies to ping but the disk is full, the application can still fail. Good linux server monitoring starts with reachability and then adds the smallest set of signals that explain real user risk.
Decide what should alert and what should become a report
Not every failed ping deserves a 2 a.m. page. A lab host, staging box, or maintenance window may only need a daily or weekly note. A production payment server, client portal, or database primary may need a faster escalation path. Split your server list by criticality so your response matches the risk.
For small teams, a useful rhythm is:
- Immediate alert: production endpoints that must be reachable during business hours or around the clock.
- Daily check: important internal systems, scheduled jobs, and backup targets.
- Weekly report: capacity trends, slow growth, disk usage, service restarts, failed logins, database changes, and recurring weak signals.
This prevents alert fatigue while still making sure problems do not sit unnoticed for weeks.
Keep history so patterns are visible
A one-time ping result is useful for triage. A week of results is useful for pattern detection. If the same host misses one check every morning during backup time, that is a very different problem from a host that disappears randomly throughout the day. If several hosts fail together, the root cause may be DNS, VPN, routing, firewalling, or the monitoring location itself.
Even a simple CSV or log file can help:
timestamp,host,status,source
2026-08-27T08:00:00Z,web01.example.com,reachable,cron
2026-08-27T08:00:03Z,db01.internal.example.com,no_ping_response,cron
Reviewing those logs weekly is where lightweight checks become operational knowledge. You can spot recurring outages, stale hostnames, decommissioned servers that never left the list, and systems that need deeper monitoring.
Common mistakes to avoid
- Calling a host “up” based only on ICMP: say “reachable” unless you also checked the service.
- Running checks from the wrong network: test from a location that mirrors real access paths.
- Ignoring DNS failures: distinguish name resolution problems from network reachability problems.
- Using endless timeouts: failed hosts should be quick to detect, not stall the whole script.
- Alerting on everything: separate production, staging, lab, and retired systems.
- Never reviewing the list: stale server inventories create noise and hide real issues.
When a weekly infrastructure report is better than another dashboard
Dashboards are valuable when someone is watching them and knows what each chart means. Many small teams, however, need a calmer operating model: a concise weekly report that says what changed, what is risky, what is stable, and what needs attention. Ping reachability can be one line in that report, alongside CPU load, disk growth, memory pressure, failed services, MySQL health, backups, patching, and security signals.
That approach keeps the lightweight spirit of a Bash script while adding the context that prevents surprises. You still get simple checks, but you also get trends and plain-language recommendations.
Want lightweight monitoring without dashboard fatigue?
DMCloud Architect turns practical Linux, database, backup, and security checks into weekly infrastructure health reports for developers and small business owners.
Get the free starter plan for weekly infrastructure health reports.