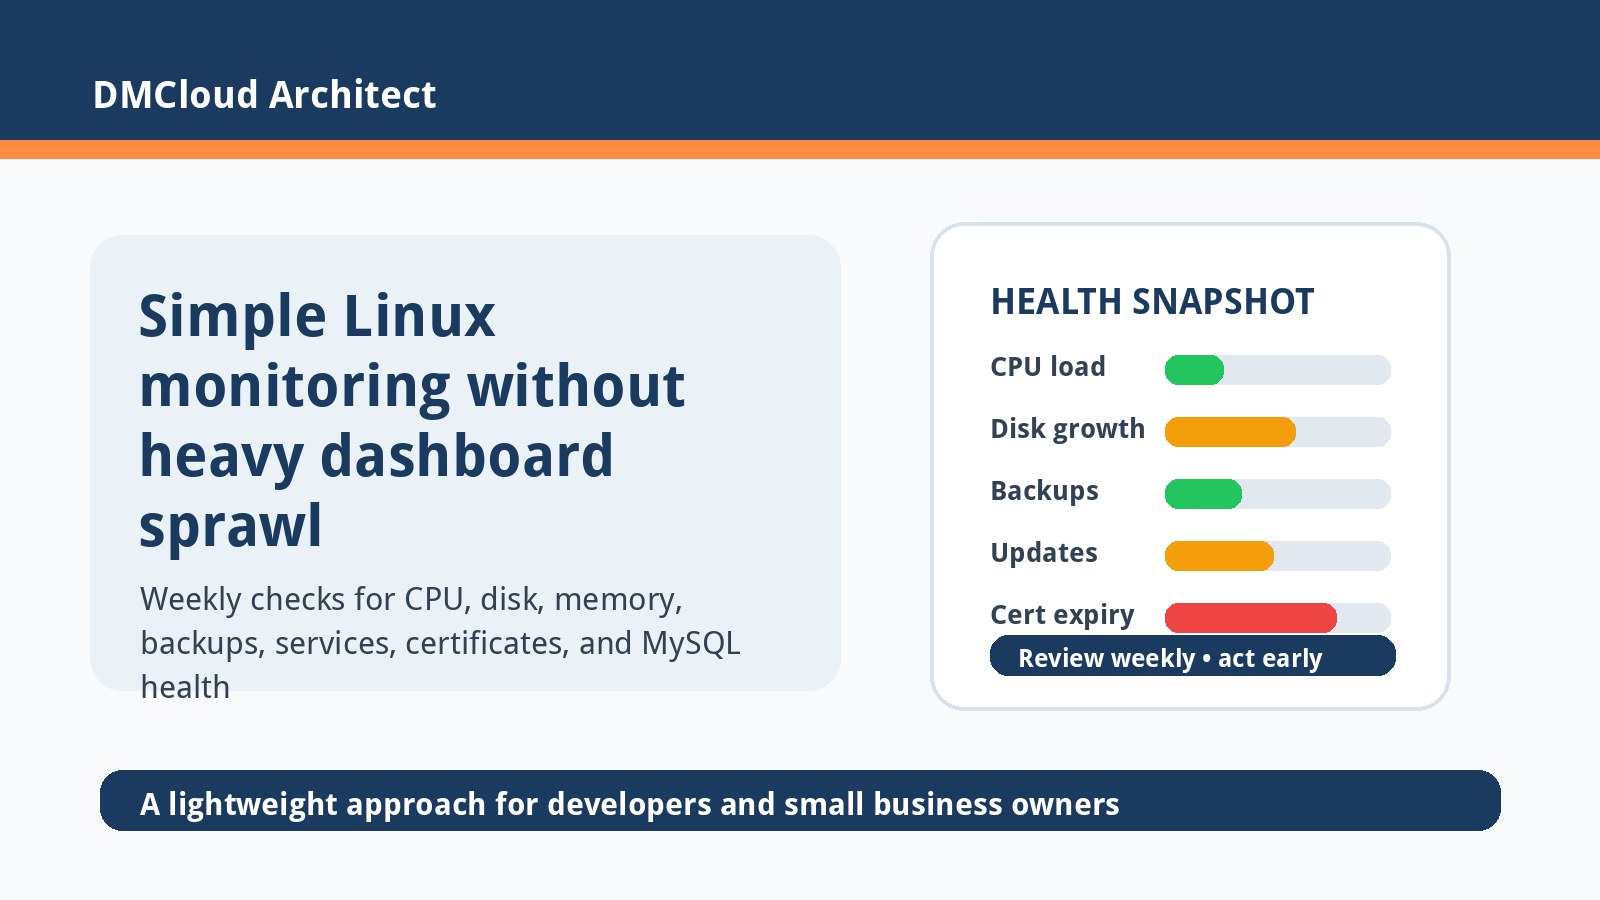
Many teams postpone server monitoring because the obvious tools feel bigger than the problem. Prometheus, Grafana, log pipelines, alert managers, and long metric-retention plans can be excellent, but they also require design, maintenance, and tuning. If you run a small business system or a lean developer-managed Linux server, the first goal is simpler: notice the problems that are likely to hurt customers before they become emergencies.
A simple linux monitoring solution should focus on operational questions, not dashboard volume. Is the server getting slower? Is disk growth accelerating? Are backups still succeeding? Are certificates, services, packages, or database checks drifting into risky territory? A lightweight review can answer those questions without turning monitoring into another platform to babysit.
Start with the risks that actually cause outages
The best minimal Linux monitoring setup begins with failure modes, not tools. For many small production servers, the most common risks are resource pressure, failed background services, expired certificates, missed backups, unpatched packages, and database issues that quietly build up over time.
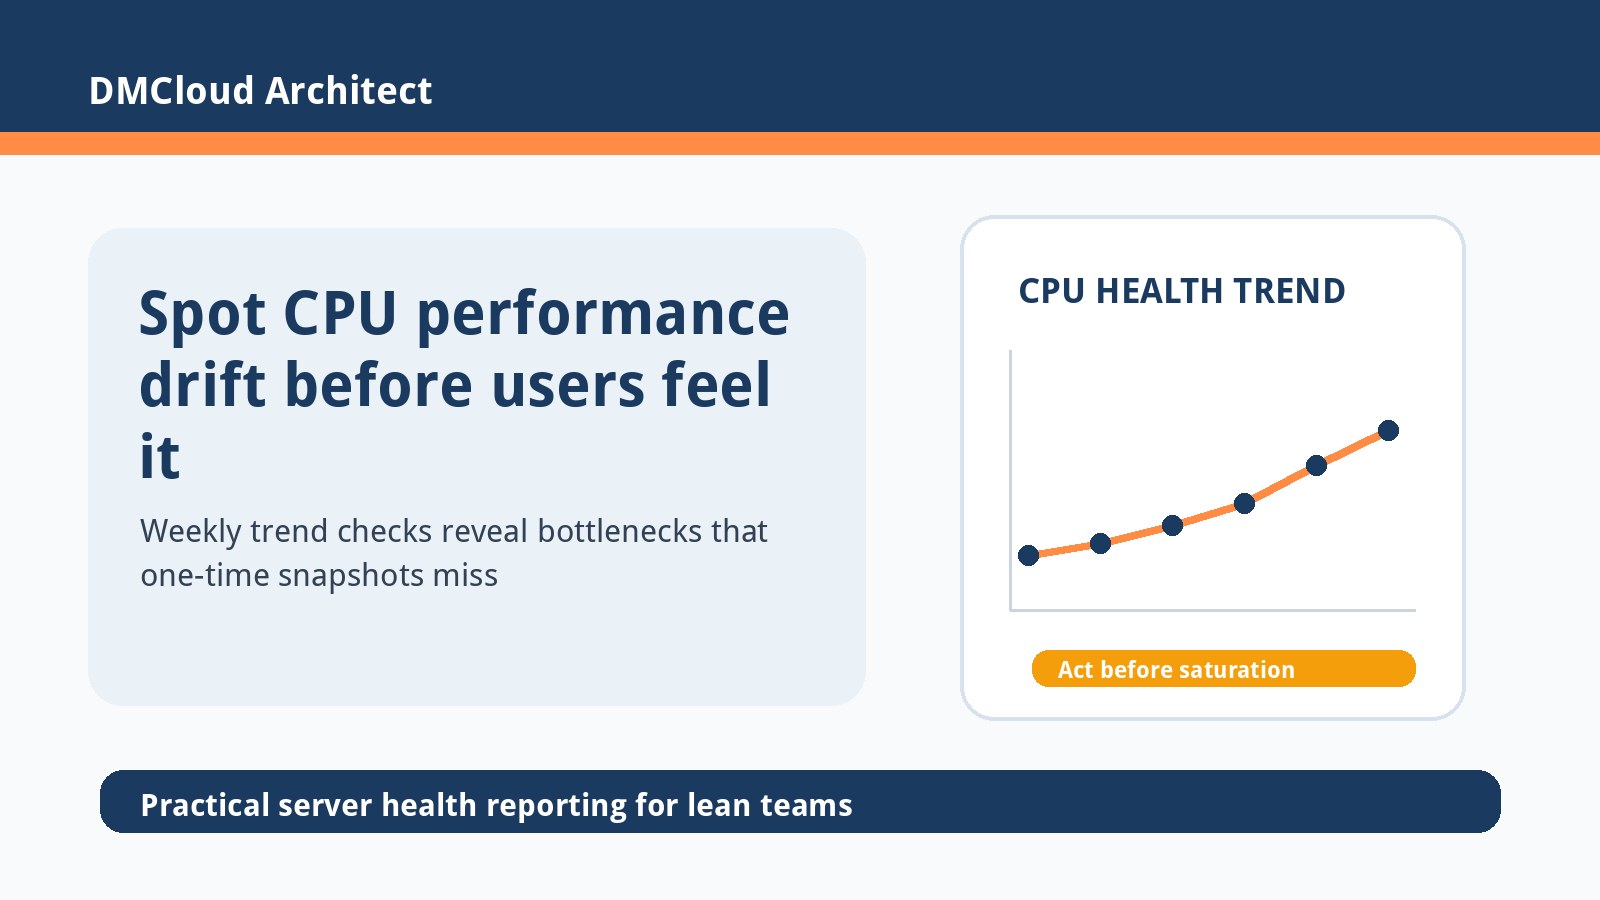
- CPU and load: sustained load increases can reveal runaway jobs, traffic changes, or undersized instances.
- Memory and swap: growing swap usage may point to application leaks, overloaded MySQL settings, or too many workers.
- Disk capacity: logs, uploads, database files, and backup staging directories can fill a filesystem slowly, then fail suddenly.
- Service health: web, queue, scheduler, database, and backup services should be checked for failed or restarting states.
- Security hygiene: pending updates, exposed ports, certificate expiry, and login noise are worth reviewing regularly.
Use weekly review before noisy alerts
Real-time alerts are useful for urgent failures, but they are not the only way to monitor. A weekly Linux health report gives small teams a calm way to see trends, compare current state with last week, and make decisions before an alert fires. This is especially helpful when no one wants another channel full of false positives.
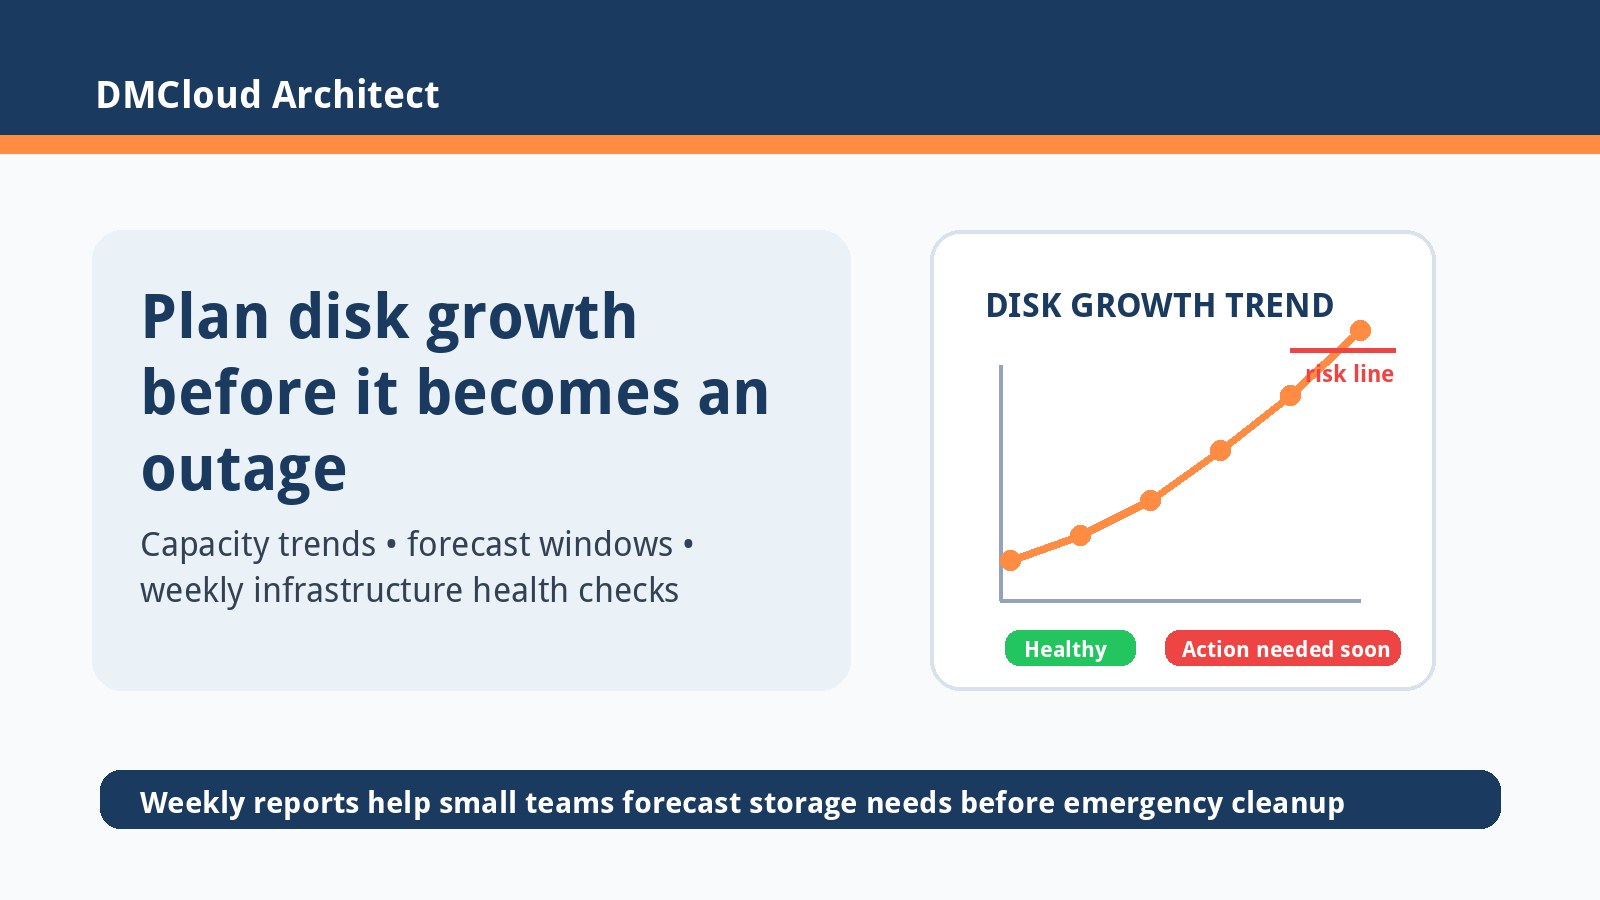
For example, a disk alert at 90% tells you when the problem is urgent. A weekly trend that says a filesystem is growing by 12 GB per week and has about six weeks before the action threshold gives you time to adjust retention, resize storage, move archives, or change application behavior.
Keep the first monitoring checklist short
A lightweight Linux monitoring tool or report should be easy to read. If the output takes twenty minutes to interpret, busy teams will stop using it. Start with a small checklist that maps directly to operational decisions:
- Current uptime, load average, CPU trend, and obvious process outliers.
- Memory pressure, swap activity, and recent out-of-memory indicators.
- Filesystem usage, inode usage, and growth compared with previous checks.
- Failed systemd services, scheduled jobs, and backup status.
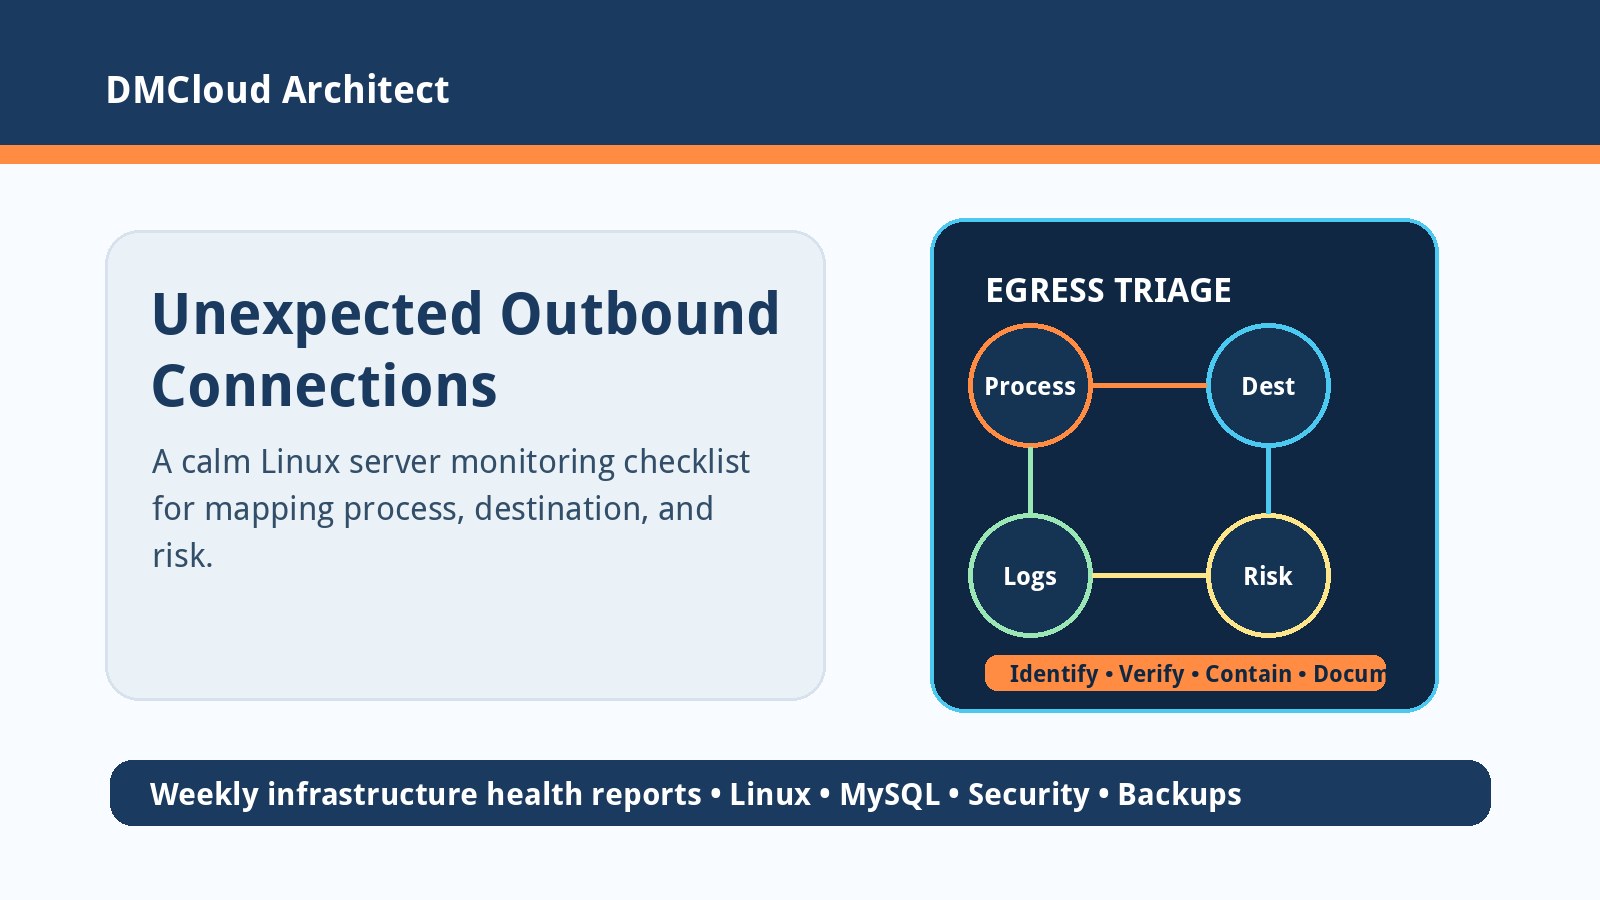
- Certificate expiry windows, pending security updates, and unexpected listening ports.
- Database-specific checks such as MySQL availability, storage growth, backups, and slow-query symptoms.
Choose practical thresholds
Simple monitoring does not mean vague monitoring. Define thresholds that match the business impact of the server. A small brochure site, an internal reporting server, and a customer-facing application should not all use the same urgency model.
Good thresholds often combine current state with trend. Disk at 82% may be fine when growth is stable and cleanup is automated. Disk at 60% may deserve attention if a new import process is adding large files every day. Likewise, a short CPU spike is less important than a sustained load increase over several weekly reports.
Avoid dashboard sprawl
Linux monitoring without Prometheus or Grafana can still be responsible when the system is small and the process is consistent. The point is not to reject dashboards forever; it is to avoid building a complex observability stack before you know which signals the business will act on.
Start with a repeatable report, a few trend lines, and clear action notes. If the server estate grows, the same checks can later feed dashboards, alerting, or a central monitoring platform. By then, the team will already know which signals matter.
Turn findings into action items
The most useful monitoring output tells someone what changed and what to do next. Replace generic statements like “disk is high” with specific guidance such as “database backups are consuming 18 GB more than last month; review retention or move archives before the next monthly import.”
For developers, this makes infrastructure work easier to prioritize. For business owners, it turns server health into a plain-language risk summary instead of a collection of technical numbers.
When to add heavier monitoring
A simple approach is a starting point, not a ceiling. Add deeper tooling when you need real-time alerting across many hosts, application performance tracing, long-term metric retention, incident correlation, or team dashboards. The key is to grow from a known set of operational questions rather than deploying every tool at once.
Until then, a focused weekly review can catch many of the issues that hurt small production systems: capacity drift, failed jobs, backup gaps, certificate surprises, and slow resource pressure.
Want a simpler way to keep watch on Linux server health?
DMCloud Architect provides weekly Linux and MySQL infrastructure health reports that highlight capacity trends, service issues, backup status, certificate risk, and practical next steps for small teams.
Get the free starter plan for weekly infrastructure health reports.