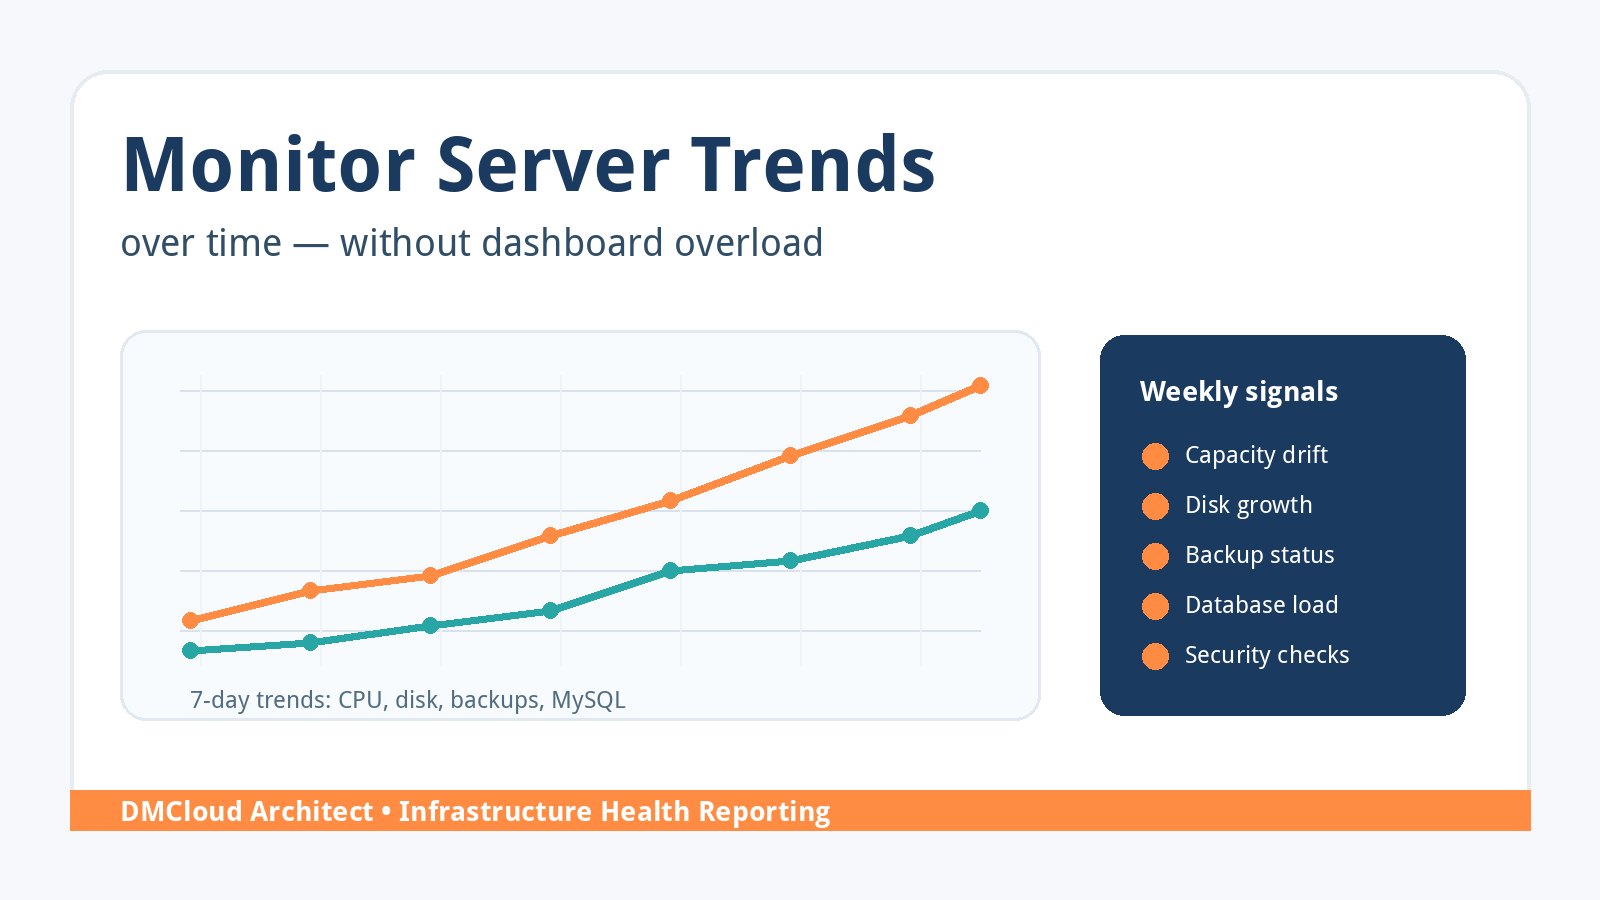
One unusual server metric can be useful, but a trend is usually more valuable. Small teams need to know whether CPU pressure, memory use, disk growth, MySQL load, backup reliability, and security signals are getting better, staying stable, or quietly drifting toward trouble.
When you monitor server trends over time, you move from firefighting to planning. A single warning tells you what is happening right now; historical server monitoring tells you whether the same issue has been building for days or weeks.
Why trend-based monitoring matters
Many infrastructure problems start as small changes that look harmless in isolation. A database volume grows a few gigabytes per week, swap usage appears after a new release, nightly backups take longer each month, or average CPU load creeps upward during business hours.
Performance trend monitoring makes those patterns visible before customers experience slow pages, failed jobs, or outages. It also helps developers and owners make calm decisions: clean logs, resize a server, tune a query, review a backup process, or schedule maintenance before the situation becomes urgent.
Start with a compact set of server trends
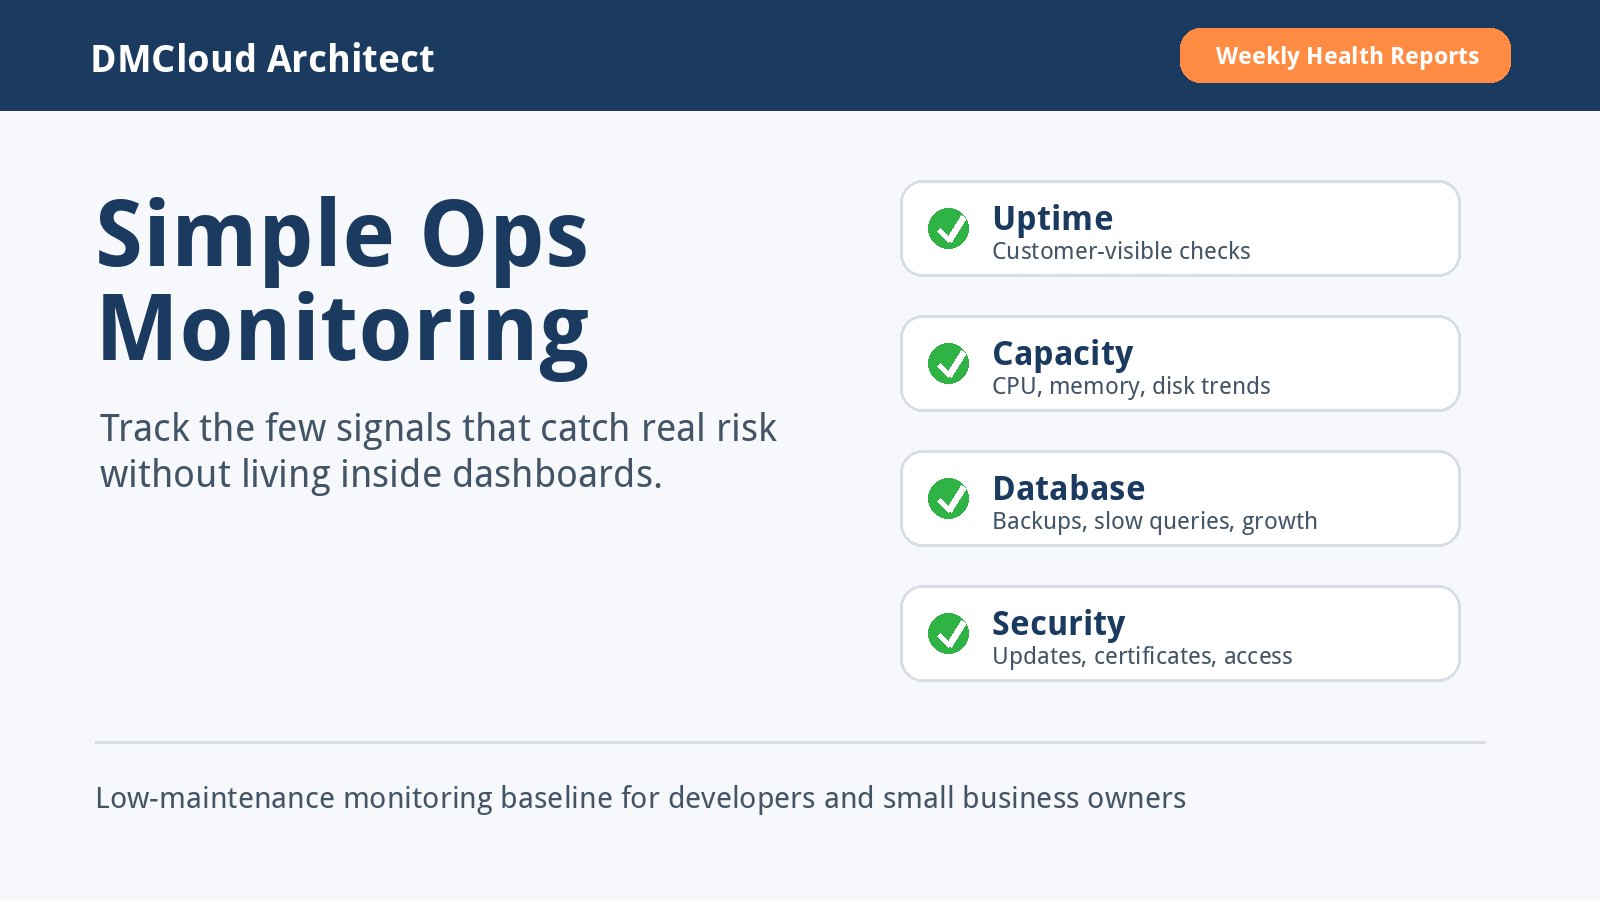
A good trend based monitoring server baseline does not need hundreds of charts. Start with signals that explain capacity, reliability, and recovery risk. For most small business applications, that means CPU load average, memory pressure, swap usage, disk utilization, database growth, backup completion, certificate status, and key security events.
The goal is not to watch everything. The goal is to choose the few trends that would change what you do next week. If a metric never triggers an action, it probably should not be part of your core weekly review.
Track resource pressure over days and weeks
CPU, memory, and disk trends tell you whether a server is under increasing strain. A one-hour CPU spike may be normal after a batch job, but a month of rising daytime load can signal traffic growth, inefficient code, or a background process that now needs attention.
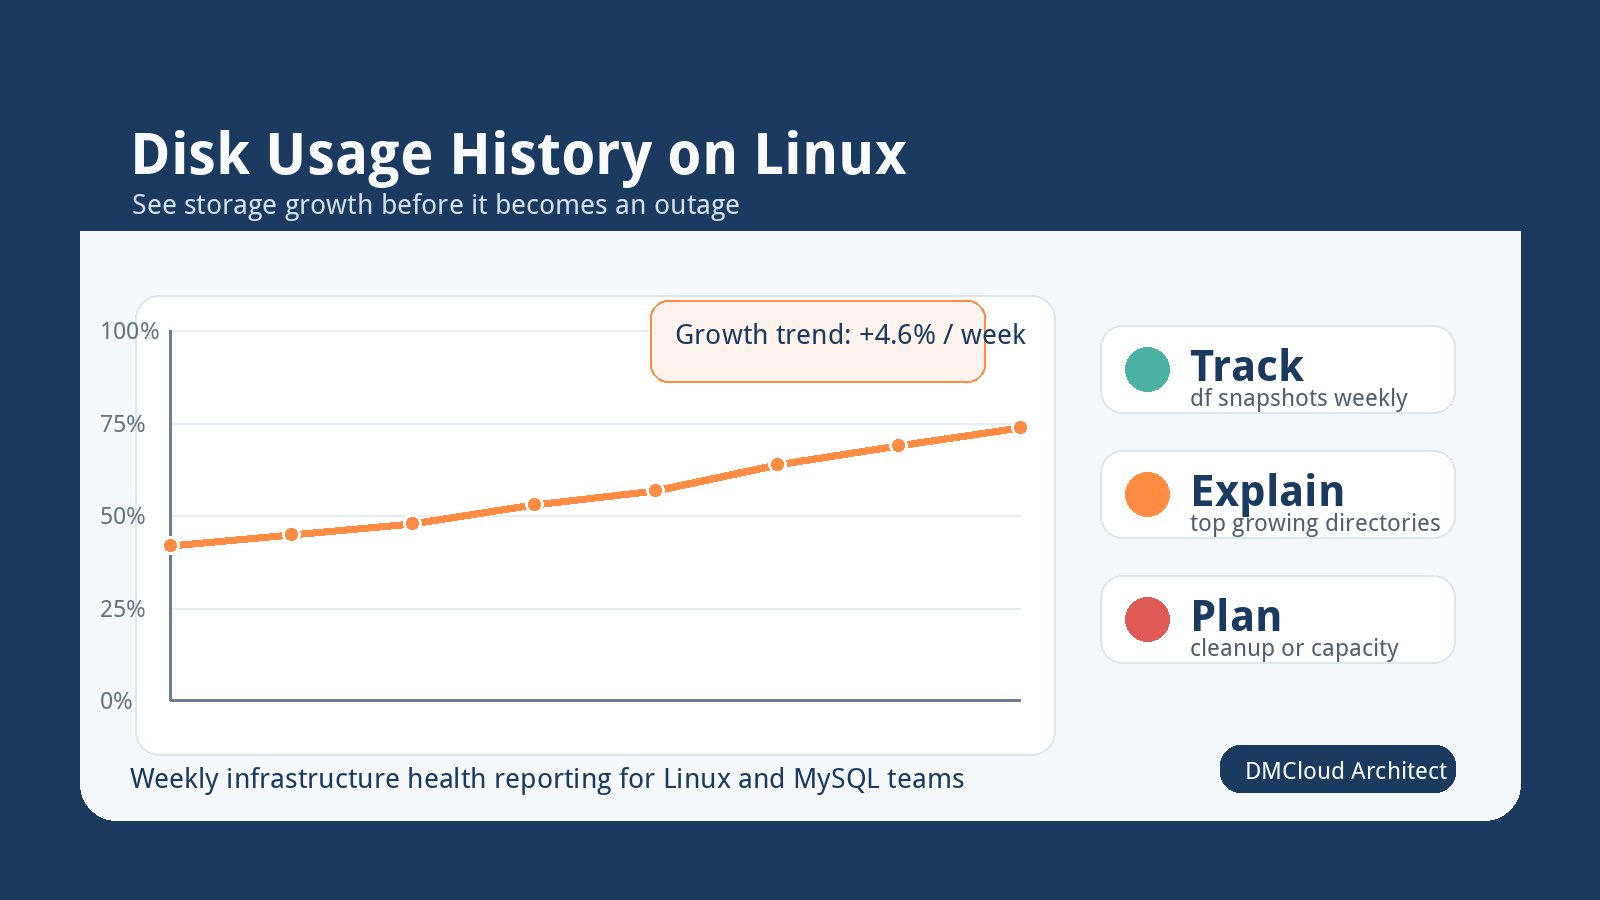
Disk trends deserve special focus because they can turn into outages quickly. Track root volume usage, database storage, uploaded assets, logs, and backup directories separately where possible. A clear growth line gives you time to rotate logs, archive data, expand storage, or investigate unexpected file creation.
Include database and application signals
Infrastructure trends monitoring should include the database, not just the virtual machine. MySQL table growth, slow query counts, failed connections, long-running jobs, and backup duration can explain user-facing slowness before basic server charts look alarming.
Application-level context matters too. If a release added a new report, import job, or API endpoint, compare the trend before and after that change. This helps developers connect operational symptoms to real application behavior instead of guessing from isolated alerts.
Use weekly reviews for non-urgent trends
Urgent alerts should stay rare: downtime, dangerously full disks, failed backups, certificate expiration, or clear security issues. Most trends are better reviewed on a weekly rhythm so the team can see direction without living inside dashboards.
A useful weekly summary answers three questions: what is healthy, what should be watched, and what needs action. This format works well for small teams because it converts raw monitoring data into decisions that owners and developers can understand quickly.
Turn historical monitoring into maintenance decisions
Server trend analysis becomes valuable when it leads to action. Rising CPU may mean scheduling a code review or resizing a VM. Growing database storage may mean archiving old rows or checking indexes. Longer backup times may mean adjusting retention, testing restores, or moving backups to a better target.
Keep a lightweight record of decisions made from trend data. Over time, this creates an operational history that helps you understand which changes improved stability and which problems tend to repeat.
A practical weekly trend checklist
- Review average CPU load, memory pressure, and swap usage for the past 7 to 30 days.
- Check disk growth by volume, especially logs, database storage, uploads, and backups.
- Compare MySQL size, slow query activity, connection pressure, and backup duration.
- Confirm the latest backups completed and note whether restore testing is current.
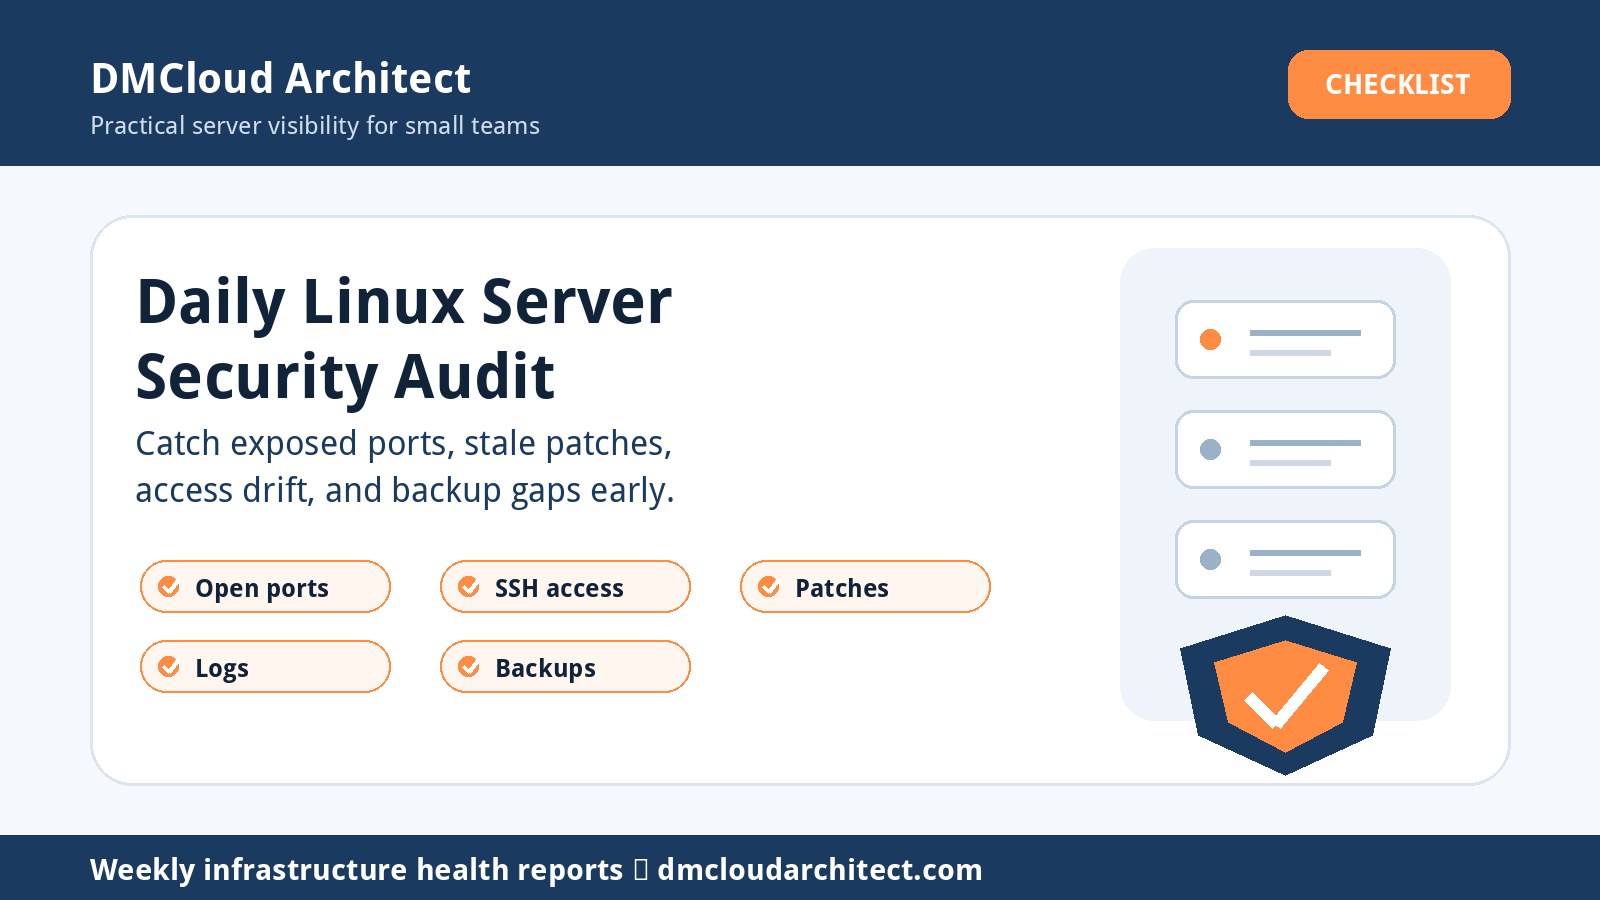
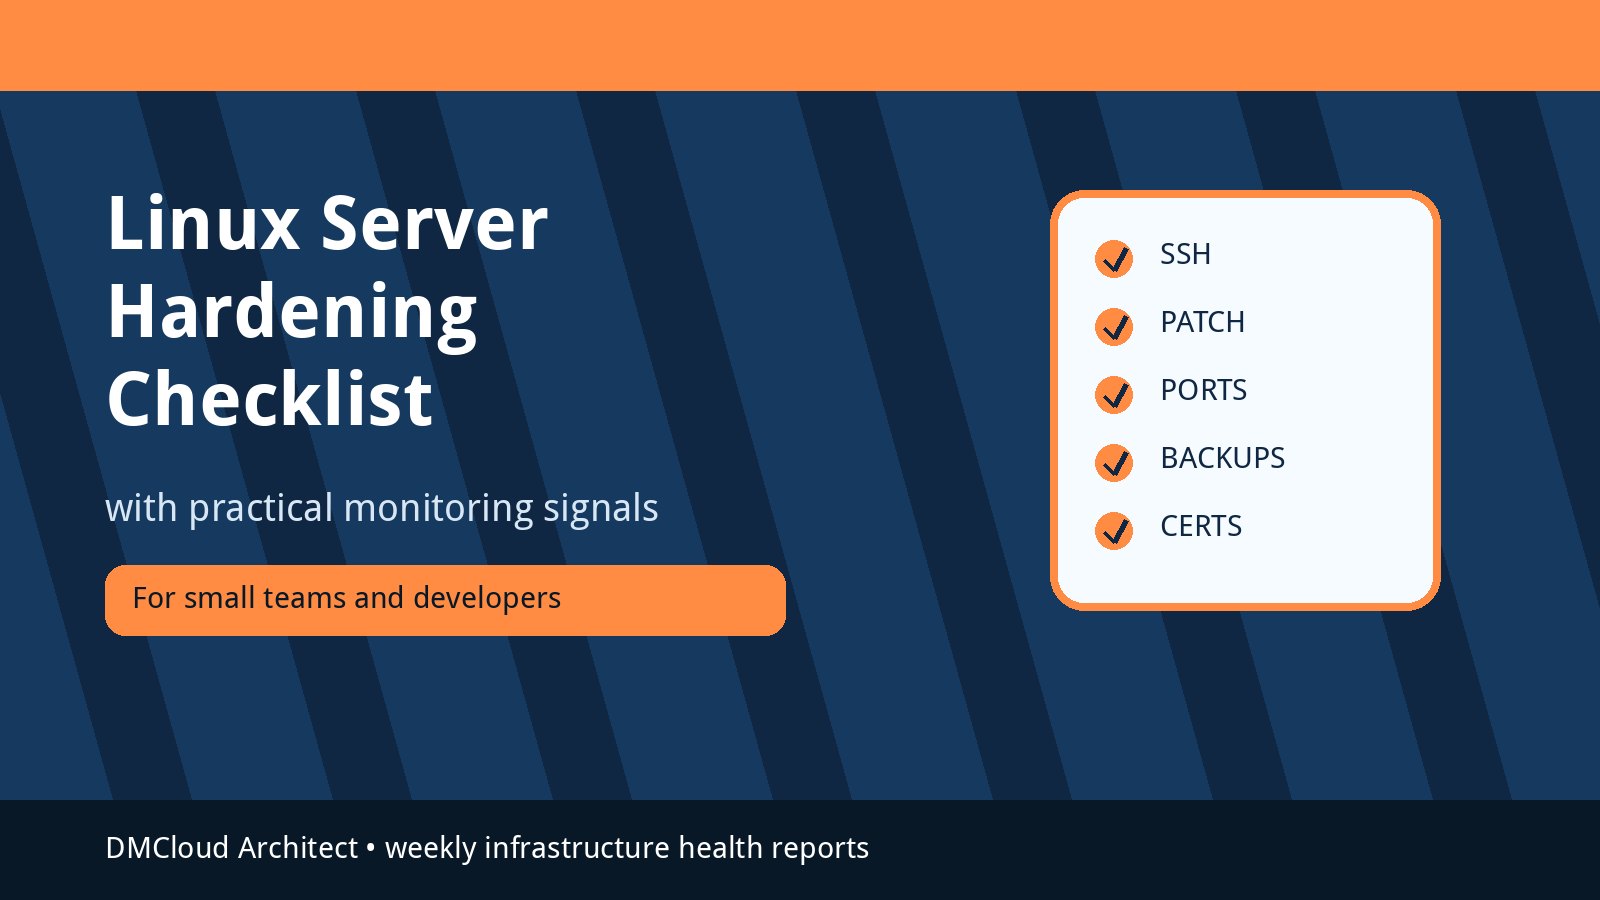
- Look for certificate expiration, failed login spikes, exposed services, and pending critical updates.
- Label each finding as healthy, watch, or action needed.
Keep the system lightweight
The best monitoring system for a small team is the one that actually gets reviewed. Start with a weekly infrastructure health report, keep the number of metrics small, and expand only when a new signal explains a real decision.
As your environment grows, you can add deeper observability, synthetic checks, and more detailed database dashboards. But the foundation should stay simple: track the trends that show whether infrastructure risk is rising, then act before small issues become outages.
Want weekly infrastructure trend checks without dashboard fatigue?
DMCloud Architect sends Linux and MySQL infrastructure health reports directly to your inbox, so you can spot capacity, backup, and reliability trends before they become urgent.
Get the free starter plan for weekly infrastructure health reports.