Back to Blog
Simple Ops Monitoring for Small Teams: What to Track Without Dashboard Overload

Simple Ops Monitoring for Small Teams: What to Track Without Dashboard Overload

   Mariusz Antonik    Automation    5 min read    12 views

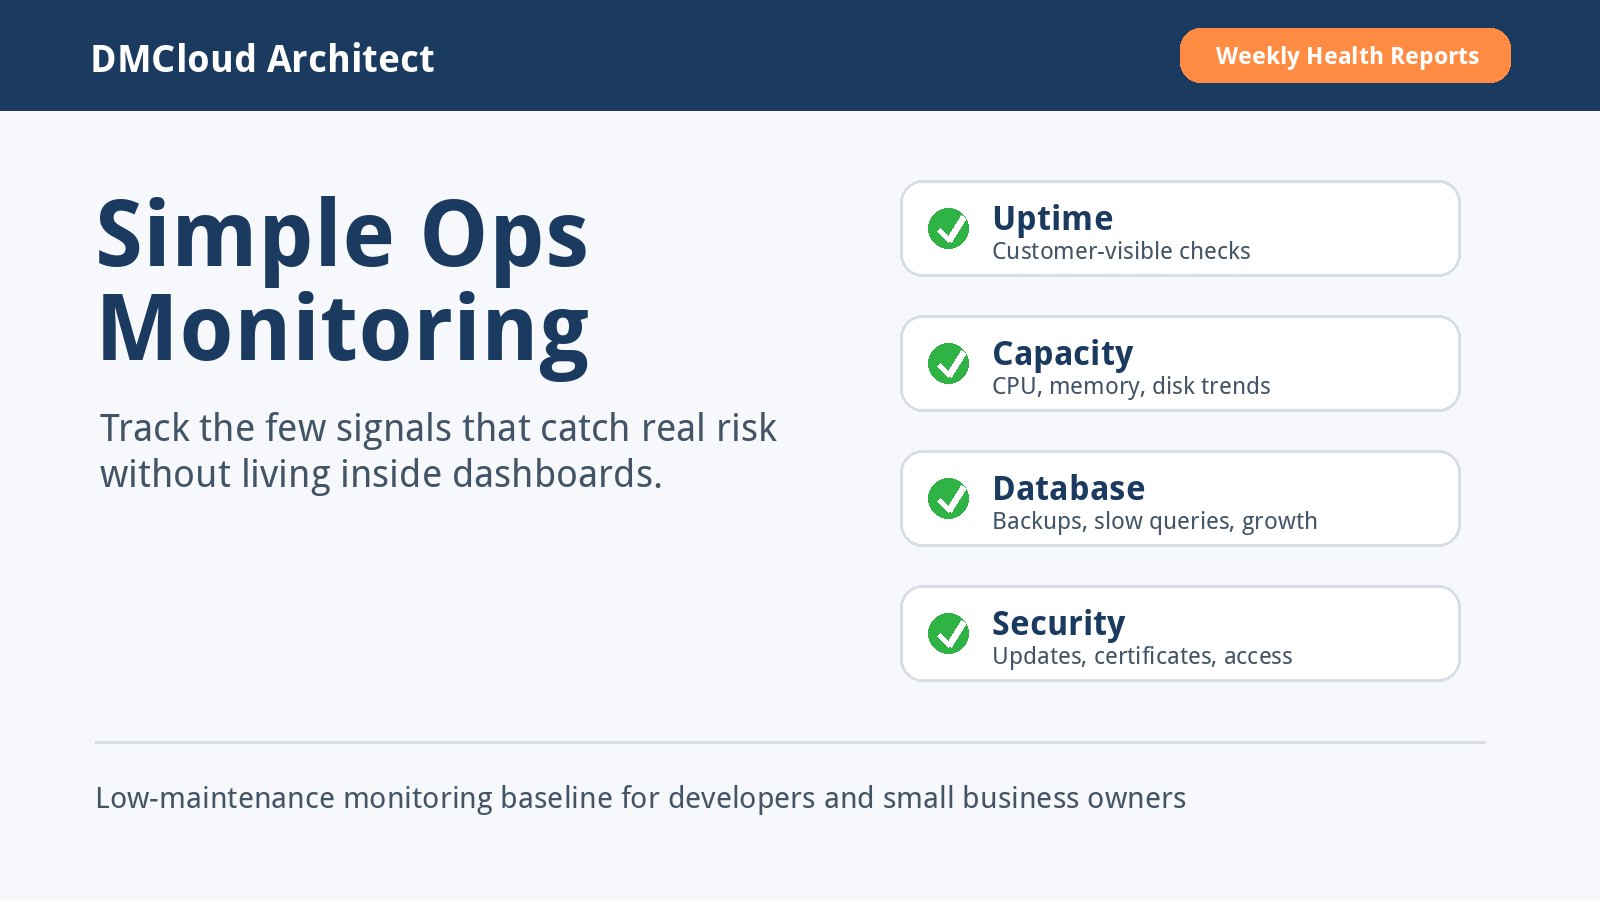
Small teams usually do not need a wall of charts to know whether infrastructure is healthy. They need a simple monitoring system that answers a few operational questions quickly: is the site reachable, is the server under pressure, is the database behaving, and would recovery work if something failed tonight?

That is the promise of simple ops monitoring. Instead of chasing every possible metric, you choose a compact baseline that reveals the most common failures early and review it on a rhythm your team can actually sustain.

Start with customer-visible availability

The first signal is the one your customers feel: whether the website, API, portal, or admin tool responds reliably. A basic uptime check from outside your server is often enough to catch expired certificates, broken deployments, DNS mistakes, and hard outages.

For small business systems, the useful question is not just “did it go down?” but “how long was it unavailable, and did anyone notice before customers did?” Keep a simple record of outages, response time spikes, and repeated short interruptions so patterns are visible.

Watch resource pressure before it becomes an outage

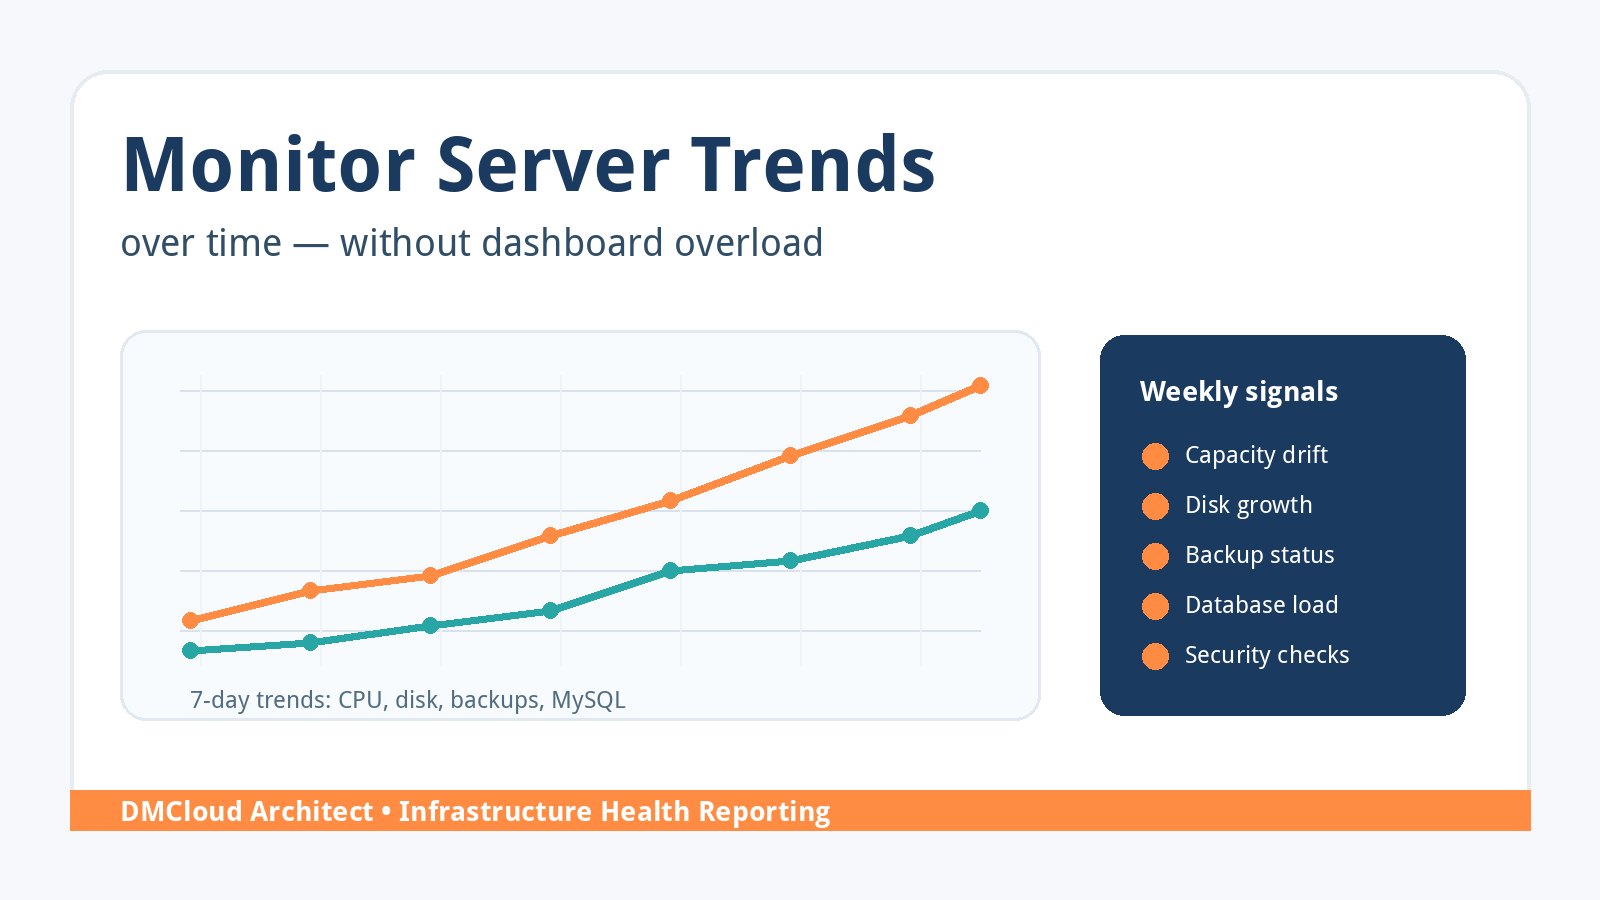
CPU load, memory pressure, disk usage, and swap activity are the practical server monitoring signals that tell you when a machine is getting squeezed. You do not need minute-by-minute dashboards for every process at first. A weekly trend is often enough to show that traffic, logs, backups, or a new job are gradually consuming capacity.

Disk is especially important because it fails quietly until it fails loudly. Track root volume usage, database volume usage, and log growth separately where possible. A server at 82% full with steady growth may be a normal planning item; a server that jumped from 55% to 82% in a week deserves investigation.

Include database health, not just server health

Many small applications are limited by MySQL or another database before the web server looks unhealthy. Useful database checks include whether backups completed, whether tables are growing unexpectedly, whether slow queries are increasing, and whether connections are repeatedly hitting limits.

Easy infrastructure monitoring should connect these signals to operational decisions. If slow queries rose after a feature launch, you may need an index or query review. If backups are succeeding but restores have never been tested, the monitoring story is incomplete.

Make backup and recovery checks visible

A backup system that no one reviews is closer to a hope than a control. At minimum, track the last successful backup time, the backup location, retention coverage, and any failures that need human action. For important systems, schedule periodic restore tests and record the result.

This is where low maintenance monitoring can protect a business from expensive surprises. The goal is not to create more alerts; it is to keep evidence that recovery would be possible when a mistake, hardware problem, or bad deployment happens.

Keep security and patching signals lightweight

Small teams also benefit from a few security-oriented checks: pending critical updates, exposed admin ports, certificate expiration, failed login spikes, and unexpected services listening on public interfaces. These checks do not replace a security program, but they catch common infrastructure hygiene problems.

For developers who wear the operations hat, this practical baseline is easier to maintain than a long checklist that never gets reviewed. Start with the checks that match your real risk: public web servers, SSH access, database exposure, SSL certificates, and package updates.

Review on a weekly rhythm

The simplest way to avoid dashboard overload is to separate urgent alerts from routine review. Urgent alerts should be rare and reserved for customer-visible outages, dangerously full disks, failed backups, or clear security events. Everything else can roll into a weekly infrastructure health summary.

A weekly report gives owners and developers enough context to make decisions without staring at tools all day. It can highlight trends, call out the few items that need attention, and leave healthy systems alone.

A practical starter checklist

  • External uptime and SSL certificate status for public services.
  • CPU load, memory pressure, swap usage, and disk growth trends.
  • MySQL backup success, database growth, slow query changes, and connection pressure.
  • Critical package updates, exposed services, and failed login spikes.
  • Restore-test dates and any backup failures that need follow-up.
  • A weekly summary with clear “healthy,” “watch,” and “action needed” sections.

How to keep monitoring simple as you grow

Start with the smallest set of checks that would have caught your last few incidents or near misses. Add metrics only when they explain a decision, reduce risk, or save time. If a metric never changes what you do, it probably belongs outside your core monitoring baseline.

As the system grows, you can add deeper observability, application traces, synthetic tests, and more detailed database analytics. But the foundation should remain understandable: customers can reach the service, servers have capacity, data is protected, and someone sees the weekly risk picture.

Want weekly infrastructure health checks without dashboard fatigue?

DMCloud Architect sends Linux and MySQL infrastructure health reports directly to your inbox, so you can spot risks early without adding another monitoring dashboard to watch.

Get the free starter plan for weekly infrastructure health reports.
About the Author
Mariusz Antonik

Oracle Cloud Infrastructure expert and consultant specializing in database management and automation.

All Tags
#Advanced #agent-visibility #alerts #amazon-linux-2023 #argo-cd #auditd #automation #backend-infrastructure #backup-verification #bandwidth-monitoring #bare-metal-server #Bash #bash cpu monitoring script #bash monitoring #bash scripting #bash-scripts #Beginner #Best Practices #block volume backup #Capacity Planning #centos-ftp-migration #centralized-logging #cloud backup strategy #cloud-costs #cloud-database-setup #cloud-networking #cloudflare-workers #compute #container-monitoring #control-panel-security #cpu bottleneck #CPU Monitoring #cpu monitoring linux #cpu monitoring script linux #cpu trends #cpu usage trends #cpu usage trends linux #cpu-monitoring-script #cpu-monitoring-without-tools #cpu-performance-decline-server #cpu-performance-degradation-linux #cpu-usage-history-linux #create oracle db system in oci #cron #cron cpu monitoring #cron cpu monitoring linux #cron jobs #cron-monitoring #custom-linux-distribution #cve-advisory #database #database monitoring #database performance #database-health #database-setup #debian #detect slow queries mysql #devops #devops-checklist #devops-help #disk capacity planning server #disk forecasting linux #disk growth trend linux #Disk Monitoring #disk usage #disk usage script linux #disk usage trends #disk-capacity #disk-saturation-detection-linux #Early Detection #easy infrastructure monitoring #elasticsearch #fail2ban #field-server-checklist #firewall-rules #fleet-ops #free-tier #gitops-security #Guide #health dashboards #Health Reporting #historical server monitoring #how to monitor cpu usage linux #https-certificates #infrastructure #infrastructure health #infrastructure health dashboard #infrastructure health reporting #infrastructure monitoring #infrastructure monitoring report #infrastructure trends #infrastructure trends monitoring #Infrastructure Visibility #infrastructure-automation #infrastructure-checklist #interview-prep #ip-allowlist #journald #kubernetes-security #lightweight linux monitoring #lightweight monitoring #lightweight-monitoring-solution #linux #linux administration #linux cpu monitoring #linux cpu usage #linux disk capacity planning #linux disk usage #Linux monitoring #linux monitoring setup #linux monitoring tools #linux performance #linux performance monitoring #linux server #linux server monitoring #linux servers #linux storage #linux tools #linux-admin #linux-disk-monitoring #linux-hotspot #linux-monitoring-for-small-business #linux-networking #linux-performance-tuning #linux-remote-desktop #linux-security #linux-server-health #local-dns #log-management #log-retention #logrotate #loki #low maintenance monitoring #mkcert #monitor cpu usage over time linux #monitor linux server health #monitor server trends #monitor small production server #monitoring #monitoring without complexity #monitoring-without-devops-team #MySQL #mysql health reporting #MySQL monitoring #mysql optimization #MySQL Performance #mysql performance degradation #mysql performance monitoring #mysql performance trends #mysql query performance issues #mysql server monitoring #mysql slow queries #mysql slow query analysis #mysql slow query monitoring #mysql trends #mysql-health #mysql-heatwave #mysql-monitoring-lightweight #mysql-workload-trends #networking #networkpolicy #nsg #OCI #oci backup #oci bastion tutorial #oci block volume #oci infrastructure as code #OCI monitoring #oci networking #oci oracle database private subnet setup #oci oracle database tutorial #oci security #oci setup guide #oci terraform tutorial #oci tutorial for beginners #oci vcn terraform #oci virtual machine db system guide #oci-database #oci-mysql-heatwave #oci-mysql-heatwave-tutorial #oci-subnets #offline-pwa #operations-checklist #oracle base database service tutorial #oracle cloud bastion #oracle cloud free tier tutorial #oracle cloud infrastructure step by step #oracle cloud infrastructure tutorial #oracle cloud storage #oracle database on oci setup #oracle-cloud #oracle-cloud-mysql-database-service #oracle-cloud-mysql-setup #oracle-cloud-vcn-setup #patch-management #path-mtu-discovery #Performance #Performance Degradation #performance monitoring #performance trend monitoring #performance trends #plan disk growth server #plesk #practical server monitoring #predict disk usage growth #private instance access #proxmox #query optimization #query-trends #remote-workstation-security #rhel-tuned #rollback #route-tables #rsyslog #Security #security lists #security-monitoring #selinux #server #server health #server health reporting #server health weekly report #server monitoring #Server Performance #server trend analysis #server-audit #server-checklist #server-hardening #server-health-checklist #server-security #server-security-checklist #server-throughput #server-trends #server-troubleshooting #servers #service-worker #siem #simple cpu monitoring linux #simple linux monitoring #simple monitoring small business #simple monitoring system #simple ops monitoring #slow queries #slow query reporting mysql #small business infrastructure #small business IT #small business servers #small infrastructure monitoring #small server monitoring #small-business-security #small-business-tech #source-built-linux #ssh bastion #ssh-security #storage capacity planning linux #storage monitoring #subnets #sysadmin-checklist #sysadmin-lab #System Health #system health reporting #systemd #tcp-mtu-probing #tcp-tuning #terraform oci compute #terraform oracle cloud infrastructure #track-disk-growth-linux #Trend Monitoring #trend-analysis #trends #tuned-adm #Tutorial #uptime-checks #uptime-monitoring #vcn #vcn-design #vector #vsftpd #vulnerability-response #wazuh #weekly-server-report #windows-agent #xrdp