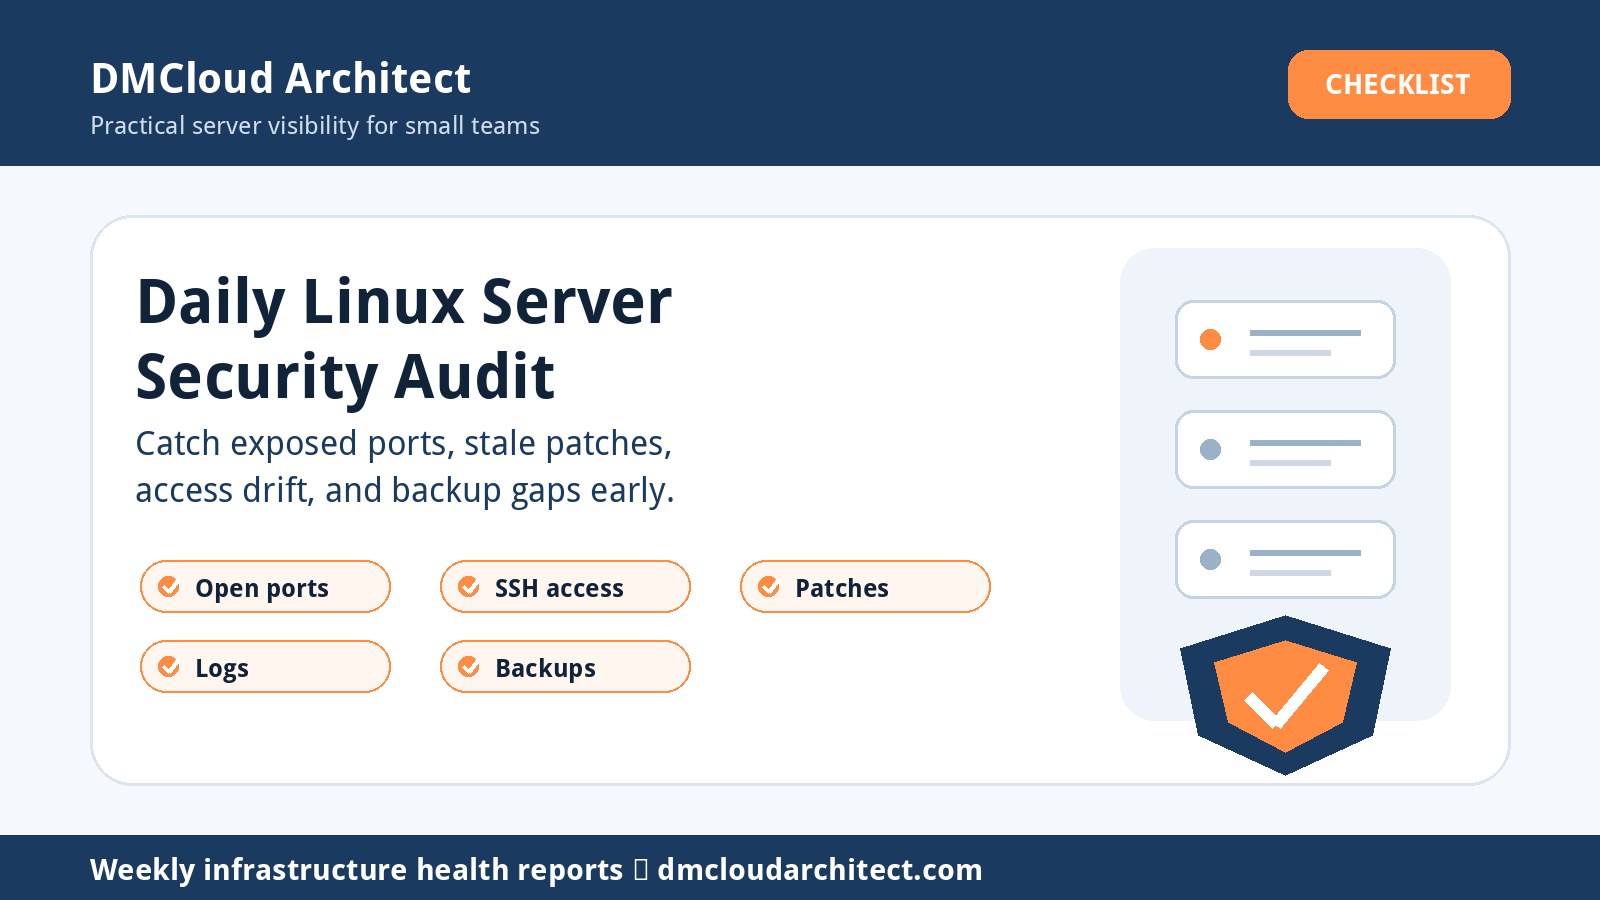
A daily security audit does not need to be a heavyweight compliance program. For developers and small business owners, the useful version is a short routine that answers one question every morning: did anything important change on this server while nobody was watching?
The safest approach combines quick external exposure checks, basic host checks, and lightweight linux server monitoring. External scans can catch ports and services you accidentally exposed. Host-level checks catch patch age, disk pressure, failed logins, backup freshness, and service drift that a port scan alone will never see.
What a daily security audit should catch
Start with risks that are common, visible, and actionable. A small team usually gets more value from consistent checks for exposed ports, stale packages, weak SSH settings, and backup failures than from an impressive report nobody reads.
Your daily audit should flag changes, not just produce a long list of facts. The most useful alert is often simple: port 3306 became public, the web server version changed, a new sudo user appeared, disk usage crossed a threshold, or yesterday's backup did not complete.
1. Record the expected baseline first
Before automating anything, write down what should be true. List each server's purpose, public IP, operating system, expected open ports, owner, admin access method, critical services, backup schedule, and patch window.
This baseline keeps daily scans from becoming noise. If ports 22, 80, and 443 are expected, then a new database, Redis, dashboard, or development server port is worth attention immediately.
2. Check public exposure from the outside
An external scan is useful because it sees the server the way the internet sees it. Run a lightweight scan against the server's public address and compare today's open ports and service banners with yesterday's result.
Keep this narrow and responsible. Scan only assets you own or administer, avoid aggressive timing, and treat results as a prompt for investigation rather than proof of compromise. For most small environments, a daily top-port check plus a weekly deeper review is enough.
3. Review SSH and administrative access
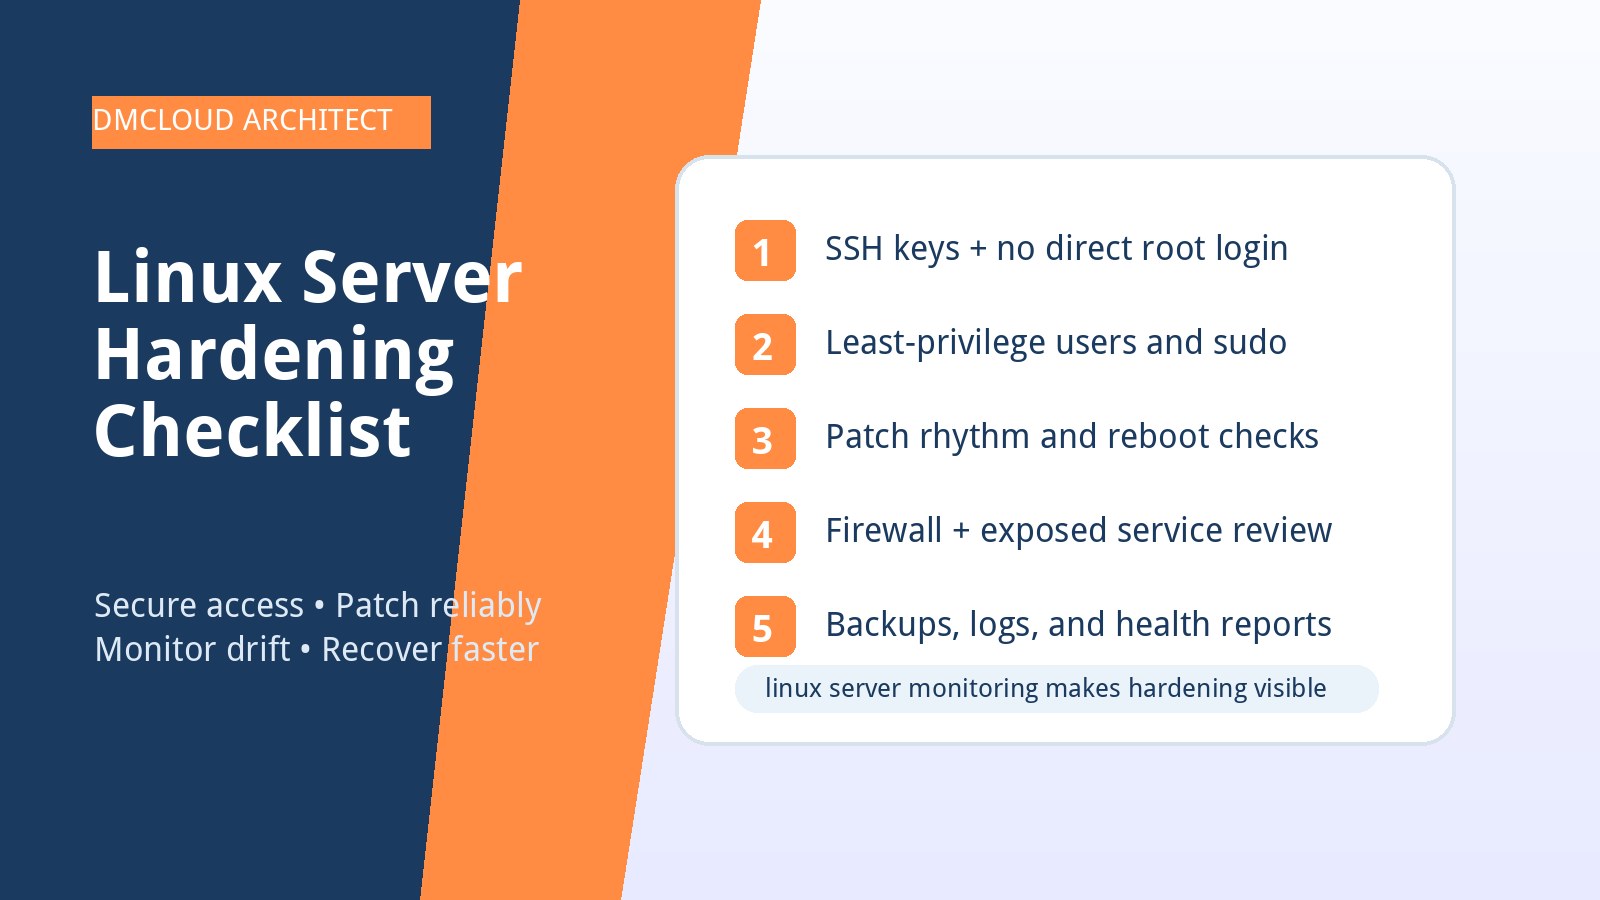
SSH deserves daily visibility because it is commonly exposed and frequently attacked. Confirm that password login remains disabled where possible, root login is off, administrative users are expected, and any source IP allowlist still matches the business need.
Also review failed login volume. A few background attempts are normal on internet-facing servers, but sudden spikes, successful logins from unusual locations, or repeated failures against real usernames should be investigated.
4. Track patches and reboot requirements
A server can look quiet while quietly falling behind on security updates. Your audit should report available security updates, the date of the last package update, and whether a reboot is required for kernel or core library fixes to take effect.
For small teams, the goal is not to patch blindly every morning. The goal is to make patch status visible so routine updates happen on schedule and urgent fixes do not depend on someone remembering to check manually.
5. Compare listening services with firewall rules
Check both sides of exposure: what the host is listening on and what the cloud firewall, security group, or host firewall allows. A service bound to all interfaces may not be public today, but it becomes dangerous if a firewall rule changes later.
Pay special attention to databases, admin panels, metrics endpoints, container dashboards, mail services, and development tools. These are often intended for private access but accidentally become reachable during troubleshooting or migrations.
6. Watch logs for security-relevant changes
Daily log review should focus on signals that lead to action: successful SSH logins, new sudo activity, user and group changes, service restarts, package installs, web server errors, firewall drops, and authentication failures.
You do not need a full SIEM to start. A simple report that highlights unusual activity from the last 24 hours is enough to catch many mistakes and early warning signs.
7. Include health signals that affect security
Security and reliability overlap. Full disks can stop logging, memory pressure can crash services, expired certificates can trigger emergency changes, and failed backups can turn a small incident into a business problem.
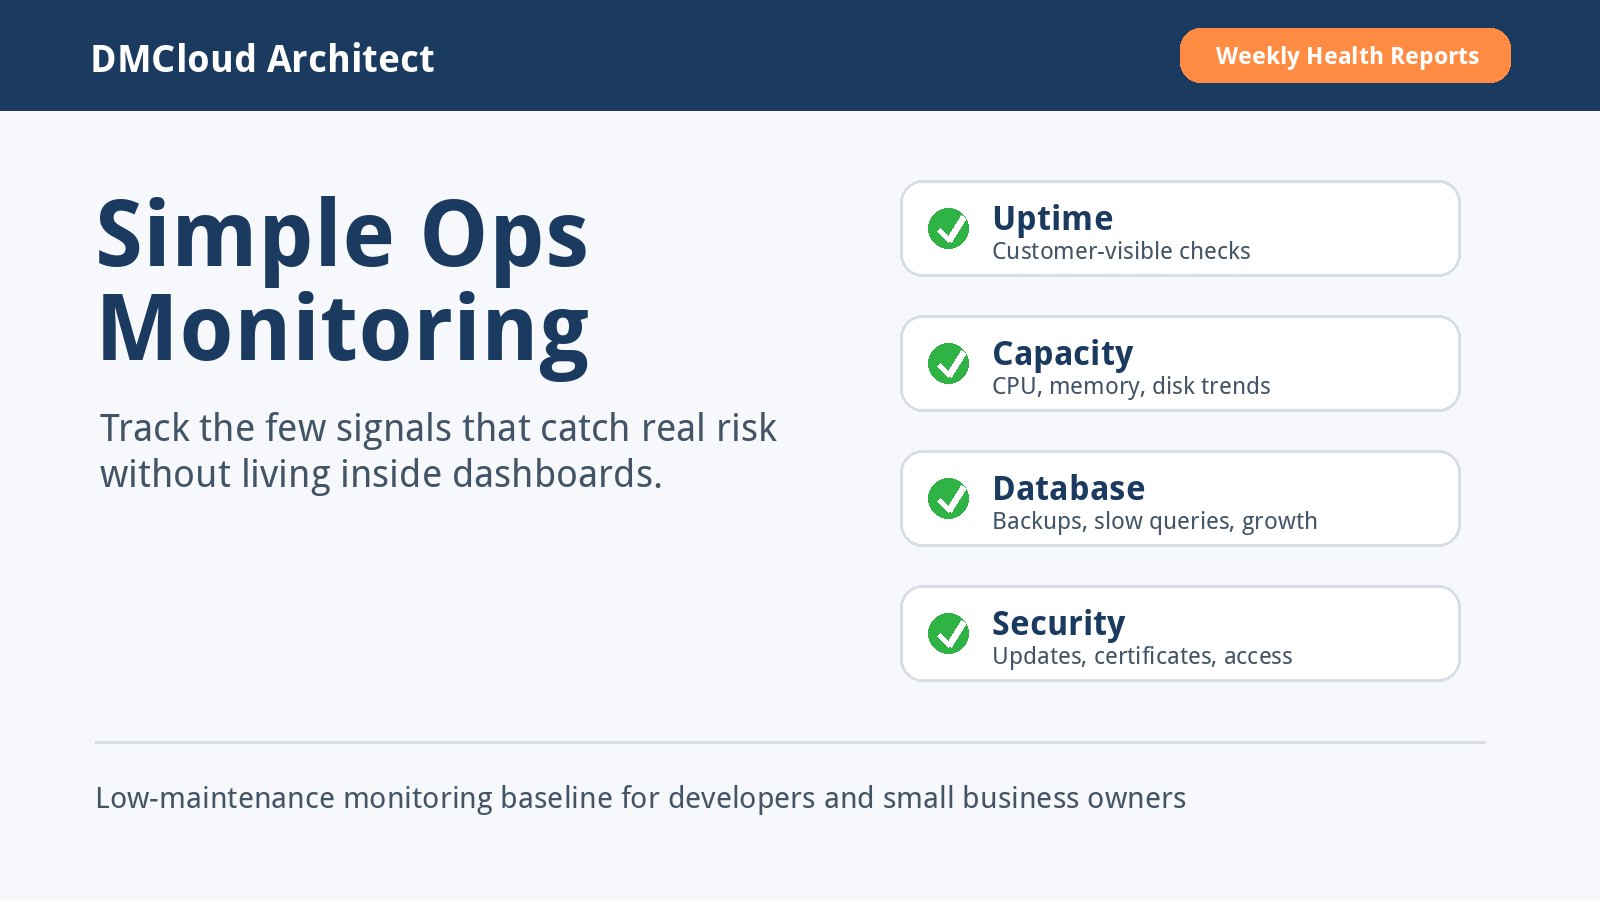
This is where linux server monitoring complements security scans. Track CPU load, memory, disk, inode usage, certificate expiration, uptime, service status, backup freshness, and unexpected process changes in the same operational review.
8. Decide what should run daily versus weekly
Daily checks should be fast, low-noise, and safe to automate. Use them for public exposure, SSH activity, update status, critical services, logs, disk, certificates, and backups. Weekly checks can go deeper into package cleanup, hardening review, firewall exceptions, dependency updates, and documentation drift.
This split prevents alert fatigue. A daily audit should tell you whether anything changed overnight. A weekly report should help you improve the baseline and plan maintenance before users feel pain.
Practical daily audit checklist
- Confirm expected public ports and investigate any new exposure.
- Compare service banners or versions against yesterday's result.
- Review SSH login success, failed login spikes, and admin user changes.
- Check available security updates and reboot requirements.
- Verify host firewall and cloud firewall rules still match the baseline.
- Look for service restarts, package installs, sudo activity, and authentication errors.
- Track disk usage, inode usage, load, memory pressure, uptime, and certificate expiration.
- Confirm backups ran and at least one recent restore path is known.
- Save yesterday's result so tomorrow can alert on meaningful differences.
A simple reporting rhythm for small teams
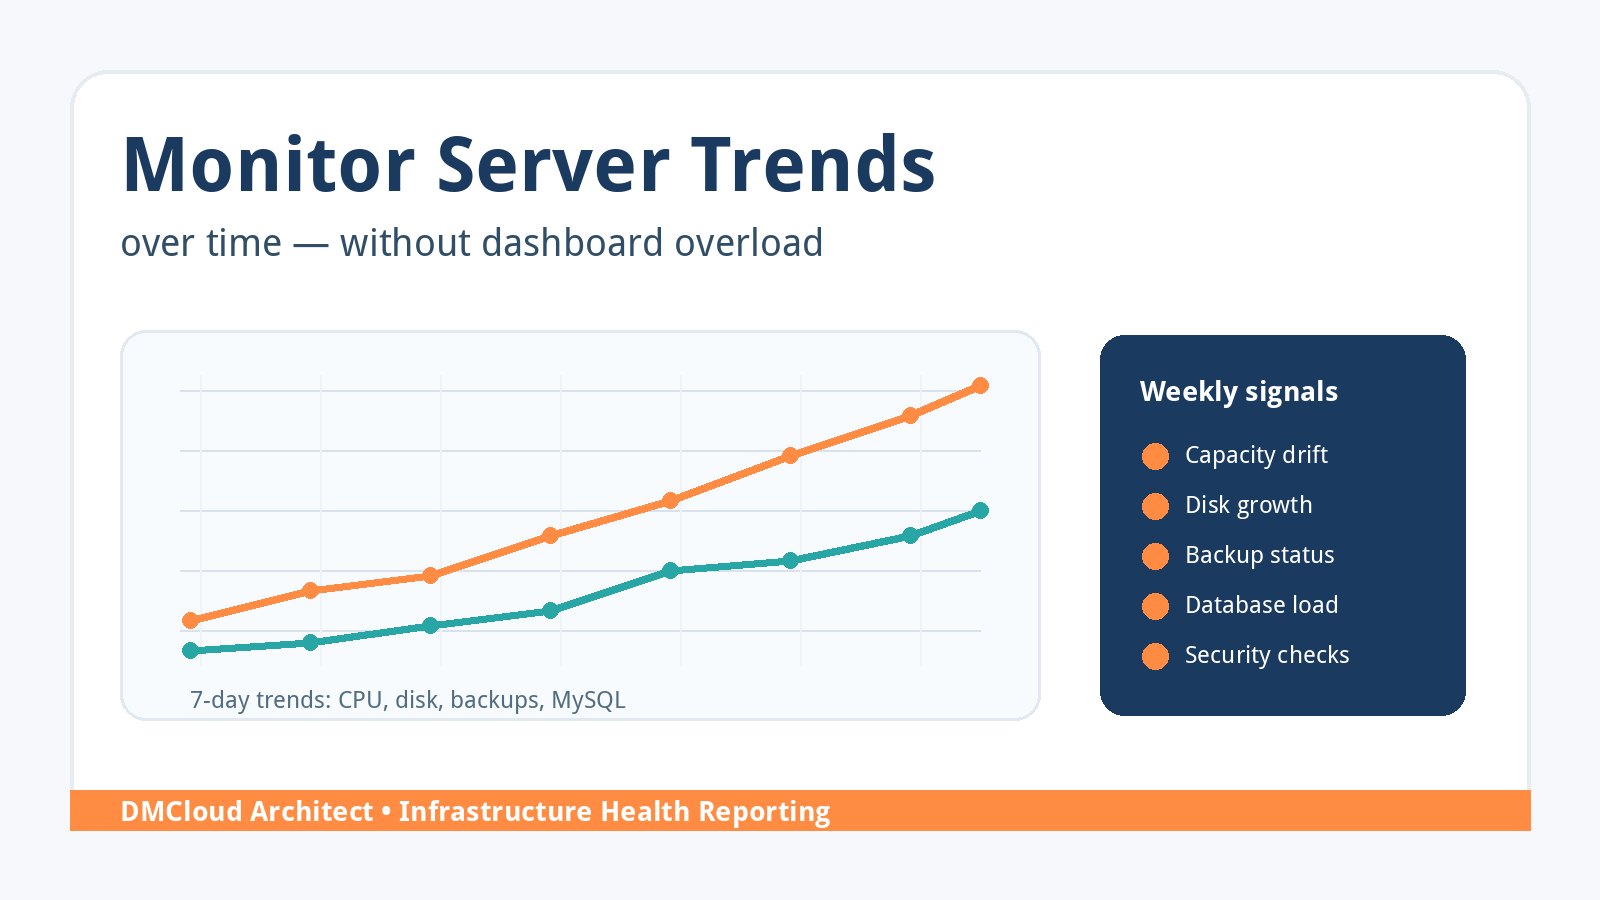
If you are starting from scratch, begin with a daily change report and a weekly summary. The daily report should be short enough to read in under two minutes. The weekly summary can show trends, recurring issues, and recommendations for maintenance.
That rhythm is often more sustainable than another live dashboard. Dashboards are useful during incidents, but small teams need clear summaries that surface drift before it becomes urgent.
What to do next
Pick one production server and document its expected ports, access path, update rhythm, and backup schedule. Then add a daily check that compares actual exposure and host health against that baseline.
Once the first server is working, repeat the pattern for the rest of your environment. Consistency matters more than complexity.
Want weekly infrastructure health checks without dashboard fatigue?
DMCloud Architect sends Linux and MySQL infrastructure health reports directly to your inbox, so you can spot risks early without adding another monitoring dashboard to watch.
Get the free starter plan for weekly infrastructure health reports.