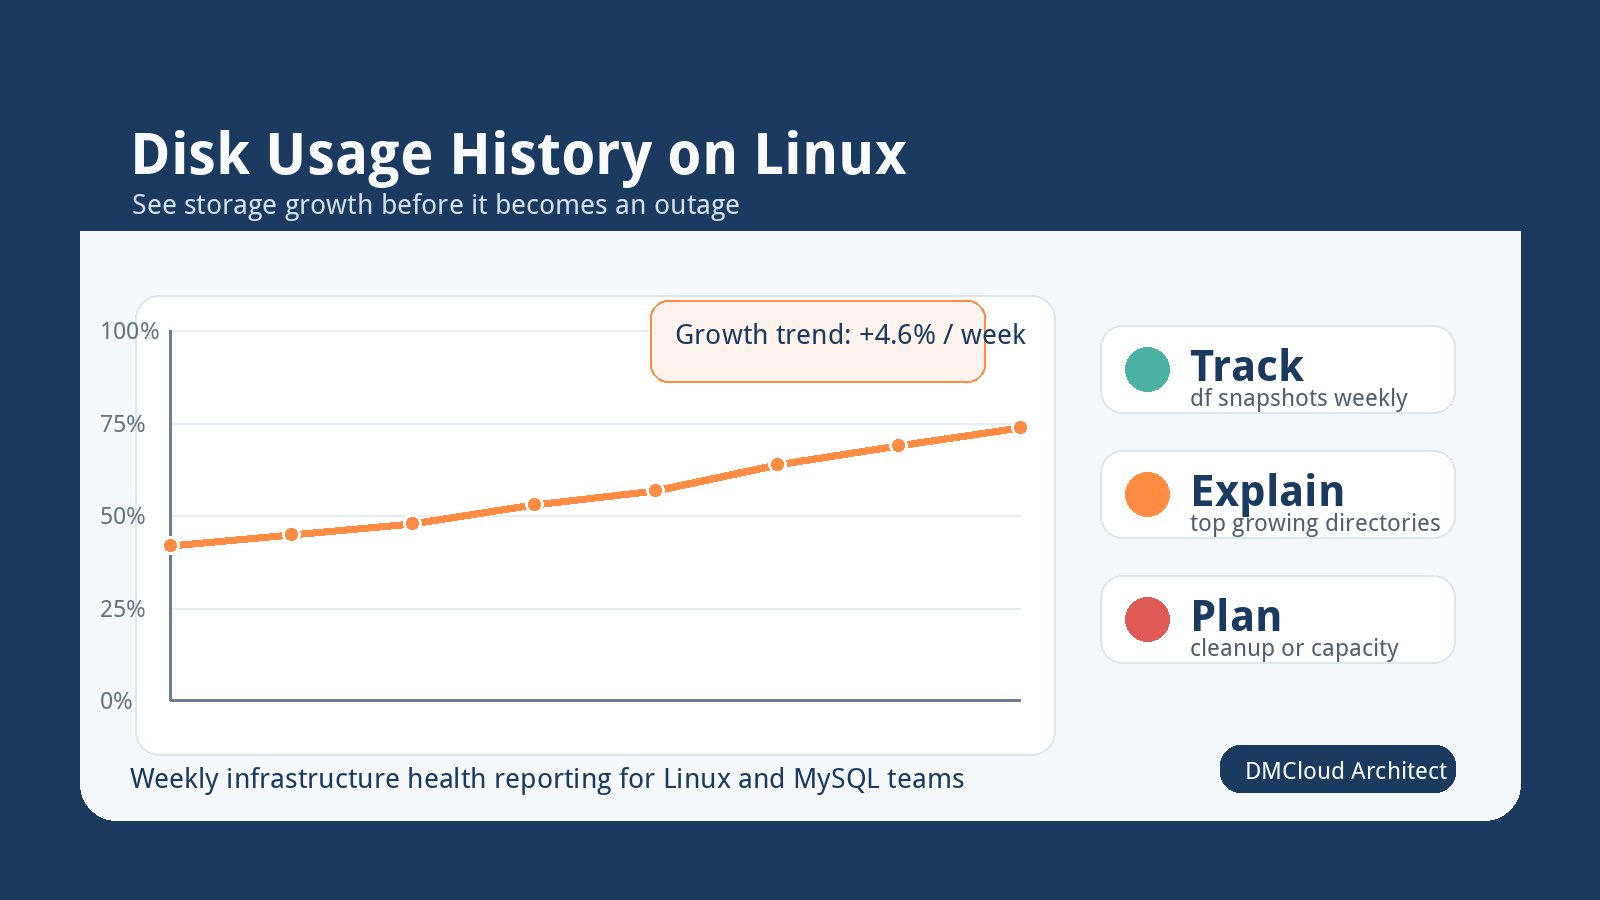
Disk usage history on Linux is one of those simple operational habits that pays off long before a server runs out of space. A single df -h check tells you what is full right now, but it does not explain whether a filesystem is growing slowly, accelerating every week, or spiking because of one backup job. For developers and small business owners who manage lean infrastructure, that difference matters.
The goal is not to build a heavy monitoring platform just to answer a storage question. The practical goal is to keep enough history to spot disk usage trends on a Linux server, understand which paths are responsible, and make cleanup or capacity decisions before customers notice a problem.
Why disk usage history matters
Most disk incidents are predictable in hindsight. Log files grew faster after a new feature shipped. A database table expanded when reporting volume increased. Backups started keeping too many copies. A temporary export directory stopped being temporary.
Without history, every full-disk alert feels urgent and isolated. With history, you can see whether a mount point has been growing by 2 GB per week for months, whether a sudden jump started on a specific date, or whether cleanup scripts are no longer keeping pace. That makes disk growth trend analysis much easier for small teams that do not have a dedicated operations department.
Start with the filesystem view
The simplest baseline is a scheduled capture of filesystem usage. On most Linux servers, the useful starting point is:
df -h
For history, save a machine-readable version too:
df -P | awk 'NR>1 {print strftime("%Y-%m-%d"), $6, $2, $3, $4, $5}'
This records the date, mount point, total blocks, used blocks, available blocks, and percent used. If you store that output daily or weekly, you can quickly compare /, /var, /home, database volumes, backup mounts, and application data volumes over time.
For a very small environment, a weekly snapshot may be enough. For busier production systems, daily snapshots give you better visibility into weekend jobs, backup behavior, and release-related storage changes.
Track the directories that explain growth
Filesystem usage tells you where the pressure is happening. Directory-level checks tell you why. When a mount point grows, review the largest directories underneath it:
du -xhd1 /var | sort -h
The -x flag keeps the command on the same filesystem, which avoids accidentally walking into mounted backup or data volumes. Running this for the usual suspects gives you a practical disk usage history Linux teams can actually use:
/var/logfor application, web server, database, and system logs/var/lib/mysqlor another database data directory for MySQL growth- application upload directories for customer files and generated reports
- backup destinations for retained archives
- temporary export or cache directories that may not be cleaning up
You do not need to collect every directory every minute. A weekly top-level directory report is often enough to show whether log rotation, retention settings, or database growth are the real storage drivers.
Separate normal growth from risky growth
Not all disk growth is bad. A growing customer database may be healthy business activity. A growing backup directory may be expected after onboarding a new workload. The risk comes from growth that is unexplained, unbounded, or faster than your available capacity.
When reviewing disk space usage over time on a server, ask four questions:
- Which mount point is growing fastest? Prioritize filesystems that combine high percent used with fast weekly growth.
- Which directory explains the change? Avoid guessing based only on total disk usage.
- Is the growth tied to a known event? Releases, imports, backups, and new customers can all create legitimate changes.
- How many weeks remain at the current rate? A filesystem at 70% can still be urgent if it is adding 10% every week.
This is where historical context beats a one-time alert. A disk at 82% that has been stable for months may be less urgent than a disk at 61% that jumped from 38% after a new reporting job was enabled.
Build a lightweight weekly review
A useful disk review does not need to be complicated. For each important server, collect the current filesystem usage, compare it with the previous week, and note the top growth paths. Then summarize the result in plain language:
- Stable: No important mount point changed materially.
- Watch: One filesystem is growing, but there is still enough runway.
- Action needed: Cleanup, retention tuning, database maintenance, or capacity planning should be scheduled.
This kind of weekly rhythm helps small teams monitor disk growth on Linux without staring at dashboards every day. It also creates a paper trail for decisions: when you increased volume size, when you changed backup retention, and whether the change actually helped.
Common places disk growth hides
If a server is growing faster than expected, look beyond the obvious. Application logs may be duplicated between a framework log directory and the system journal. Failed background jobs may leave export files behind. Database binary logs may retain longer than intended. Container images, old releases, build artifacts, and package caches can quietly consume space.
For MySQL-heavy servers, compare database directory growth with query volume, import jobs, binary log retention, and backup behavior. For web applications, check uploaded files, generated PDFs, image transformations, and abandoned temporary directories. The best fix depends on the source of growth, not just the size of the filesystem.
When to alert and when to report
Alerts are useful when immediate action is required. Reports are better for slow-moving risk. Disk usage history works best when you use both: alert when a filesystem is near a hard threshold, and report when growth trends suggest a future problem.
For many small teams, a good baseline is:
- alert at a high usage threshold such as 85% or 90%, depending on workload risk;
- review weekly growth for important mount points;
- flag filesystems that will reach the alert threshold within the next few weeks;
- include the likely source directory so the next action is obvious.
That approach turns storage management from emergency cleanup into routine maintenance.
The practical takeaway
Tracking disk usage history on Linux is less about collecting perfect metrics and more about creating enough context to make calm decisions. Save regular filesystem snapshots, review the directories that explain growth, and look for trends before thresholds become outages. Once the pattern is visible, cleanup, retention changes, database maintenance, or capacity increases become planned work instead of stressful surprises.
Want weekly infrastructure health checks without dashboard fatigue?
DMCloud Architect sends Linux and MySQL infrastructure health reports directly to your inbox, so you can spot risks early without adding another monitoring dashboard to watch.
Get the free starter plan for weekly infrastructure health reports.