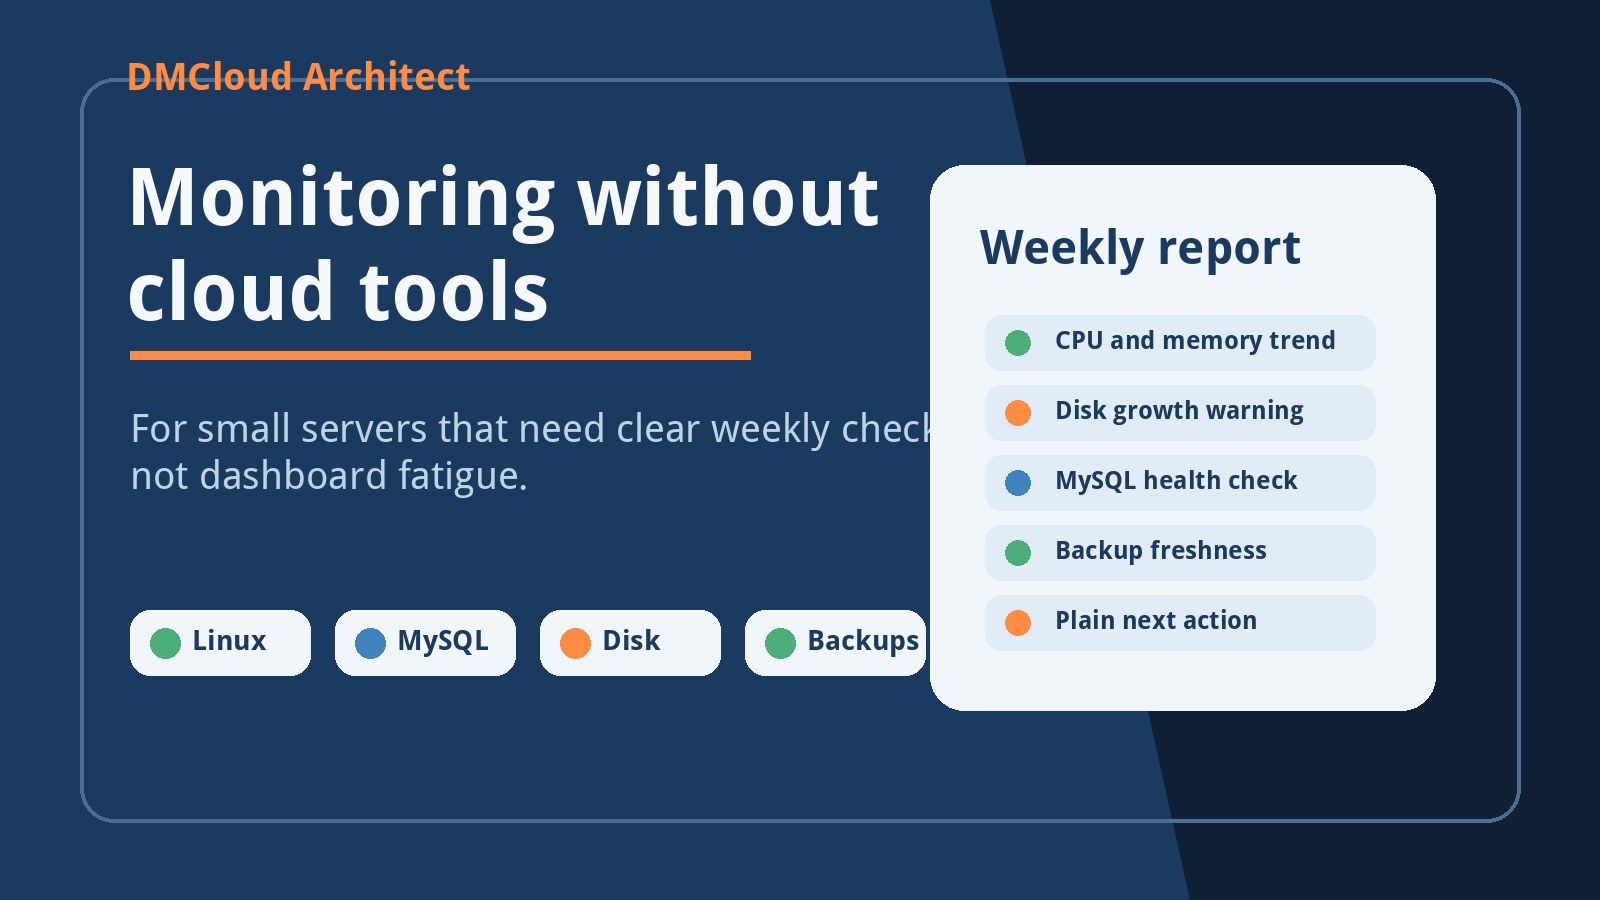
Many small production servers sit in an awkward middle ground. They are important enough that downtime hurts, but not large enough to justify a complex monitoring stack, a paid cloud observability platform, or a full-time operations person. That is where monitoring without cloud tools can be the right starting point.
The goal is not to avoid good tools forever. The goal is to create a lightweight routine that proves the server is healthy, highlights the parts that changed, and gives the owner or developer one clear next action. For a small business website, client portal, internal app, or MySQL-backed service, a short weekly report often creates more value than another dashboard nobody opens.
What monitoring without cloud tools should still prove
Lightweight does not mean casual. A small server monitoring routine should answer the same basic questions a larger platform would answer, just with less noise and less setup. Is the server reachable from the outside? Are CPU, memory, and disk trends stable? Is MySQL responding normally? Did backups run? Are there security or certificate issues that need attention?
If your checks cannot answer those questions, you do not have monitoring yet. You have scattered commands. The useful version turns command output into a repeatable record so this week can be compared with last week.
Start with availability from the user side
The first check should be simple: can the service be reached the way a user reaches it? A local process check can say that nginx, Apache, Node, PHP-FPM, or MySQL is running, but it does not prove the public website or application path works.
- Check the public URL over HTTPS and record the HTTP status.
- Confirm the response is not a generic error page, maintenance page, or redirect loop.
- Measure response time at a practical level, even if it is only a basic curl timing.
- Check certificate expiry before it becomes an emergency.
For a small business, this is often the most important signal. If the page users need is reachable, secure, and reasonably fast, the rest of the report can focus on prevention instead of panic.
Review Linux resource trends, not just current numbers
A single CPU or memory number rarely tells the full story. A small production server may look fine today while slowly drifting toward trouble. Weekly checks should record the trend: load average, memory pressure, swap use, disk free space, inode use, and the services consuming the most resources.
Look for changes rather than perfection. A higher load average after a new plugin, more swap after a scheduled import, or a steady disk decline from logs and backups is worth noticing early. This is where small infrastructure monitoring becomes practical: the report does not need every metric, but it should preserve enough history to make drift visible.
Make disk growth a first-class check
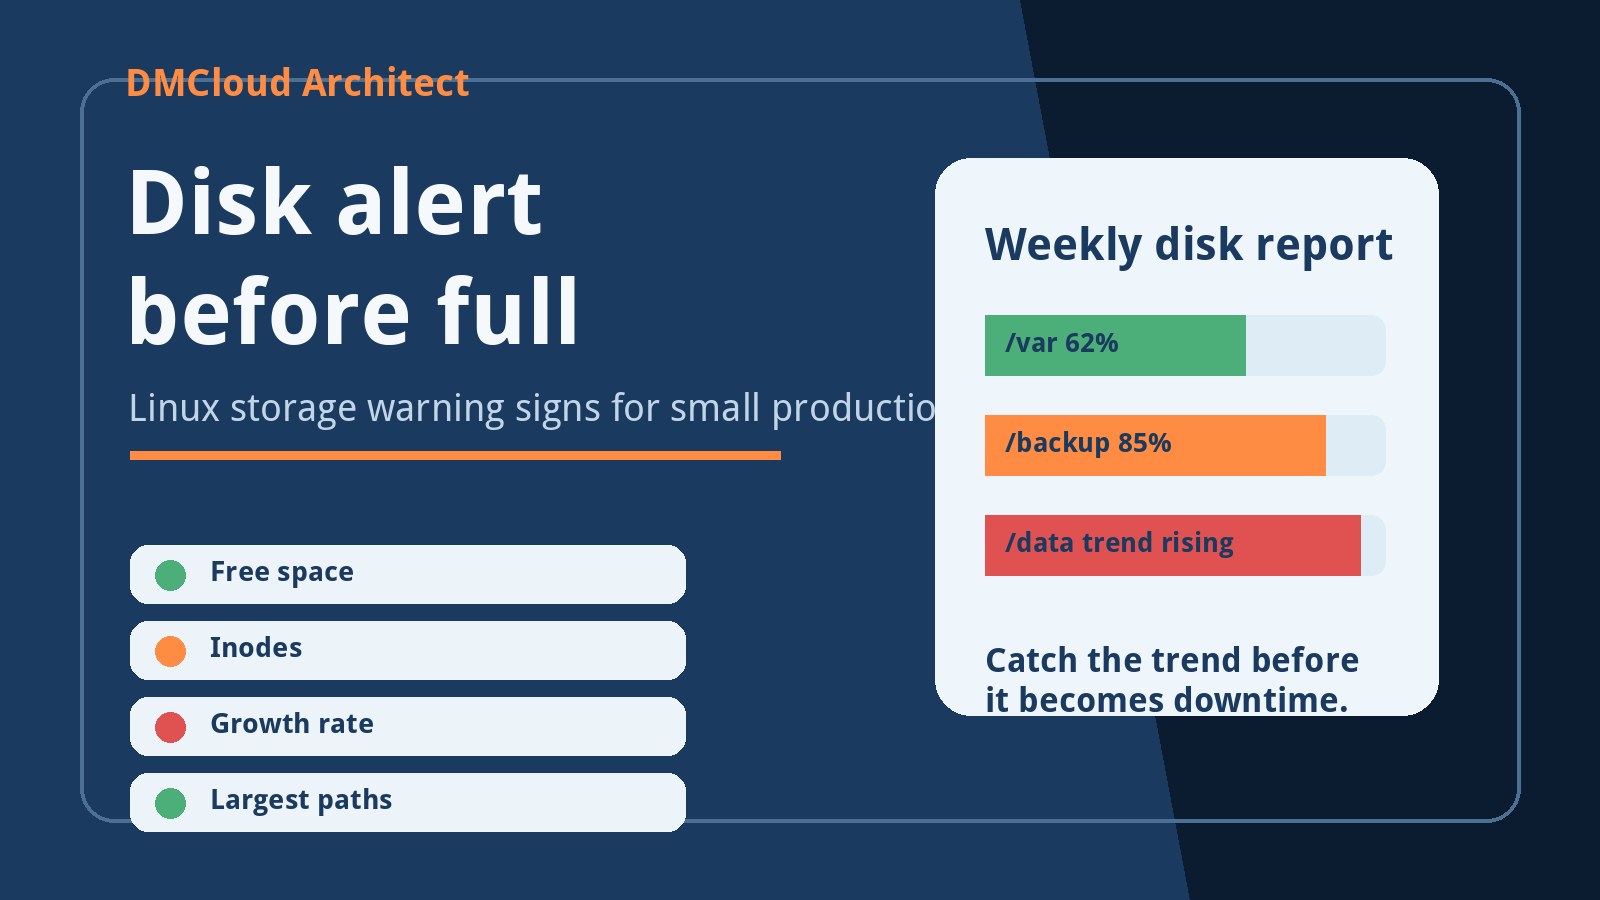
Disk problems are one of the easiest failures to prevent and one of the most disruptive when ignored. A full disk can break uploads, database writes, logs, sessions, package updates, and backups. It can also make recovery messier because the server may not have enough space to rotate files or restart cleanly.
- Record filesystem usage for every mounted volume that matters.
- Check inode usage, especially on servers with many cache or session files.
- List the fastest-growing directories under logs, backups, uploads, and database storage.
- Confirm backup retention is intentional and not filling the same disk it protects.
A lightweight monitoring solution should flag both the current free space and the weekly rate of change. Ten percent free space might be acceptable on a quiet server, but risky if the server is losing several gigabytes every week.
Include MySQL health if the application depends on it
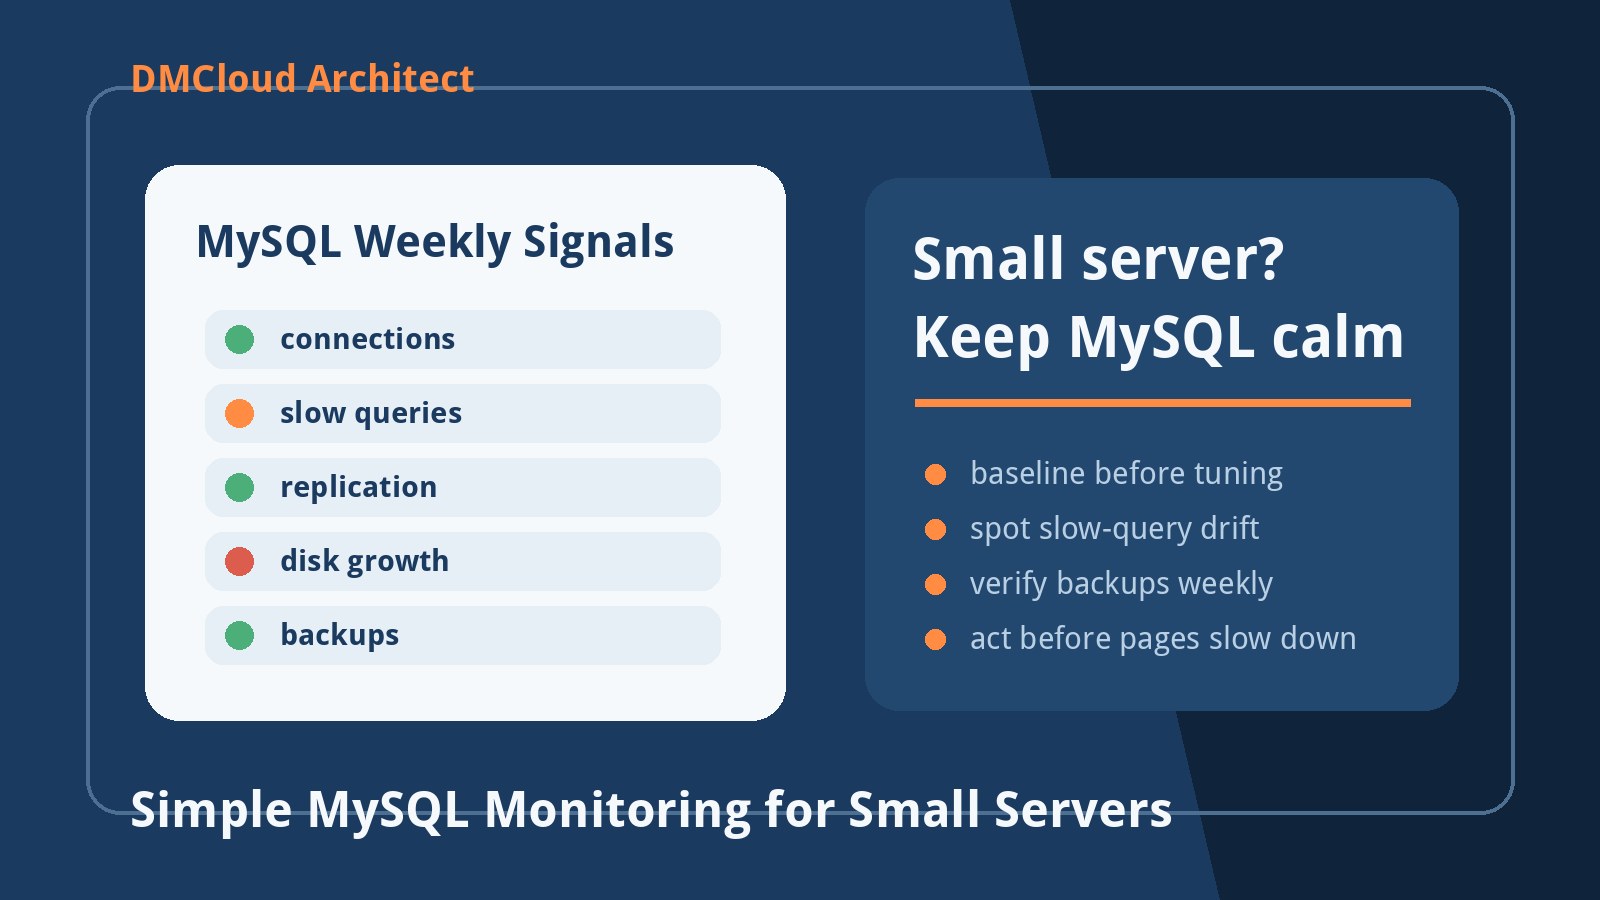
For many small applications, MySQL is the real heart of the system. The web server may be online, but the business still has a problem if database connections are exhausted, queries are slowing down, or backups are stale.
A useful weekly MySQL check can stay focused:
- Connection count, max used connections, aborted connections, and connection errors.
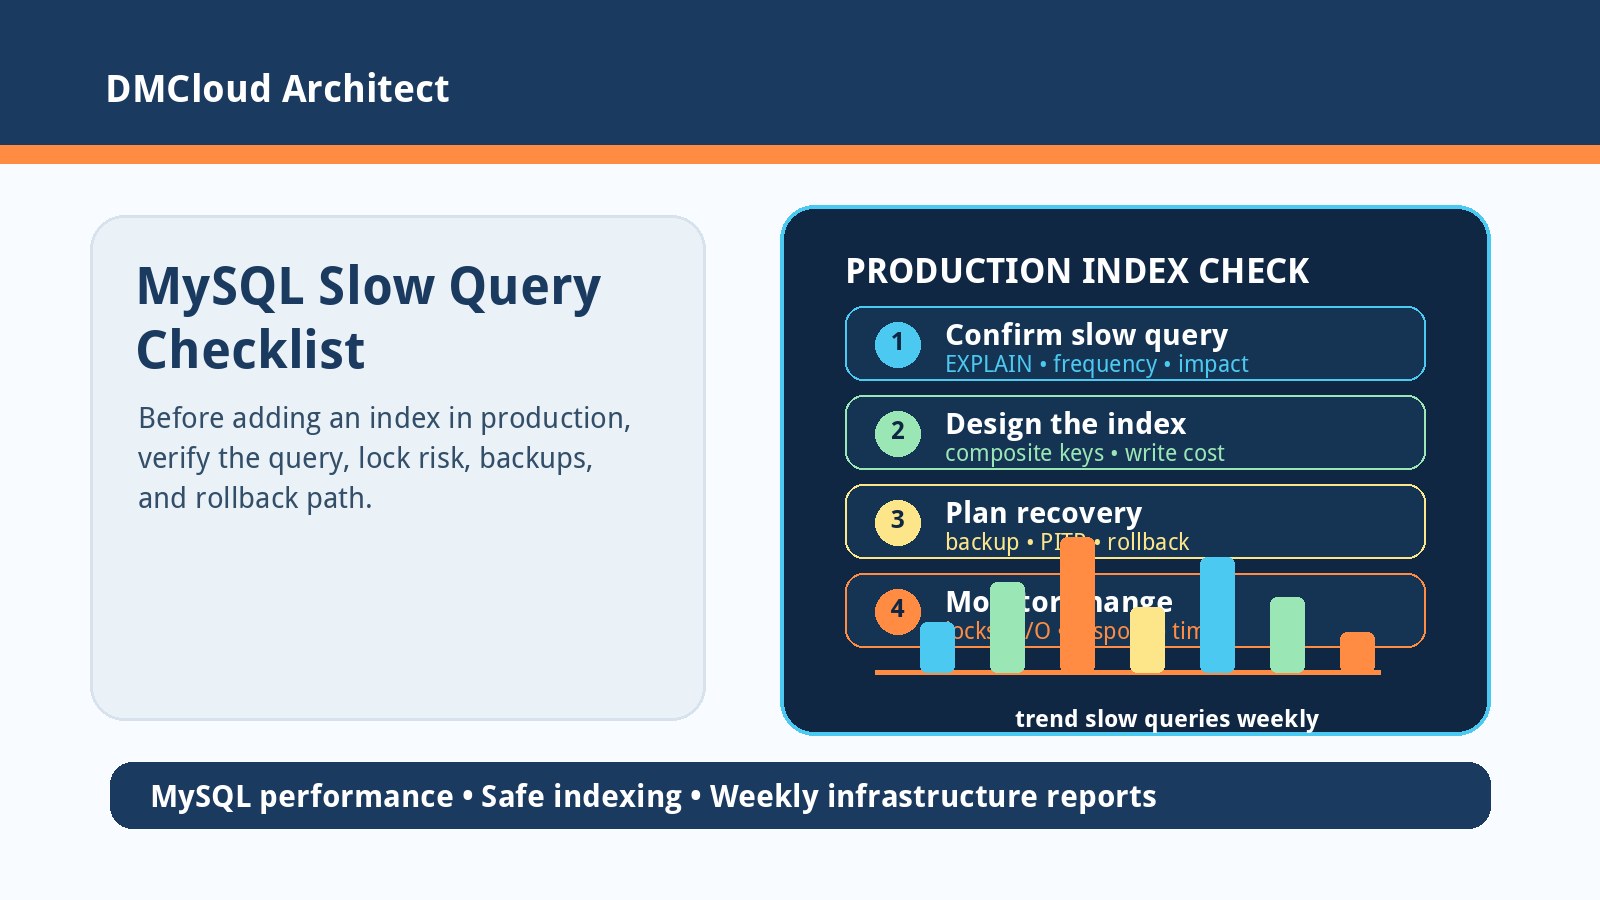
- Slow query count and the top repeated slow queries.
- Database size, largest tables, and table growth.
- Replication status if a replica exists.
- Backup completion time, backup size, and restore-test confidence.
This is enough to monitor a small production server without turning the owner into a database administrator. The report should translate database signals into plain language: healthy, watch this trend, or take this maintenance step.
Check logs for repeated errors
Logs are useful when they are summarized. They are exhausting when someone has to read them line by line. A weekly routine should scan the relevant application, web server, system, and database logs for repeated errors, new error types, failed jobs, authentication noise, and warnings that increased since the previous report.
The important part is grouping. Ten identical warnings usually need one explanation, not ten copied log lines. A concise summary helps a developer decide whether the error is harmless, caused by a recent change, or connected to a customer-facing issue.
Do basic security hygiene checks
Monitoring without cloud tools should still include simple security signals. You do not need a full security platform to notice expired certificates, failed login spikes, unexpected listening ports, pending security updates, disabled firewall rules, or a backup location that is too exposed.
- Record pending package and security updates.
- Check open ports against what the server is supposed to expose.
- Review failed SSH or admin login patterns.
- Confirm TLS certificates are valid and renewed early.
- Verify key services are enabled to start after reboot.
For small teams, these checks are less about blame and more about keeping easy-to-prevent failures out of the calendar.
Keep the report short enough to act on
The common mistake with simple monitoring for small business systems is collecting too much raw output. A useful weekly report should be shorter than the command logs behind it. It should show the health status, changed signals, risks, and next action.
A practical format is:
- Status: healthy, watch, or action needed.
- What changed: disk, CPU, memory, MySQL, logs, backups, or security.
- Why it matters: the likely business or application impact.
- Recommended action: one clear maintenance step.
This gives a developer enough detail to investigate and gives a business owner enough context to understand the risk.
A weekly checklist you can use
If you want to start monitoring without cloud tools, use this weekly checklist as a baseline:
- Public HTTP/HTTPS availability and certificate expiry.
- Load average, memory pressure, swap use, and top resource consumers.
- Disk free space, inode use, and fastest-growing directories.
- MySQL connections, slow queries, table growth, and backup status.
- Application, web server, system, and database log summaries.
- Pending updates, unexpected open ports, and failed login patterns.
- One recommended action for anything marked watch or action needed.
That checklist is intentionally small. It creates a routine that is easy to repeat and easy to read, which matters more than collecting hundreds of metrics that never turn into maintenance decisions.
When to move beyond lightweight checks
Simple monitoring is a good fit when the environment is small, stable, and owned by a team that wants clear preventive maintenance. It may not be enough if the application has strict uptime commitments, multiple servers, heavy traffic, complex queues, container orchestration, or compliance requirements.
Even then, a weekly health report remains useful. Larger tools can tell you what happened minute by minute. A clear report can still tell you what changed, what matters, and what should be fixed before the next business week.
DMCloud Architect provides weekly Linux and MySQL infrastructure health reports for small teams that want early warnings without dashboard fatigue. If you want a practical outside review of your server health, start with the Infrastructure Health Reporting page.