CPU Usage Trends in Linux: Why Gradual Growth Breaks Performance
Most CPU issues don’t start as incidents.
They start as trends.
Slow, almost invisible increases in CPU usage that build over days or weeks — until one day your system feels slow, unstable, or overloaded.
This is why cpu usage trends linux matter more than real-time spikes.
You don’t need more alerts.
You need better visibility over time.
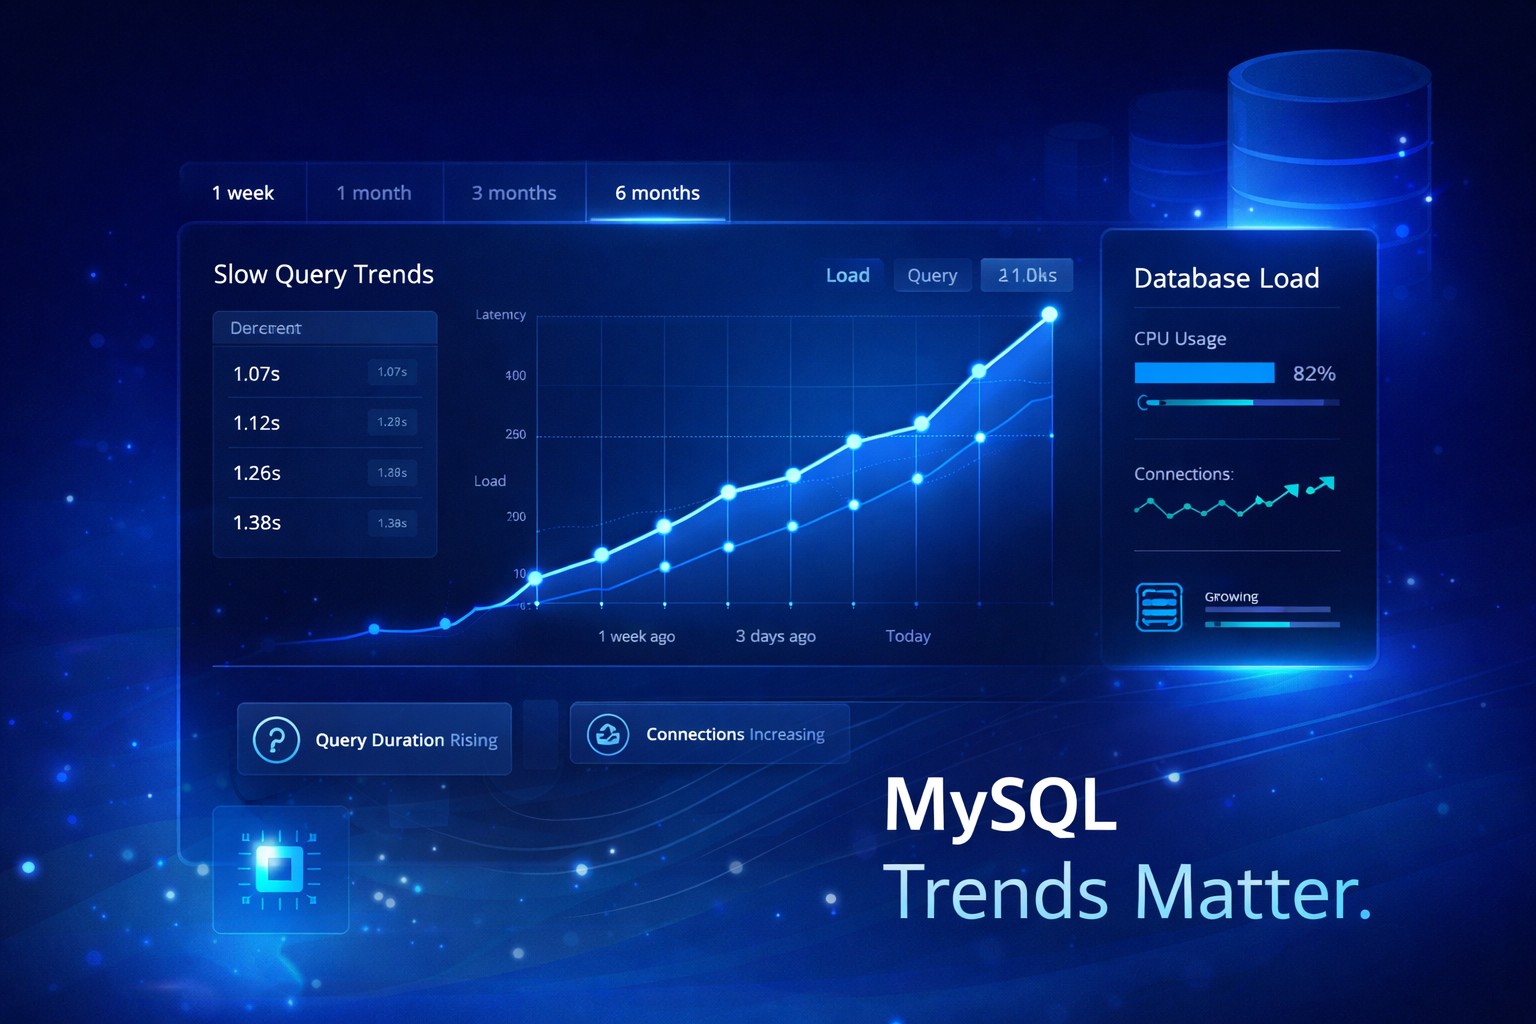
The Problem with Snapshot-Based CPU Monitoring
Traditional monitoring focuses on moments:
- CPU at 85%
- CPU spike alert
- Load average threshold exceeded
But snapshots miss the real story.
A server running at 40% CPU today might seem healthy.
But what if it was running at 10% last month?
That’s a 4x increase — and no alert will tell you that.
This is where most teams fail.
They react to spikes instead of understanding trends.
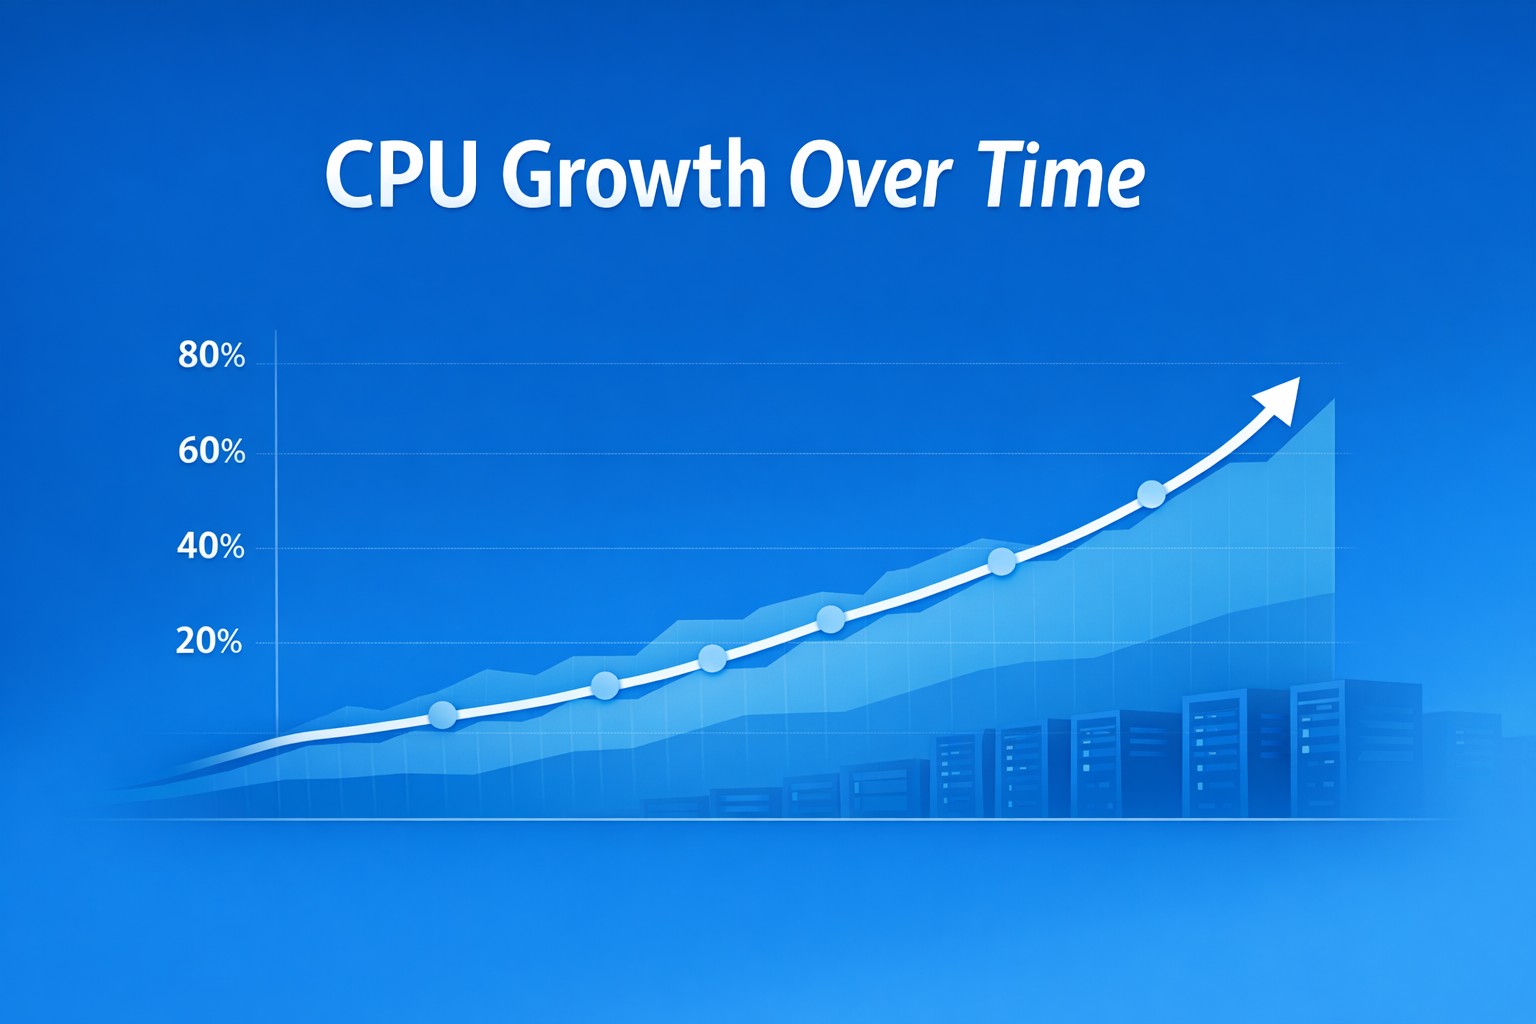
How CPU Usage Actually Degrades Over Time
CPU performance degradation in Linux is rarely sudden.
It typically follows a pattern:
- Small increases in baseline CPU usage
- Gradual growth in background processes
- More frequent peaks during normal workload
- Reduced headroom for traffic spikes
Common causes include:
- Unoptimized application logic
- Cron jobs accumulating over time
- Inefficient queries or loops
- Kernel or system-level overhead growth
Individually, these changes are harmless.
Together, they slowly consume your CPU capacity.
Why Trend Visibility Changes Everything
When you monitor CPU usage over time in Linux, patterns become obvious:
- Baseline CPU creeping up week by week
- Peak usage becoming more frequent
- Recovery time after spikes increasing
This is infrastructure health reporting.
Instead of reacting to alerts, you see:
- Where capacity is being consumed
- When degradation started
- How fast it's progressing
This allows action before failure.
What to Track for CPU Health Reporting
To properly track cpu utilization linux server, focus on trends — not instant values:
- Daily average CPU usage
- Weekly growth percentage
- Peak frequency over time
- Idle vs user vs system CPU ratios
These metrics reveal gradual degradation patterns that snapshots hide.
Early Detection: The Real Advantage
When you detect CPU issues early in Linux, you gain time.
Time to:
- Optimize workloads
- Fix inefficient processes
- Scale infrastructure properly
Without urgency.
Without downtime.
Without firefighting.
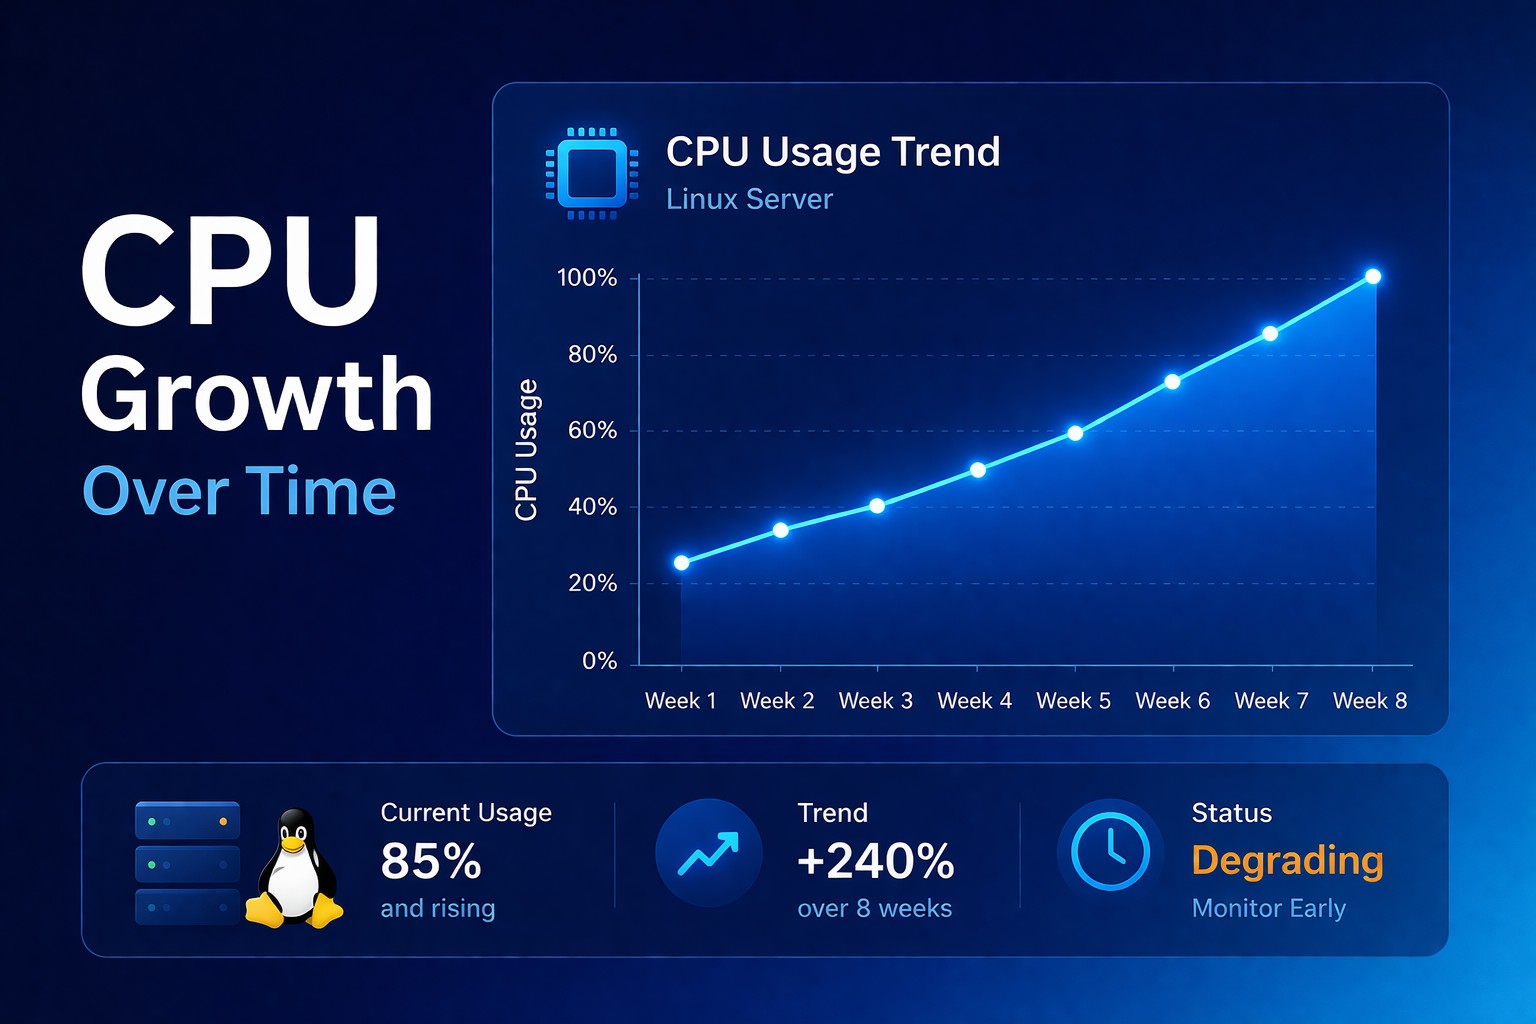
Real-World Example
A Linux server starts at:
- CPU baseline: 15%
Over 30 days:
- Baseline increases to 35%
- Peaks hit 70% more frequently
No alerts triggered.
But the system lost over 50% of its available headroom.
One traffic spike later — performance collapses.
This could have been prevented by simply watching the trend.
Why Alerts Are Not Enough
Alerts answer one question:
“What is happening right now?”
Health reporting answers a better one:
“What has been happening over time?”
Start Tracking CPU Trends Today
If you want to understand your infrastructure, stop chasing spikes.
Start tracking trends.
CPU problems don’t appear overnight.
They build slowly — and predictably.
Take Action
Explore how to implement infrastructure health reporting:
Related Topics
Supporting resources: