Back to Blog
CPU Usage Trends Linux: How Gradual Growth Leads to Performance Problems

CPU Usage Trends Linux: How Gradual Growth Leads to Performance Problems

      CPU Monitoring    2 min read    127 views

CPU Usage Trends Linux: How Gradual Growth Leads to Performance Problems

CPU problems in Linux servers rarely appear as sudden spikes. They build over time.

A system that used to run at 25% CPU starts averaging 35%. Then 45%. Then 60% during peak hours. Nothing looks broken in a single moment, but the server is clearly moving toward a problem.

This is where cpu usage trends linux becomes critical. You don’t need more real-time alerts. You need visibility into how CPU behavior is changing over time.

For teams running small or medium environments, this is often the missing piece. Without trend visibility, gradual CPU growth goes unnoticed until performance degradation becomes obvious.

The Problem: CPU Usage Grows Gradually

CPU performance degradation in Linux is usually a slow process.

New background jobs get added. Application logic becomes slightly less efficient. Traffic increases. Queries take longer. Each change adds a small amount of CPU load.

Individually, these changes are harmless. Together, they push CPU utilization higher over time.

This gradual growth leads to:

  • higher baseline CPU usage
  • longer response times under load
  • less headroom for traffic spikes
  • increased risk of saturation

The issue is not a spike. It is the trend.

Why This Gets Missed

Most teams rely on point-in-time checks.

They run top, check current CPU usage, and move on. If the system is at 40%, everything looks fine.

The problem is that 40% today might have been 20% two weeks ago.

Without historical context, it is impossible to see whether CPU usage is stable or steadily increasing.

What Health Reporting Shows

  • baseline CPU growth over time
  • peak usage pattern changes
  • correlation with workload changes
  • efficiency degradation signals
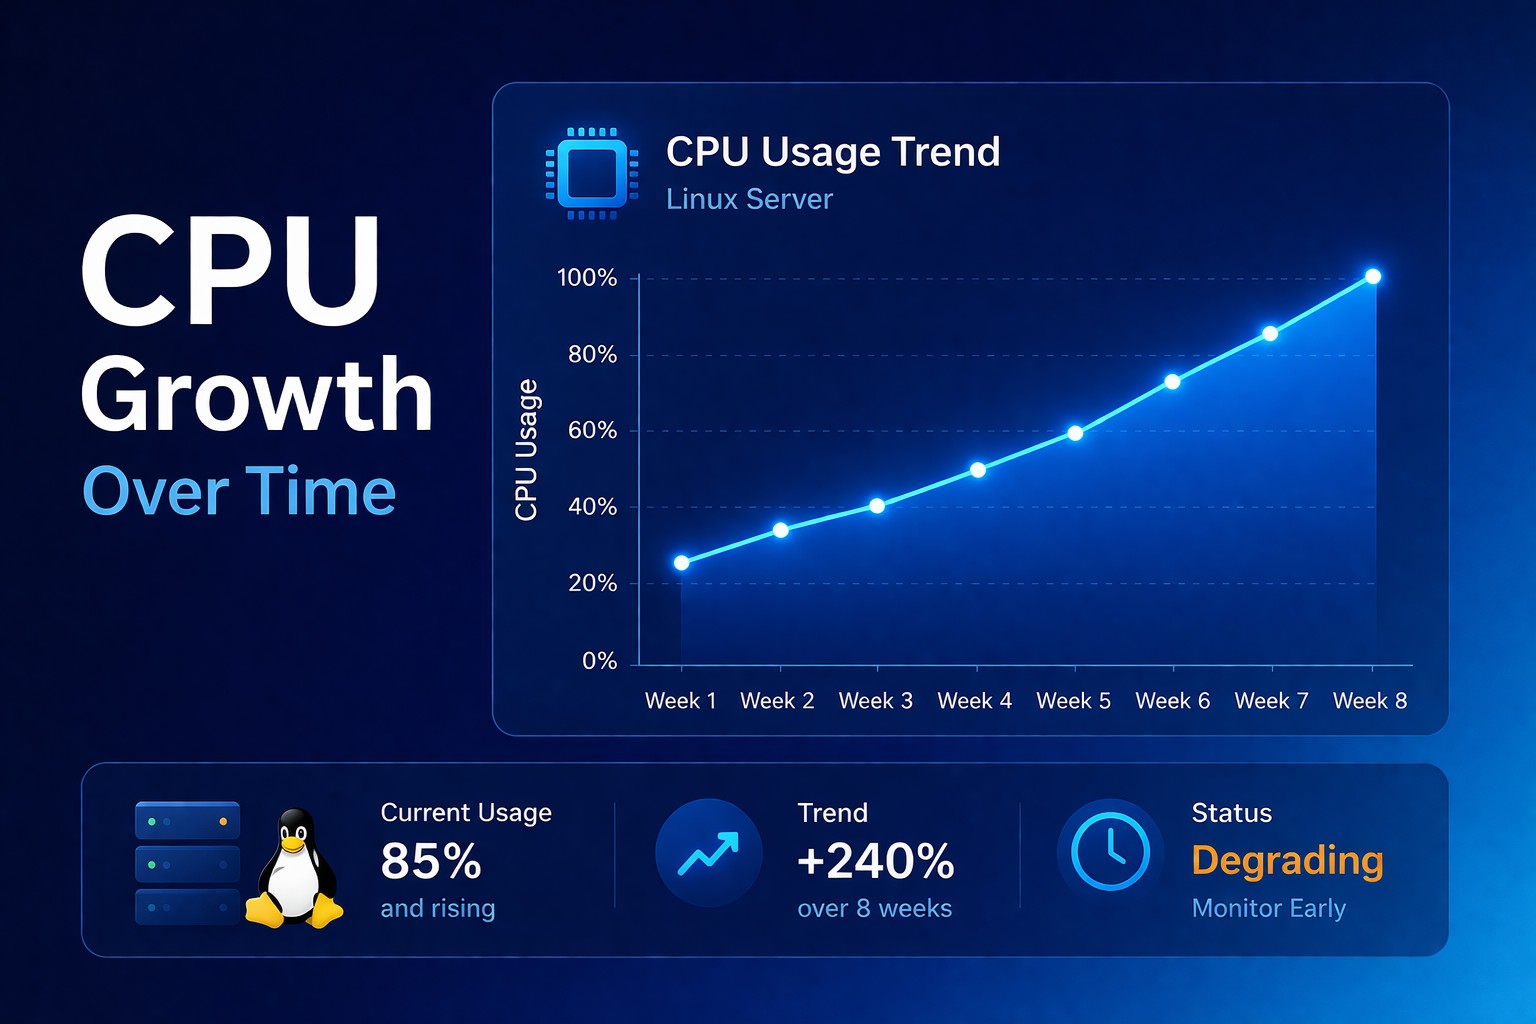
Practical Example

Week 1: CPU at 25%

Week 2: CPU at 35%

Week 3: CPU at 45%

Week 4: CPU peaks at 70%

Week 5: CPU hits 95% and users feel it

The failure looks sudden, but the trend was clear.

Best Practices

  • track CPU usage over time
  • focus on baseline growth
  • correlate with workload
  • keep reporting simple

Common Mistakes

  • only checking current CPU
  • ignoring gradual increases
  • focusing only on spikes

Summary

CPU issues rarely spike suddenly. They build over time.

If you rely on snapshots, you react late. If you track trends, you act early.

Most infrastructure issues build gradually over time. Infrastructure health reporting helps you detect those changes early, and DMCloudArchitect Health gives you a simple way to start tracking real CPU trends without complex monitoring tools.

About the Author

Oracle Cloud Infrastructure expert and consultant specializing in database management and automation.

All Tags
#Advanced #alerts #Bash #bash cpu monitoring script #bash monitoring #bash scripting #Beginner #Best Practices #block volume backup #Capacity Planning #cloud backup strategy #cpu bottleneck #CPU Monitoring #cpu monitoring linux #cpu monitoring script linux #cpu trends #cpu usage trends #cpu usage trends linux #create oracle db system in oci #cron cpu monitoring #cron cpu monitoring linux #cron jobs #database monitoring #database performance #detect slow queries mysql #devops #disk capacity planning server #disk forecasting linux #disk growth trend linux #Disk Monitoring #disk usage #disk usage script linux #disk usage trends #Early Detection #easy infrastructure monitoring #free-tier #Guide #health dashboards #Health Reporting #historical server monitoring #how to monitor cpu usage linux #infrastructure #infrastructure health #infrastructure health dashboard #infrastructure health reporting #infrastructure monitoring #infrastructure monitoring report #infrastructure trends #infrastructure trends monitoring #Infrastructure Visibility #lightweight linux monitoring #lightweight monitoring #linux #linux administration #linux cpu monitoring #linux cpu usage #linux disk capacity planning #linux disk usage #Linux monitoring #linux monitoring setup #linux monitoring tools #linux performance #linux performance monitoring #linux server #linux server monitoring #linux servers #linux storage #linux tools #low maintenance monitoring #monitor cpu usage over time linux #monitor linux server health #monitor server trends #monitor small production server #monitoring without complexity #MySQL #mysql health reporting #MySQL monitoring #mysql optimization #MySQL Performance #mysql performance degradation #mysql performance monitoring #mysql performance trends #mysql query performance issues #mysql server monitoring #mysql slow queries #mysql slow query analysis #mysql slow query monitoring #mysql trends #mysql-health #networking #nsg #OCI #oci backup #oci bastion tutorial #oci block volume #oci infrastructure as code #OCI monitoring #oci networking #oci oracle database private subnet setup #oci oracle database tutorial #oci security #oci setup guide #oci terraform tutorial #oci tutorial for beginners #oci vcn terraform #oci virtual machine db system guide #oracle base database service tutorial #oracle cloud bastion #oracle cloud free tier tutorial #oracle cloud infrastructure step by step #oracle cloud infrastructure tutorial #oracle cloud storage #oracle database on oci setup #oracle-cloud #Performance #Performance Degradation #performance monitoring #performance trend monitoring #performance trends #plan disk growth server #practical server monitoring #predict disk usage growth #private instance access #query optimization #Security #security lists #server health #server health reporting #server health weekly report #server monitoring #Server Performance #server trend analysis #server-trends #simple cpu monitoring linux #simple linux monitoring #simple monitoring small business #simple monitoring system #simple ops monitoring #slow queries #slow query reporting mysql #small business infrastructure #small business IT #small business servers #small infrastructure monitoring #small server monitoring #ssh bastion #storage capacity planning linux #storage monitoring #subnets #System Health #system health reporting #terraform oci compute #terraform oracle cloud infrastructure #Trend Monitoring #trend-analysis #trends #Tutorial #vcn