MySQL Health Reporting: A Practical Guide for Small Teams
Many teams rely on MySQL every day, yet only notice problems when something breaks. Slow queries suddenly spike, disk usage creeps up, or replication starts lagging—and by the time alerts fire, the issue has already impacted users.
This is where mysql health reporting changes the game. Instead of reacting to incidents, you gain visibility into how your database behaves over time, making it easier to catch trends before they turn into outages.
Why MySQL Health Reporting Matters
Traditional mysql monitoring focuses on real-time alerts. While useful, it often creates noise and doesn’t provide enough context about how issues evolve.
Health reporting takes a different approach. It answers questions like:
- Is CPU usage steadily increasing week over week?
- Are slow queries becoming more frequent over time?
- Is disk I/O gradually trending toward saturation?
This kind of visibility is especially valuable for small teams that don’t have the time to constantly watch dashboards.
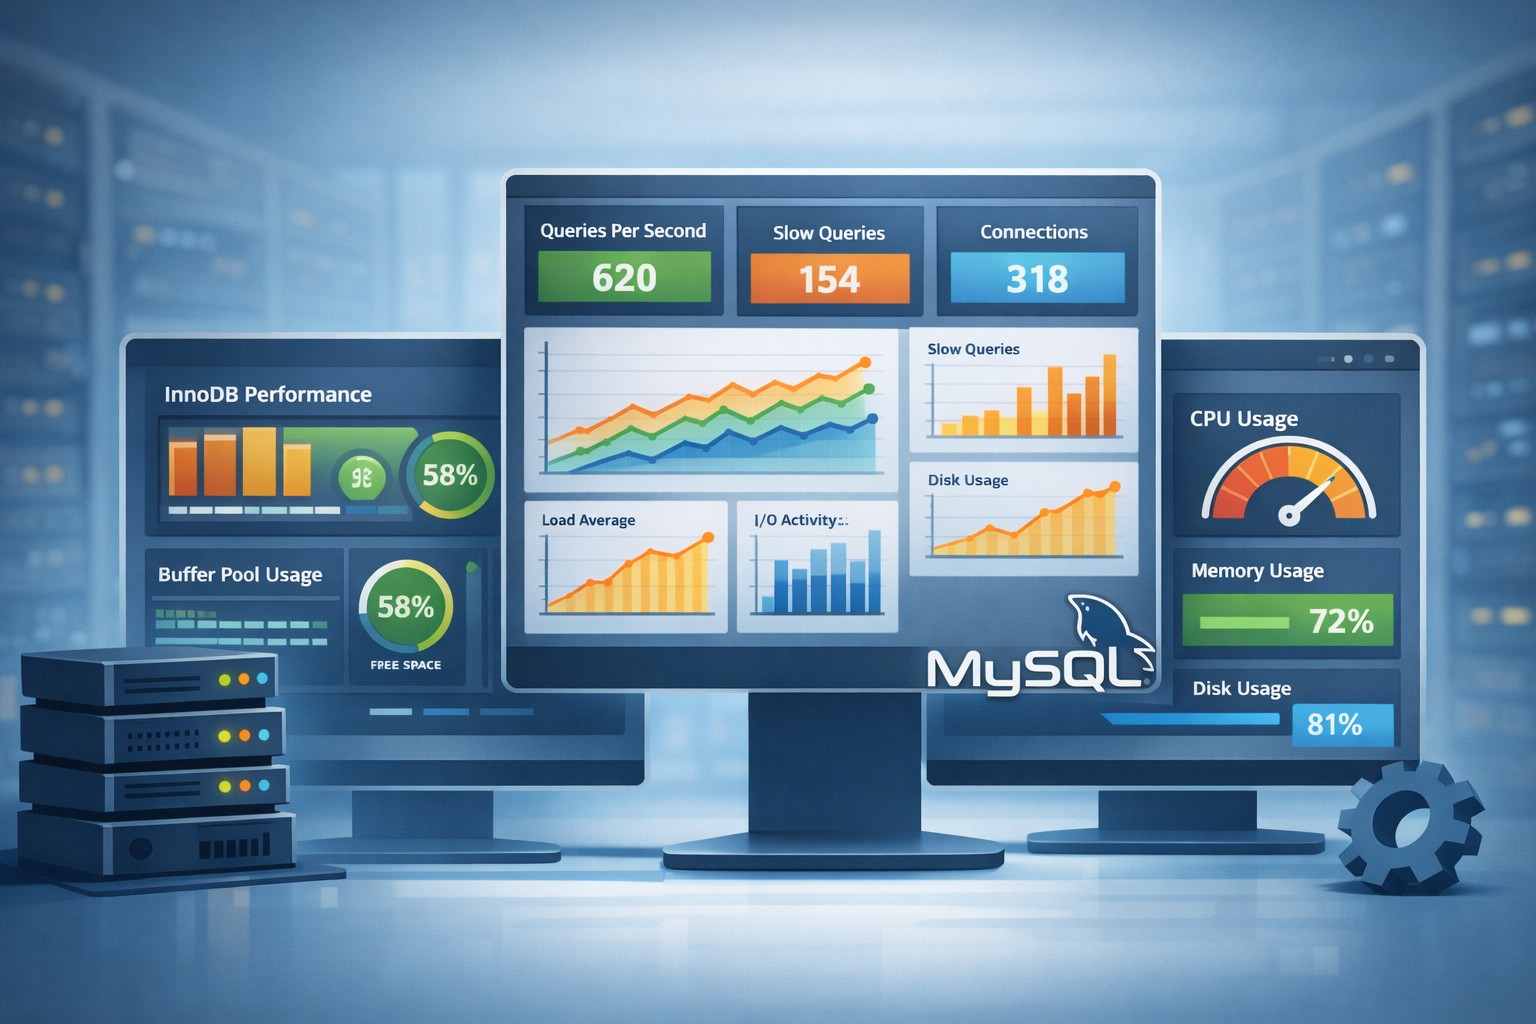
What Should You Track in MySQL Health Reporting?
Effective mysql performance monitoring focuses on a few key areas rather than trying to capture everything.
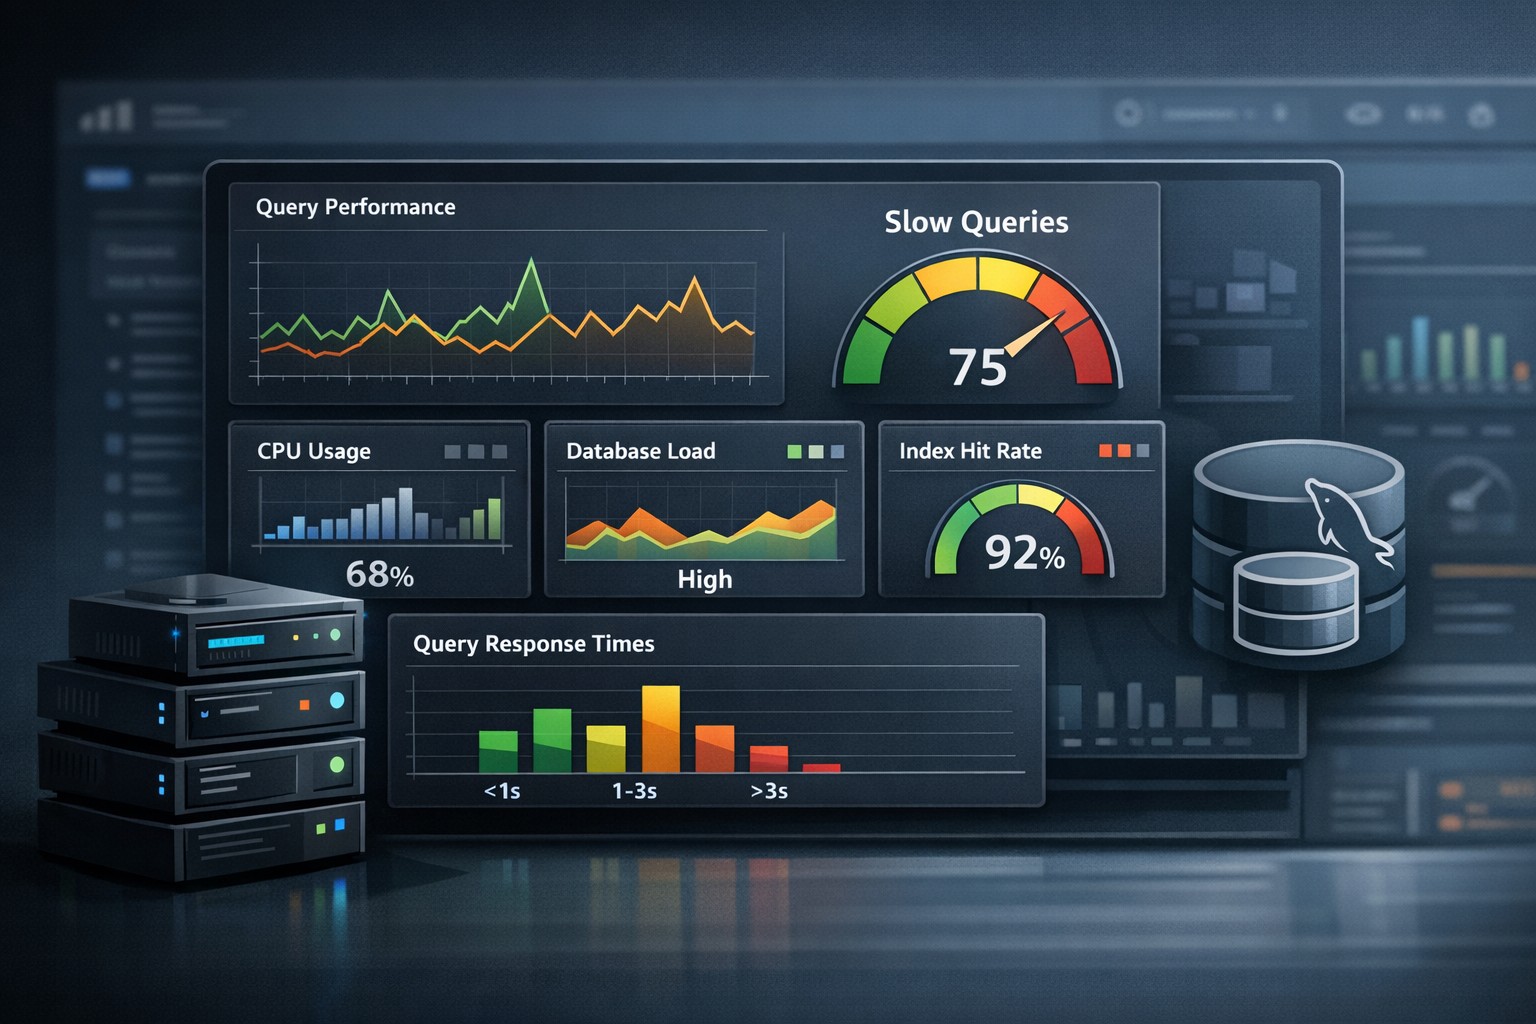
1. Query Performance Trends
Instead of looking at individual slow queries, track how they evolve over time. A gradual increase often signals indexing issues or growing datasets.
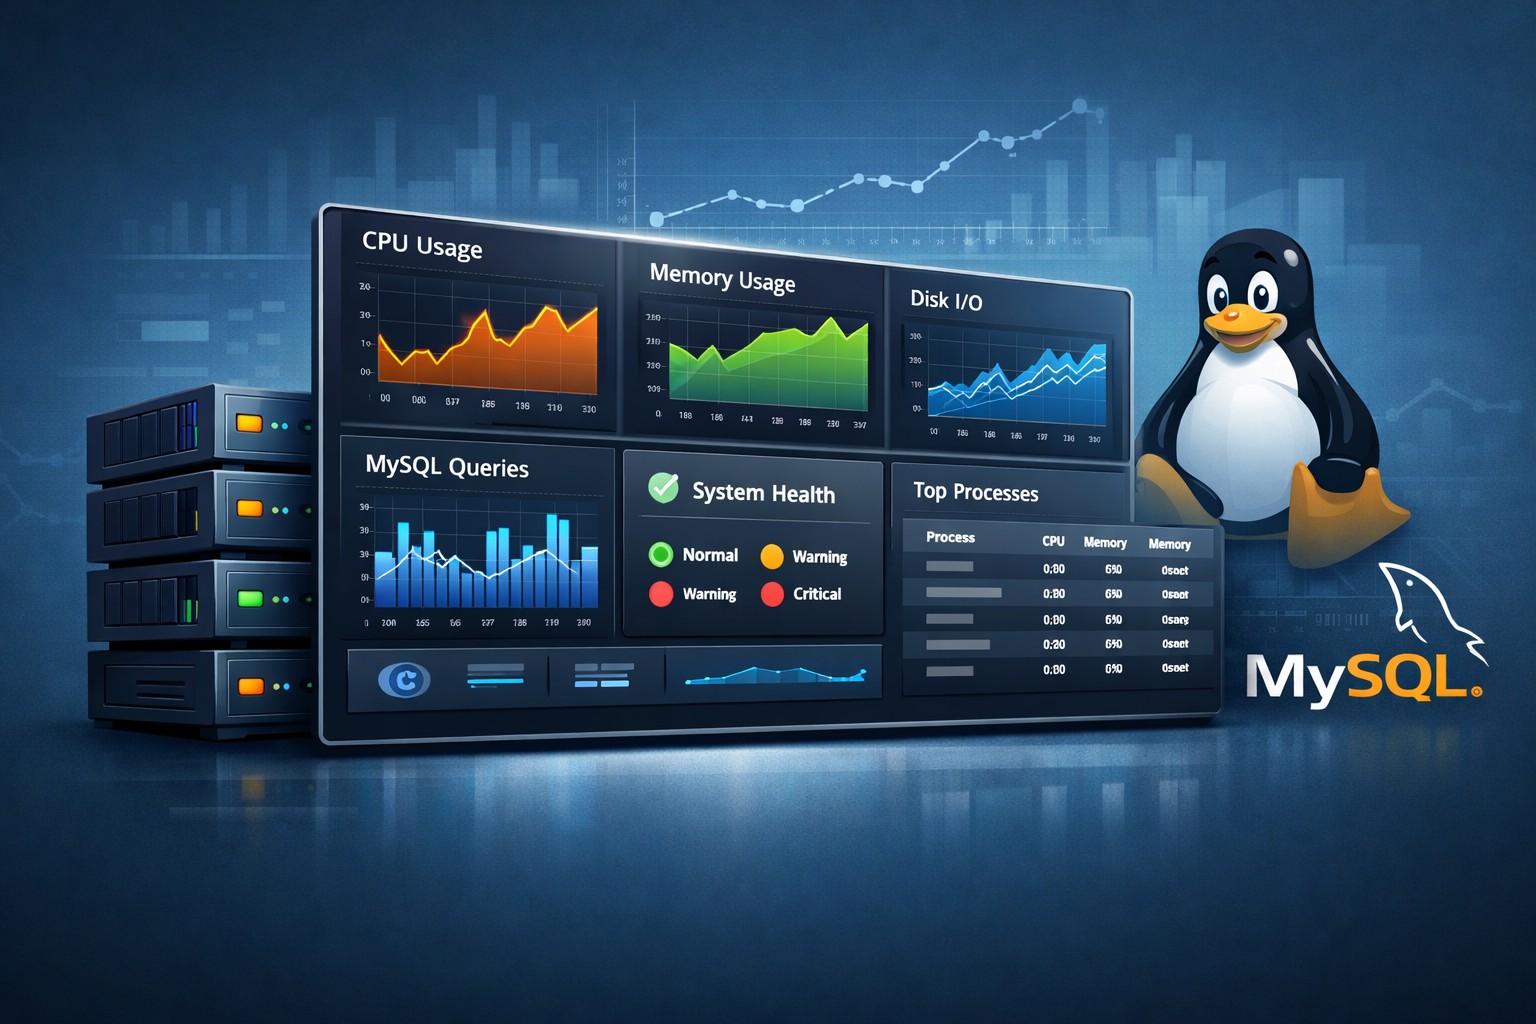
2. CPU and Memory Usage
Consistent upward trends in CPU or memory usage may indicate inefficient queries, missing caching, or workload changes.
3. Disk and I/O Behavior
Disk bottlenecks are one of the most common causes of MySQL slowdowns. Monitoring trends helps you plan capacity before performance degrades.
4. Connections and Throughput
Understanding how connection counts and query throughput change over time gives insight into application growth and load patterns.
Health Reporting vs Real-Time Monitoring
Both approaches are important, but they serve different purposes.
- Real-time monitoring: Detects immediate failures and spikes
- Health reporting: Identifies gradual degradation and long-term trends
For many teams, relying only on real-time alerts leads to reactive firefighting. Adding lightweight mysql server monitoring focused on trends provides a more balanced approach.
A Simple Approach to MySQL Health Reporting
You don’t need a complex observability stack to get started. A mysql monitoring lightweight approach can be surprisingly effective.
Here’s a practical way to implement it:
- Collect key metrics periodically (CPU, memory, queries, I/O)
- Store historical snapshots instead of only real-time data
- Generate weekly reports that highlight trends
- Review changes regularly instead of waiting for alerts
This keeps your setup simple while still providing meaningful insights.
Real-World Example
A small operations team managing a MySQL-backed application noticed occasional slowdowns but couldn’t pinpoint the cause.
After implementing basic health reporting, they discovered:
- Slow queries were increasing by 10–15% each week
- Disk I/O was gradually rising during peak hours
- CPU usage remained stable, ruling out compute issues
The root cause turned out to be a missing index combined with growing data volume. Without trend-based reporting, this pattern would have been easy to miss until it caused a major outage.
Keeping It Simple and Useful
Many teams overcomplicate mysql monitoring simple setups by trying to track everything in real time. In practice, a focused approach works better:
- Track fewer metrics, but track them consistently
- Prioritize trends over raw numbers
- Use reports instead of constant dashboards
This reduces noise and helps teams focus on what actually matters.
Summary
MySQL issues rarely appear overnight. They build gradually—through growing datasets, changing workloads, and small inefficiencies that compound over time.
mysql health reporting gives you the visibility to catch these patterns early, making your infrastructure more predictable and easier to manage.
If you're looking to move beyond reactive monitoring and start understanding how your systems evolve, explore Infrastructure Health Reporting to see how trend-based insights can simplify MySQL operations.