MySQL Monitoring: A Practical Guide for Small Teams
MySQL environments rarely fail without warning. In most cases, performance issues build gradually—queries get slower, CPU usage creeps up, and disk I/O starts to bottleneck. Without proper visibility, these signals are easy to miss until users start complaining.
This is where effective mysql monitoring becomes critical—not just for catching outages, but for understanding how your database behaves over time.
Why MySQL Monitoring Matters
Many teams rely on reactive monitoring—alerts that trigger only when something breaks. While useful, this approach misses the bigger picture. MySQL performance problems often develop over days or weeks.
With proper mysql health reporting, you can:
- Spot slow query trends before they impact users
- Understand how workload patterns affect performance
- Plan capacity upgrades with confidence
- Avoid emergency firefighting
The goal isn’t just to monitor—it’s to understand behavior over time.
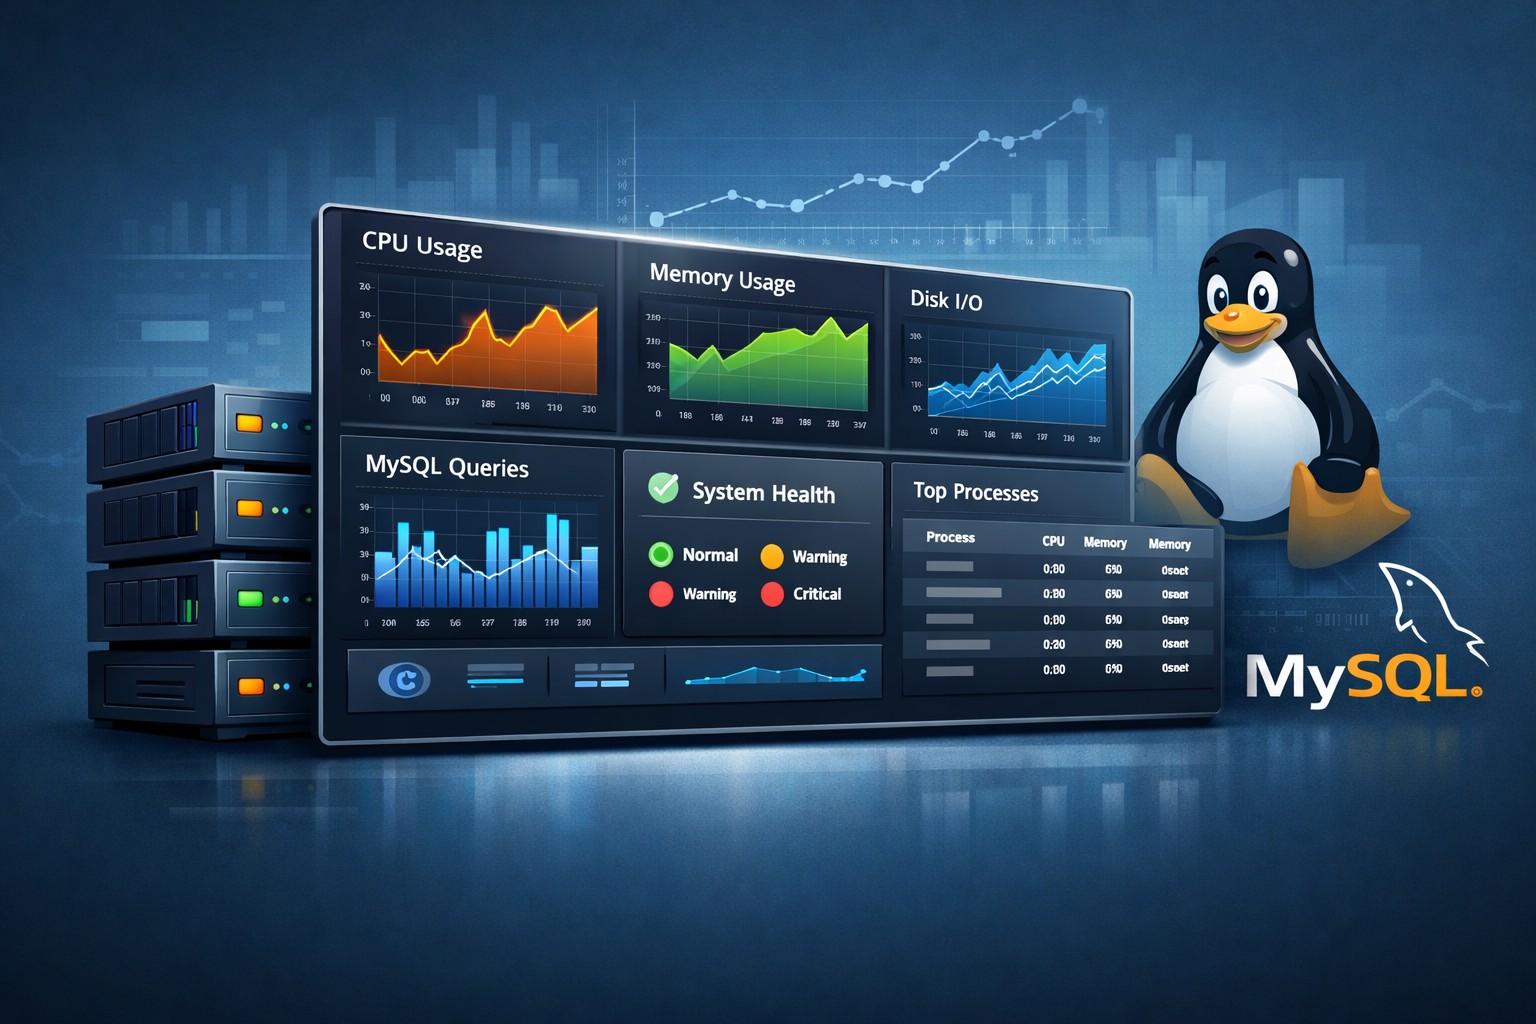
Core Metrics to Track
Effective mysql server monitoring focuses on a few key signals that tell you how the database is performing.
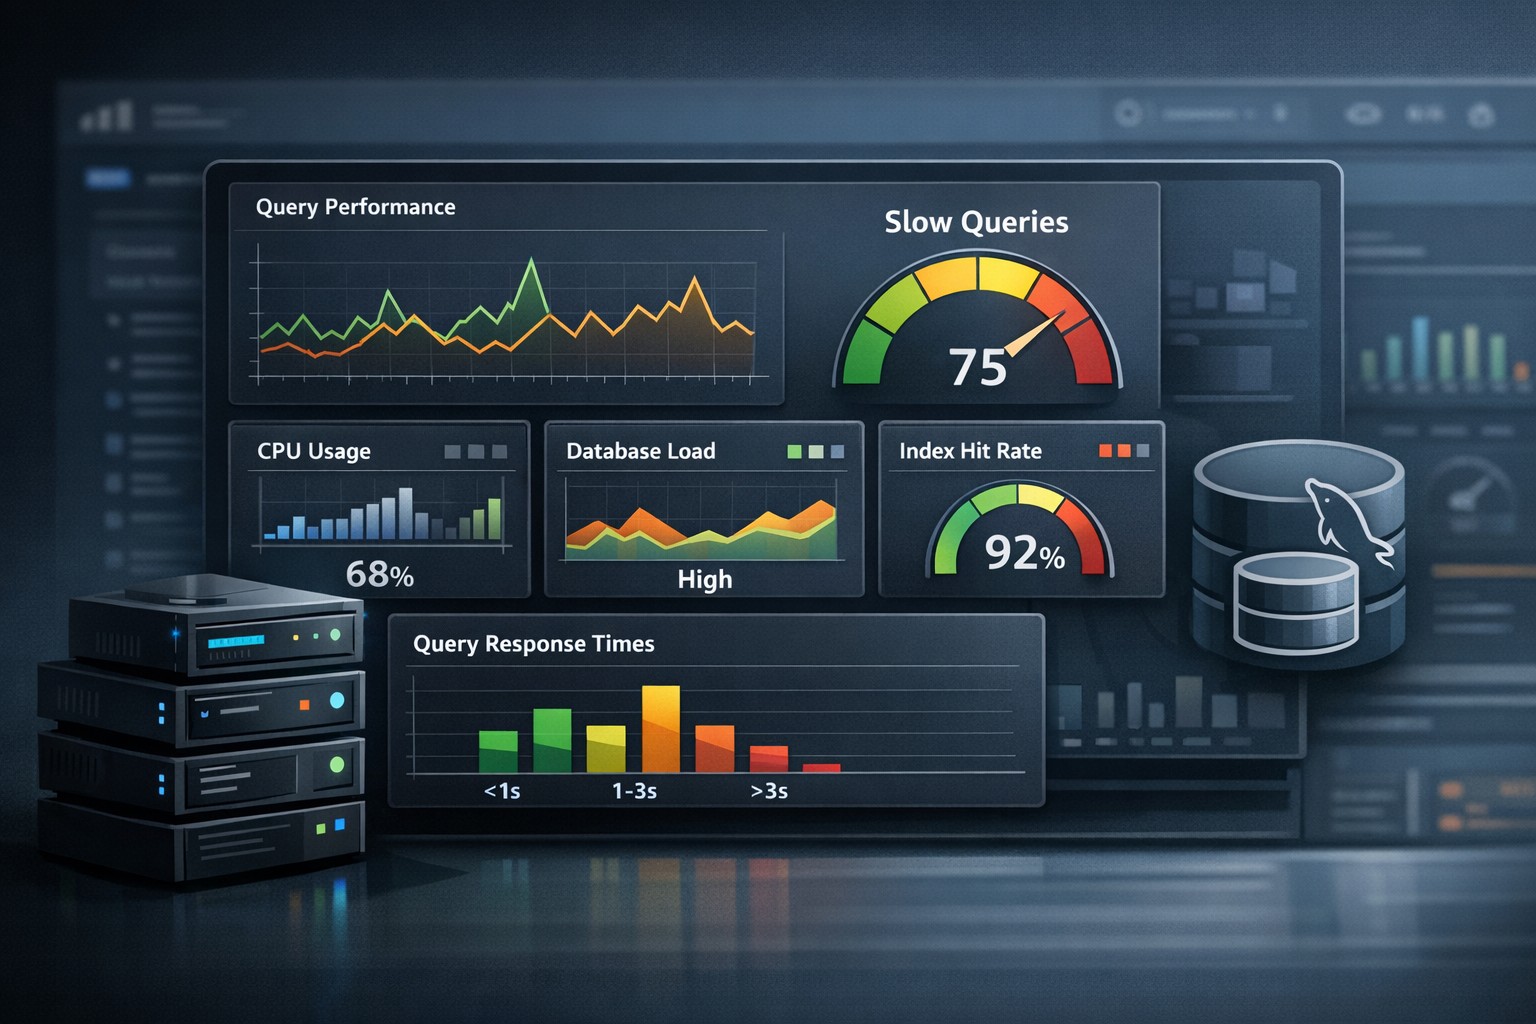
1. Query Performance
Slow queries are often the first sign of trouble. Monitoring average execution time, frequency, and query patterns helps you identify inefficiencies early.
2. CPU and Memory Usage
High CPU usage may indicate inefficient queries or missing indexes. Memory pressure can lead to swapping, which severely impacts performance.
3. Disk I/O
Databases are heavily dependent on disk performance. Increasing read/write latency often signals a growing workload or insufficient storage performance.
4. Connection Trends
Tracking active connections helps identify spikes, connection leaks, or application-side inefficiencies.
5. Replication Health (if applicable)
Replication lag can silently grow and create inconsistencies between primary and replica systems.
Beyond Alerts: The Value of Trend-Based Monitoring
Traditional mysql performance monitoring tools focus heavily on real-time alerts. While alerts are important, they don’t always provide context.
For small teams especially, a lightweight approach works better—one that focuses on trends rather than constant noise.
For example:
- Is CPU usage steadily increasing week over week?
- Are slow queries becoming more frequent?
- Is disk latency gradually degrading?
These patterns are what actually prevent outages.
Real-World Example
Consider a small SaaS application running on a single MySQL server. Everything appears fine in real time—no alerts, no crashes.
But over a two-week period:
- Average query time increases by 20%
- CPU usage slowly rises during peak hours
- Disk I/O latency becomes slightly worse each day
Without trend visibility, this goes unnoticed. Eventually, a traffic spike pushes the system over the edge.
With proper mysql monitoring lightweight tools, these changes would be visible early—allowing the team to optimize queries or scale resources before users are affected.
Keeping Monitoring Simple and Effective
Many teams avoid setting up monitoring because they assume it requires complex, heavy tools. In reality, mysql monitoring simple setups are often more effective.
The key is to focus on:
- Weekly or daily trend reports instead of constant alerts
- Clear visualization of key metrics
- Actionable insights rather than raw data
This approach reduces noise and helps teams stay focused on what actually matters.
Summary
MySQL monitoring isn’t just about uptime—it’s about understanding how your database evolves under real workloads. By focusing on trends, key performance metrics, and simple reporting, small teams can gain meaningful visibility without the burden of complex observability stacks.
If you want a clearer view of how your infrastructure behaves over time, explore Infrastructure Health Reporting to see how trend-based insights can help you stay ahead of performance issues.