MySQL rarely fails all at once. Instead, performance slowly degrades—queries take a bit longer, CPU usage creeps up, and disks fill quietly in the background. By the time users complain, the problem has already been growing for days or weeks.
Here’s the thing… most teams are set up to catch outages, not slow deterioration. And that’s exactly why MySQL performance degradation often goes unnoticed until it becomes a real issue.
What MySQL Performance Degradation Really Means
Performance degradation isn’t a sudden spike—it’s a trend. It shows up as gradual changes in how your database behaves under normal workload.
- Queries taking longer over time
- Increasing number of slow queries
- Rising CPU or memory usage without clear cause
- Disk I/O slowly becoming a bottleneck
- Growing table sizes impacting query efficiency
Individually, these changes might look harmless. Together, they point to a system slowly losing efficiency.
Why Traditional Monitoring Misses It
Most monitoring tools are designed for alerts—CPU hits 90%, disk is full, queries timeout. But degradation doesn’t trigger alerts early enough.
But this is where it matters… if CPU usage increases from 30% to 55% over two weeks, no alert fires. Yet that trend is a warning sign.
Without visibility into mysql performance trends, you’re only seeing snapshots—not the story.
Common Causes of Slow Performance Over Time
There’s rarely a single cause. Instead, it’s usually a combination of small issues building up.
Growing Data Size
Tables get larger, indexes become less efficient, and queries that once took milliseconds now take seconds.
Query Pattern Changes
New features introduce heavier queries. Over time, mysql query trends shift and put more pressure on the database.
Fragmentation and Maintenance Gaps
Lack of regular optimization leads to inefficient storage and slower reads.
Resource Saturation
More users, more connections, more workload—but the same infrastructure.
What to Look for in MySQL Trend Monitoring
To catch degradation early, you need to focus on trends—not just thresholds.
- Slow query count over time
- Average query execution time trends
- CPU and memory usage patterns
- Disk growth and I/O behavior
- Connection and workload trends
So what does this mean in practice? You’re looking for direction, not just values. Is something gradually increasing week over week?
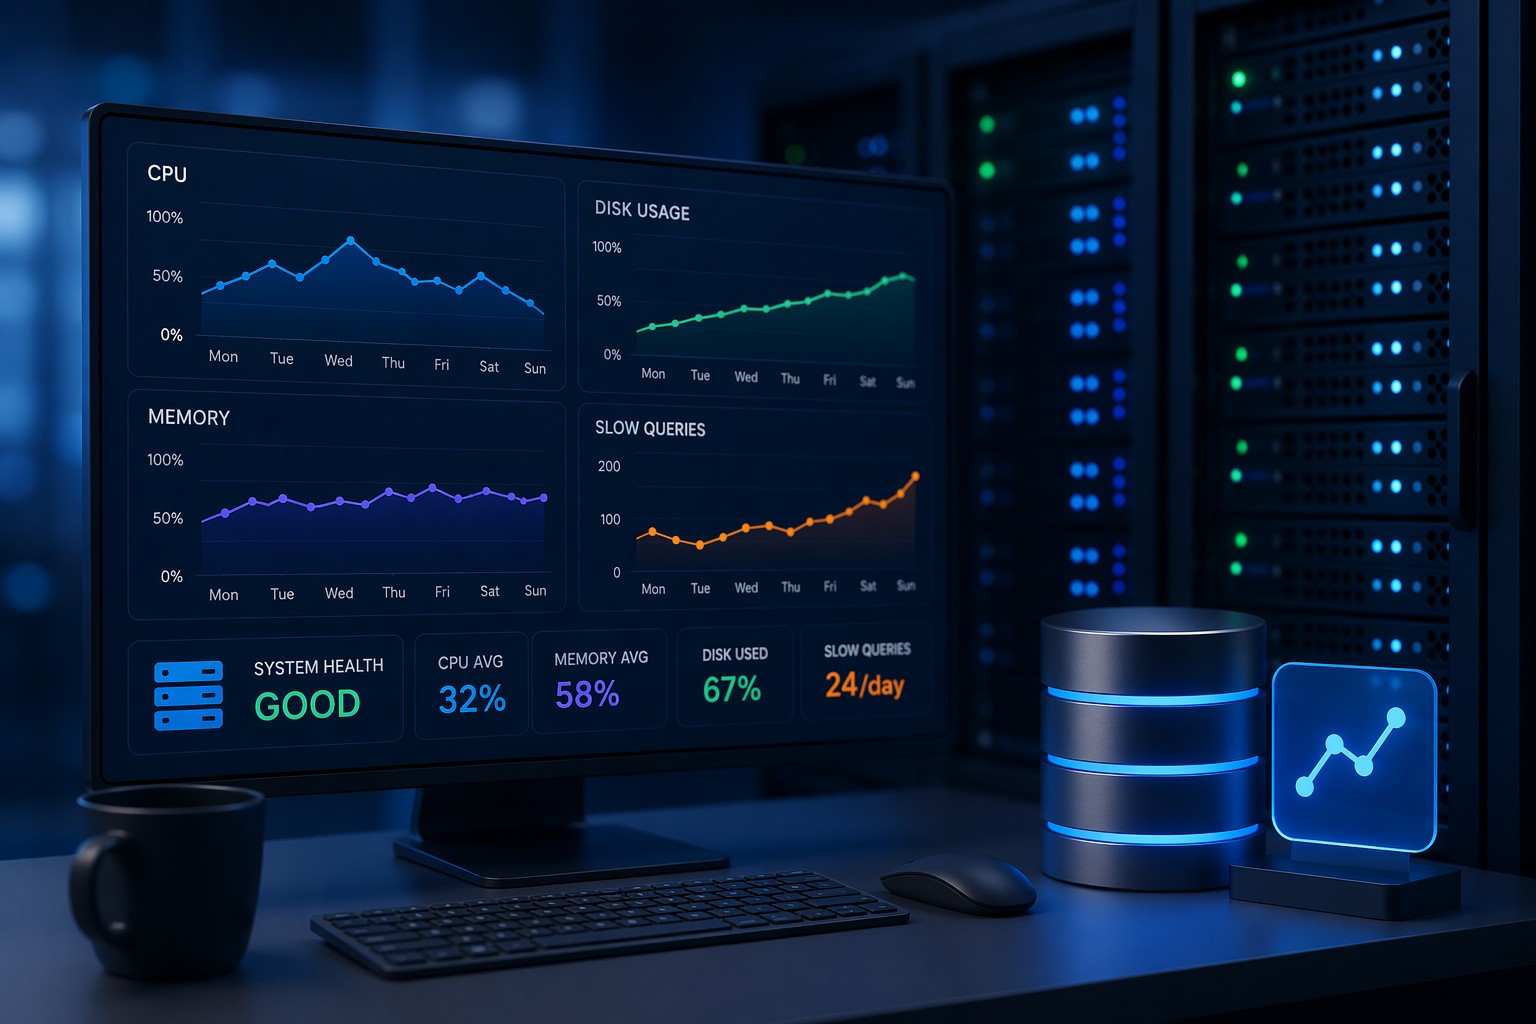
Real-World Example
Imagine a production MySQL server handling a SaaS application.
Week 1: Everything looks fine. Average query time is 50ms.
Week 3: It’s now 80ms. Still acceptable.
Week 6: It reaches 150ms. Users start noticing delays.
No alerts fired. No obvious spikes. Just a steady decline in performance.
This is a classic case of mysql slow performance over time—and it’s preventable if you’re watching the right metrics.
How to Stay Ahead of Degradation
The goal isn’t to react faster—it’s to see problems earlier.
- Track weekly performance trends instead of relying only on real-time alerts
- Review slow query growth regularly
- Monitor workload changes as your application evolves
- Correlate infrastructure metrics with database behavior
Think of it like a slow leak. You won’t notice it in a day—but over time, it becomes a problem.
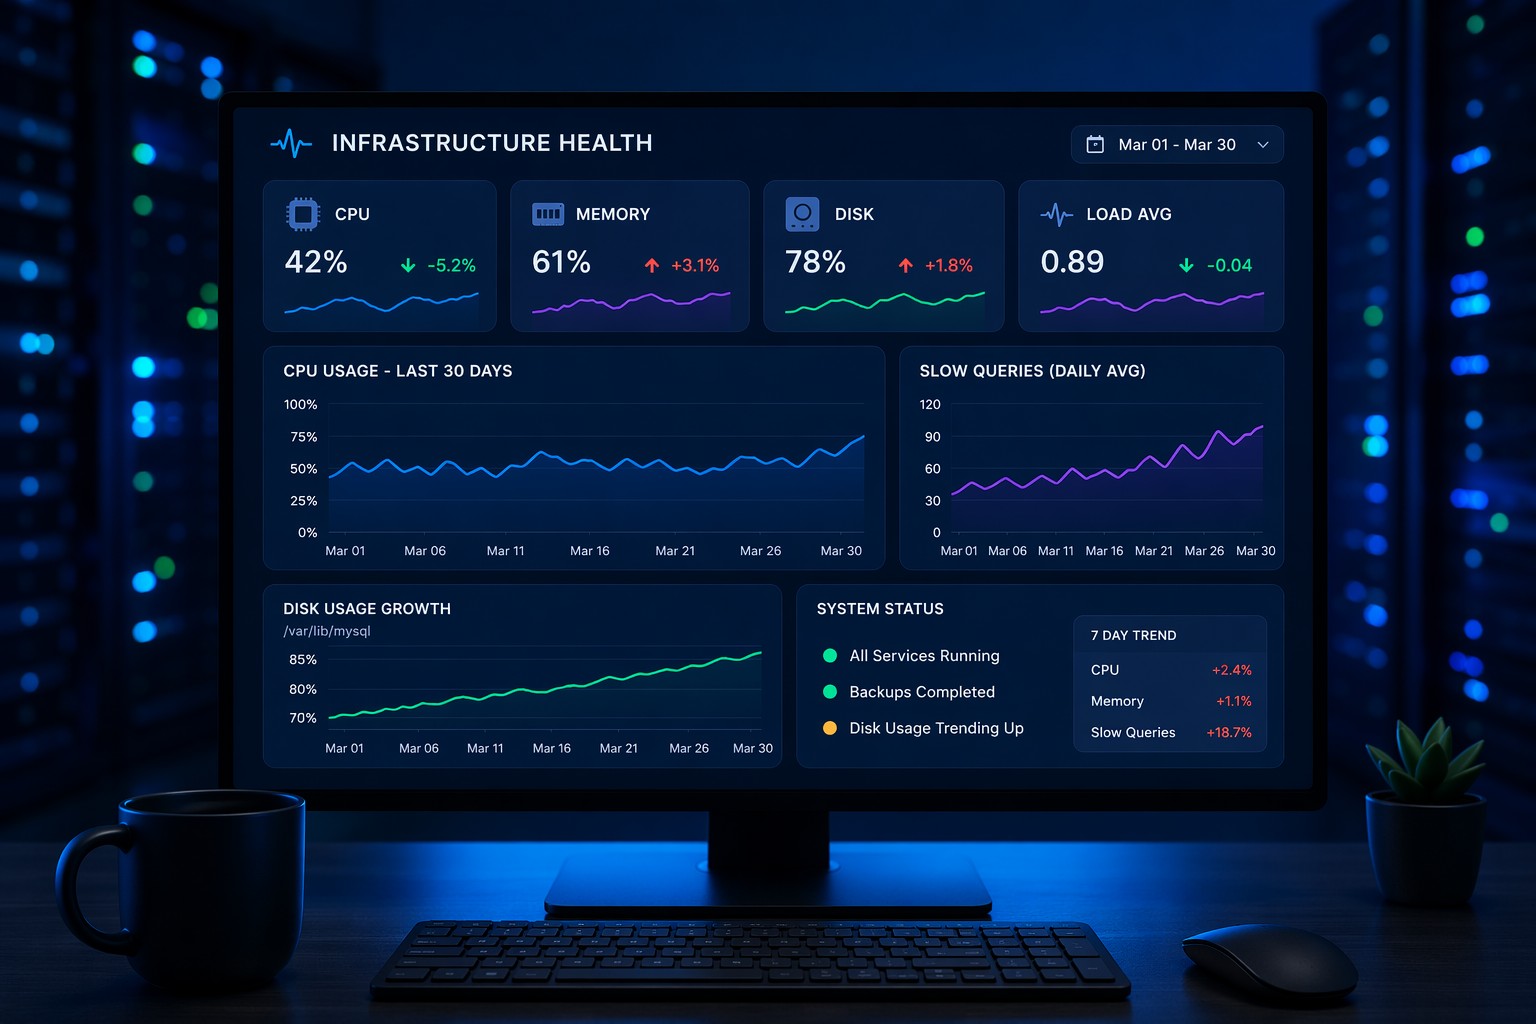
Summary
MySQL performance degradation is subtle, gradual, and easy to miss if you’re only watching for failures. By focusing on trends instead of alerts, you can spot issues early and fix them before they impact users.
If you want a clearer view of how your database health evolves over time, take a look at Infrastructure Health Reporting. It’s designed to show exactly how problems develop—so you can act before they turn into outages.