For many teams running Linux servers, monitoring quickly becomes over-engineered. You start with a simple need—CPU, memory, disk usage—and end up deploying a full stack with multiple components, storage backends, and dashboards that require ongoing maintenance.
But here’s the thing: not every environment needs a heavy monitoring stack. If you’re running a small OCI deployment, a few application servers, or a lean database setup, a simpler approach is often more reliable and easier to maintain.
This is where linux monitoring without prometheus becomes a practical choice.
Why Avoid a Heavy Monitoring Stack?
Tools like Prometheus and Grafana are powerful, but they come with operational overhead. You’re not just monitoring your systems—you’re also maintaining the monitoring platform itself.
For small teams or straightforward infrastructure, this introduces unnecessary complexity:
- Multiple services to deploy and manage
- Storage and retention configuration
- Alerting pipelines to maintain
- Additional security considerations
If your goal is simply to keep systems healthy and detect issues early, a lightweight linux monitoring tool often delivers better results with less effort.
What a Minimal Linux Monitoring Setup Should Cover
Even without Prometheus, you still need visibility into core system metrics. A minimal linux monitoring setup should include:
- CPU usage – detect load spikes or runaway processes
- Memory usage – identify leaks or pressure
- Disk space and I/O – prevent outages from full volumes
- System load – understand real-time performance
- Basic service checks – ensure key processes are running
The difference is how you collect and use this data—not how much you collect.
Lightweight Monitoring Options That Actually Work
If you’re looking for linux monitoring without grafana or complex pipelines, there are several practical approaches.
1. Native Linux Tools
Start with what’s already available:
topandhtopfor real-time visibilityvmstatfor memory and process insightiostatfor disk performancedf -hfor storage tracking
These tools are simple but extremely effective when used regularly or scripted.
2. Cron-Based Health Checks
A very practical approach is building small scripts that run every few minutes:
#!/bin/bash
CPU=$(top -bn1 | grep "Cpu(s)" | awk '{print $2 + $4}')
MEM=$(free | grep Mem | awk '{print $3/$2 * 100.0}')
DISK=$(df / | tail -1 | awk '{print $5}' | sed 's/%//g')

if (( $(echo "$CPU > 80" | bc -l) )); then
  echo "High CPU usage: $CPU%" >> /var/log/sys-alerts.log
fi
This kind of setup gives you a simple linux monitoring solution without external dependencies.
3. Log-Based Monitoring
Instead of collecting metrics continuously, you can monitor logs:
- System logs (
/var/log/messages,syslog) - Application logs
- Database logs
Tools like grep, awk, or lightweight log watchers can alert you when patterns appear.
4. Simple Alerting via Email or Webhooks
You don’t need a full alert manager. A script can send notifications directly:
- Email via
mailor SMTP - Webhook calls to Slack or internal tools
This keeps alerting immediate and easy to troubleshoot.
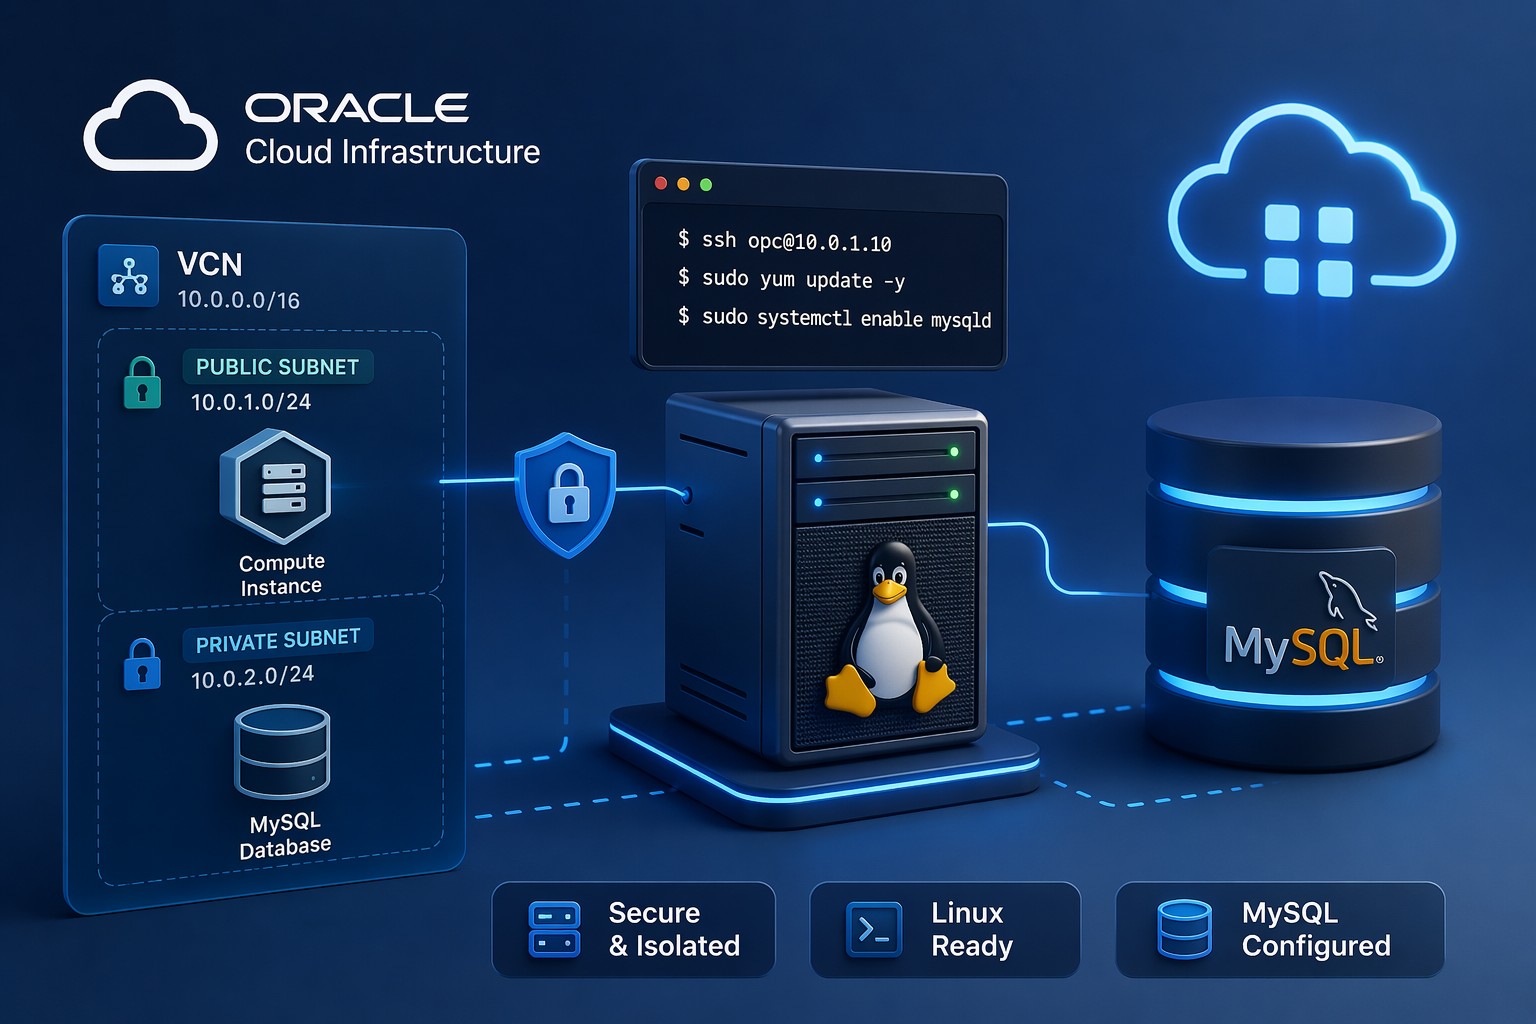
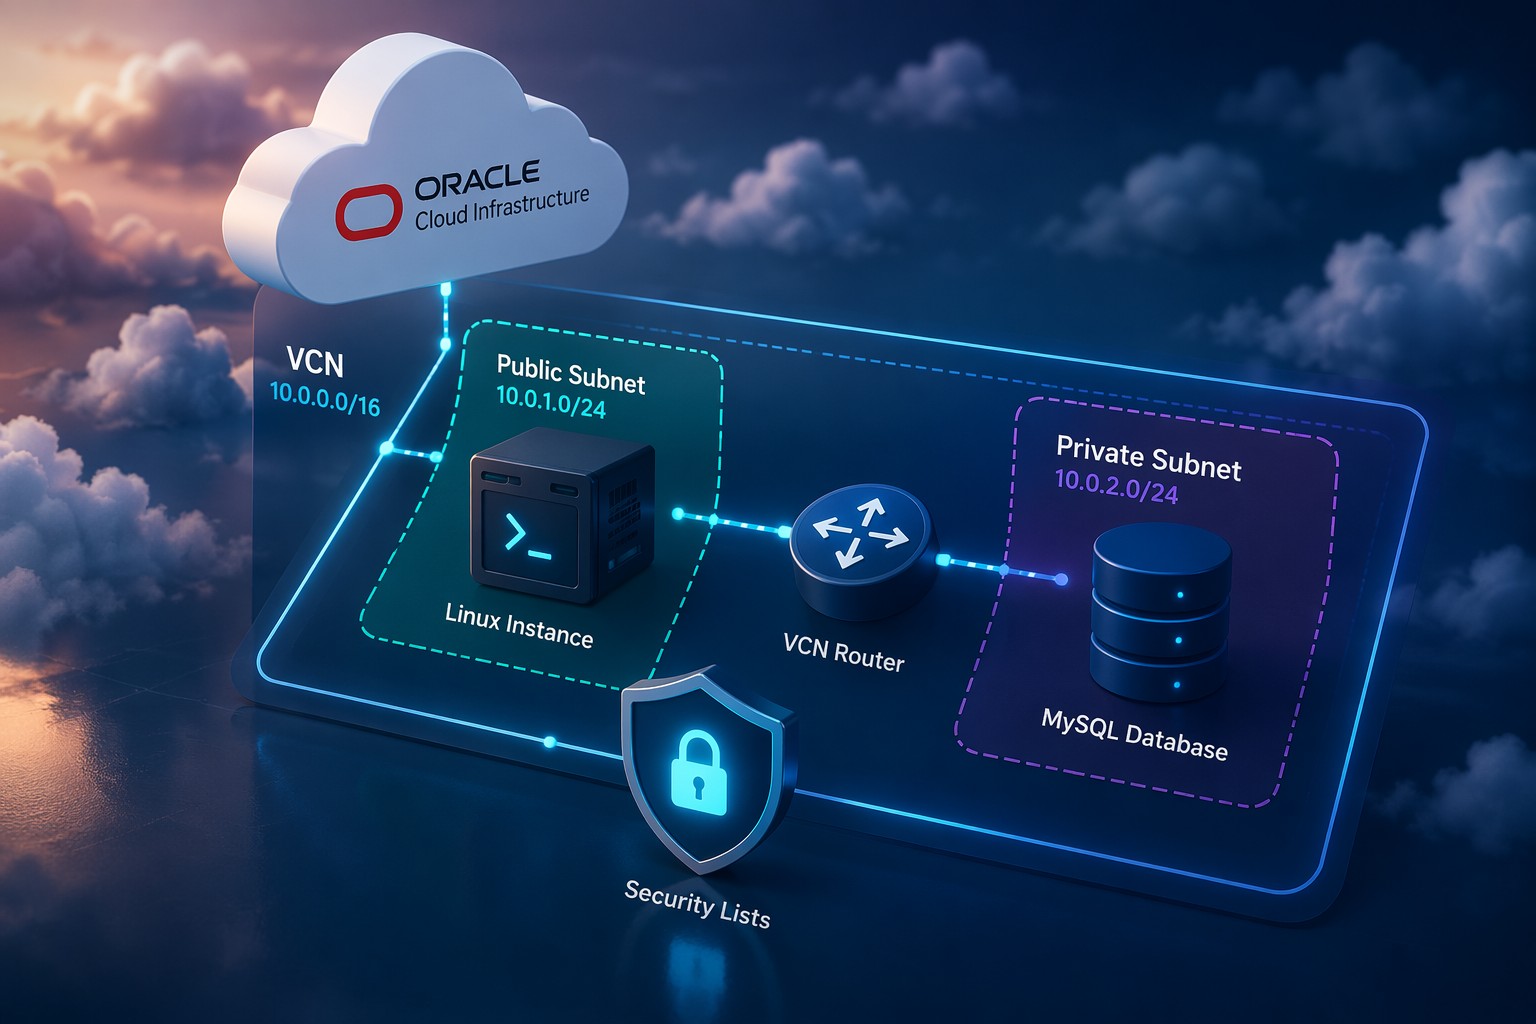
Real-World Example: Small OCI Deployment
Consider a typical Oracle Cloud setup:
- 1–2 application servers
- 1 database server
- Basic load balancer
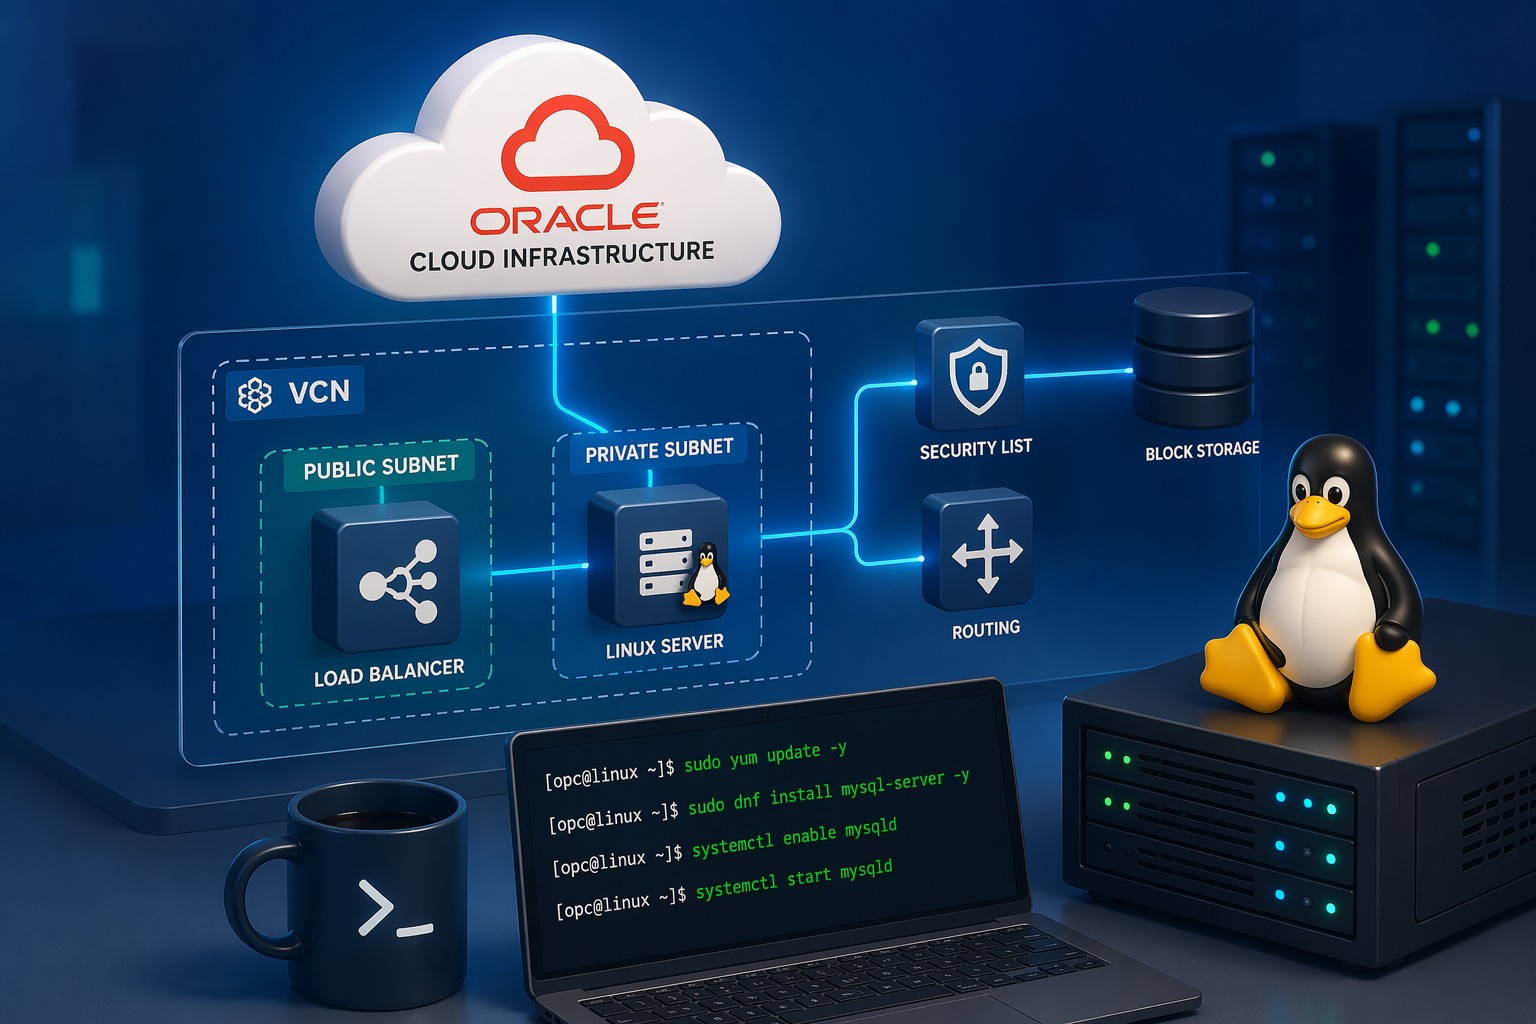
In this scenario, deploying a full monitoring stack often creates more work than value. A better approach:
- Install basic system tools on each server
- Deploy a shared health-check script
- Centralize logs using simple file shipping or periodic sync
- Configure threshold-based alerts
This gives you visibility, control, and faster troubleshooting without adding operational weight.
Common Mistakes to Avoid
- Overbuilding too early – start simple and scale only when needed
- Ignoring alerts – even simple monitoring fails without action
- No retention plan – logs and metrics should still be managed
- Manual-only monitoring – always automate key checks
When You Might Still Need Prometheus
There are cases where a full monitoring stack makes sense:
- Large-scale microservices environments
- High-frequency metric collection requirements
- Complex alerting and visualization needs
But for many teams, especially those running lean infrastructure, a minimal linux monitoring setup is not just enough—it’s more efficient.
Summary
Linux monitoring without prometheus is not about cutting corners—it’s about choosing the right level of complexity for your environment. By focusing on essential metrics, using native tools, and automating simple checks, you can build a reliable monitoring approach that’s easy to maintain.
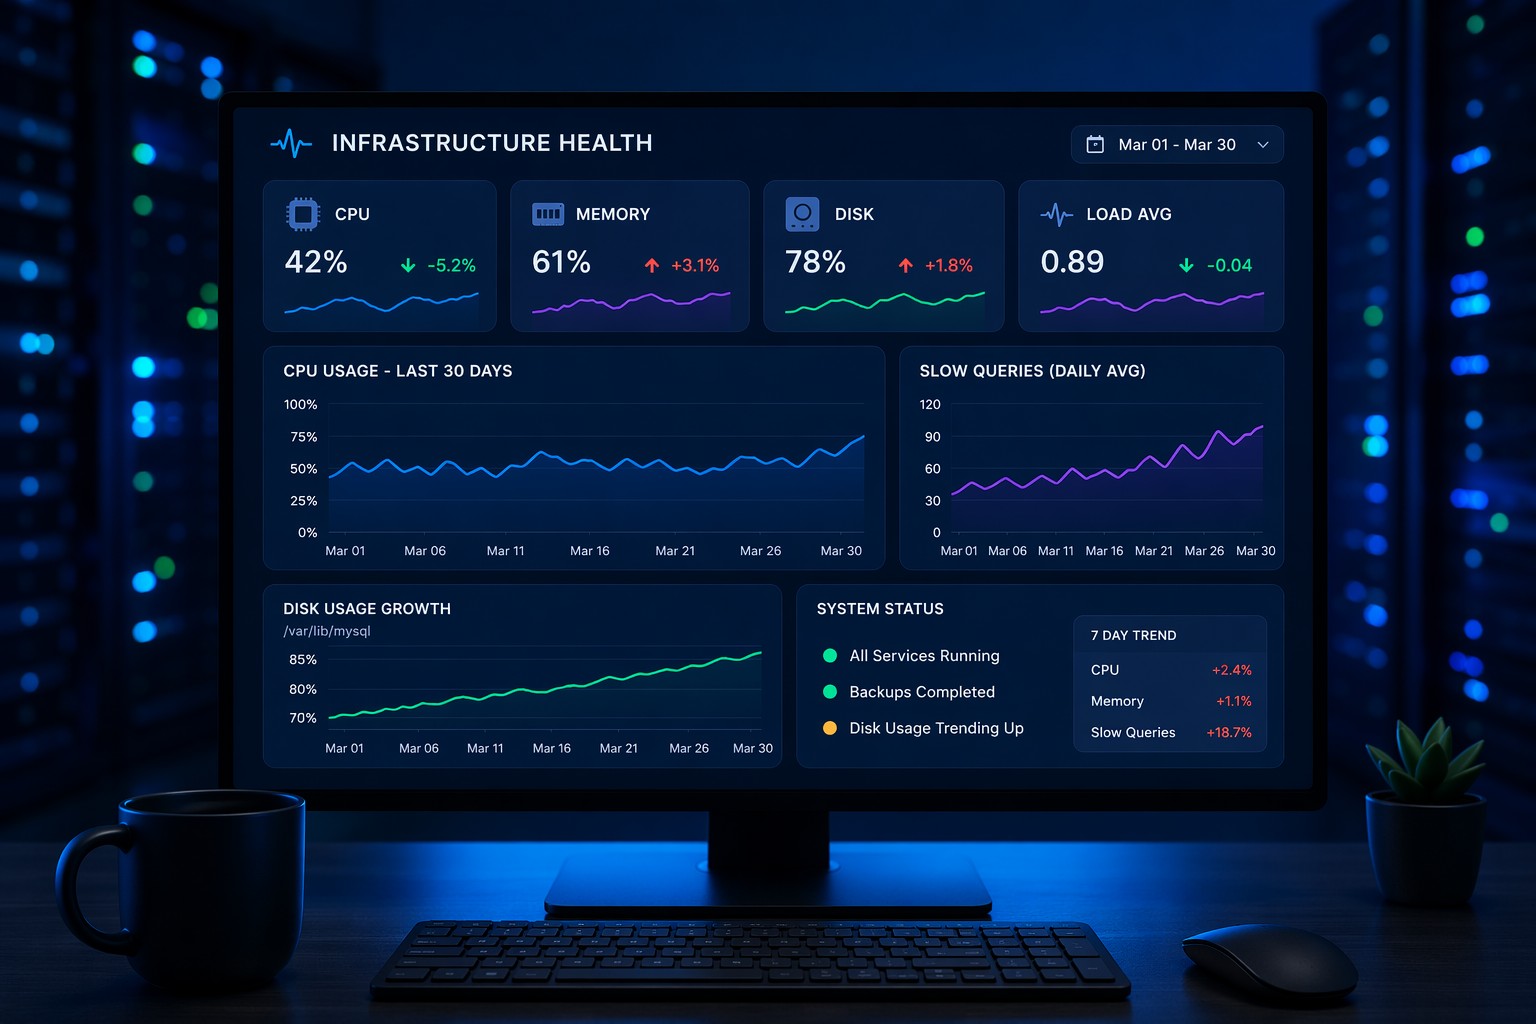
If you’re looking to take this further and structure your monitoring in a way that supports long-term operations, explore Infrastructure Health Reporting to align your setup with practical operational visibility.