The Weekly Infrastructure Health Report Every Developer Should Have
Most developers don’t need more alerts.
They need better visibility.
If you’ve ever run a production server, you’ve probably experienced this:
-
alerts firing at the wrong time
-
alerts that don’t matter
-
alerts that get ignored
-
or no alerts at all
Neither extreme works.
Too many alerts create noise.
Too few create blind spots.
There is a better approach.
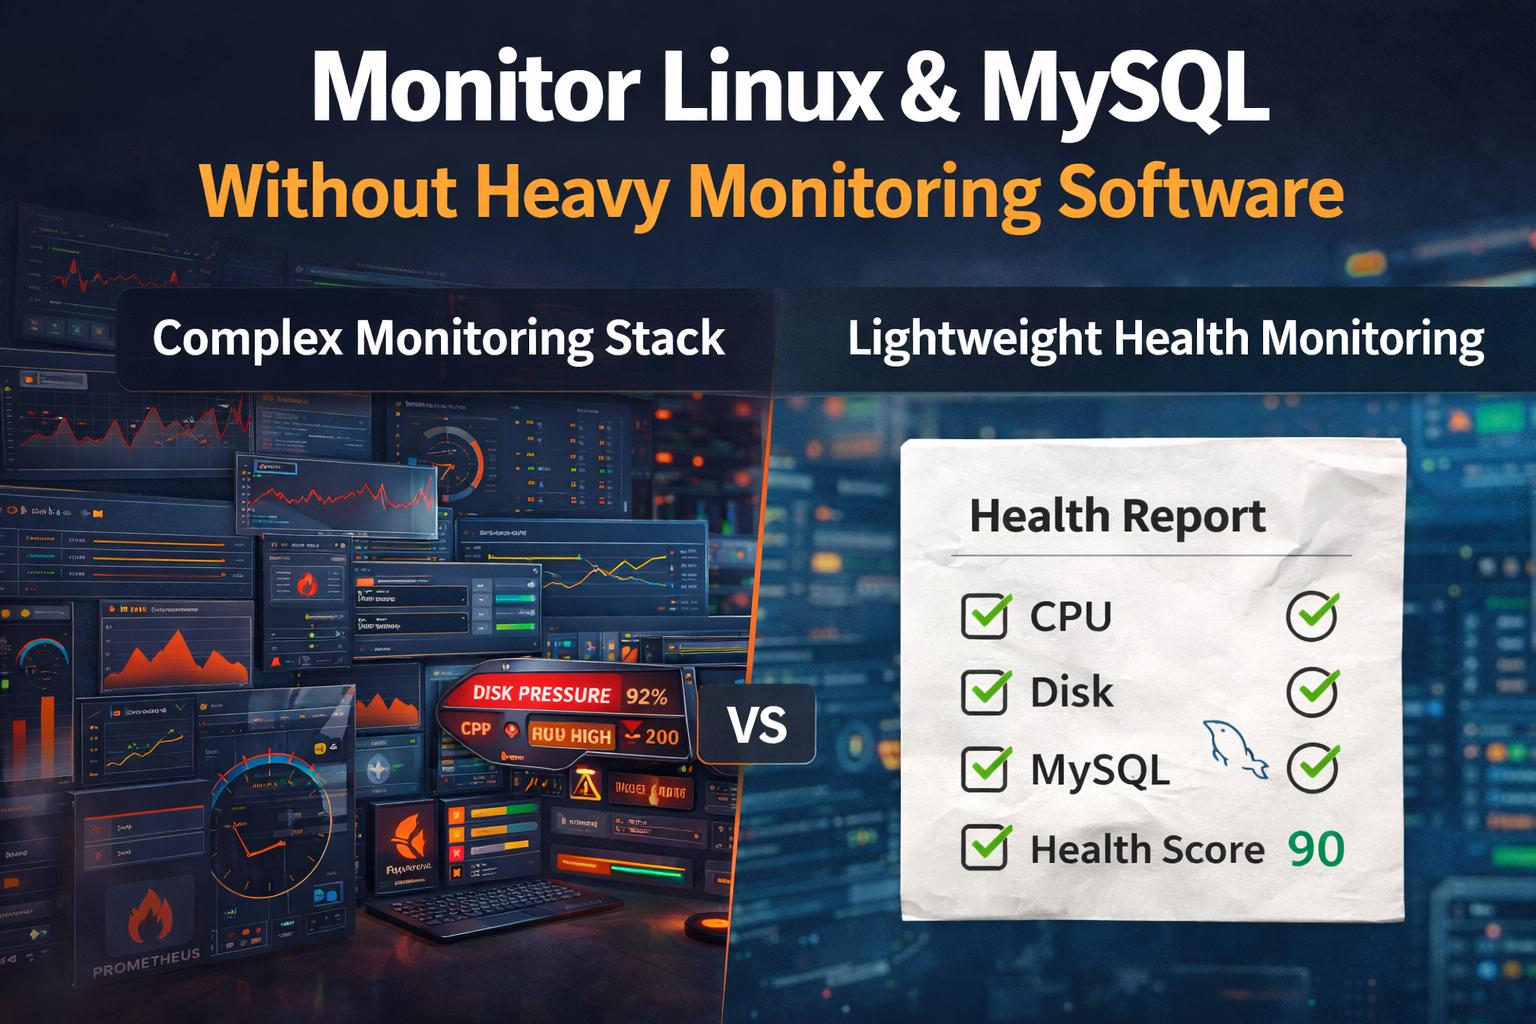
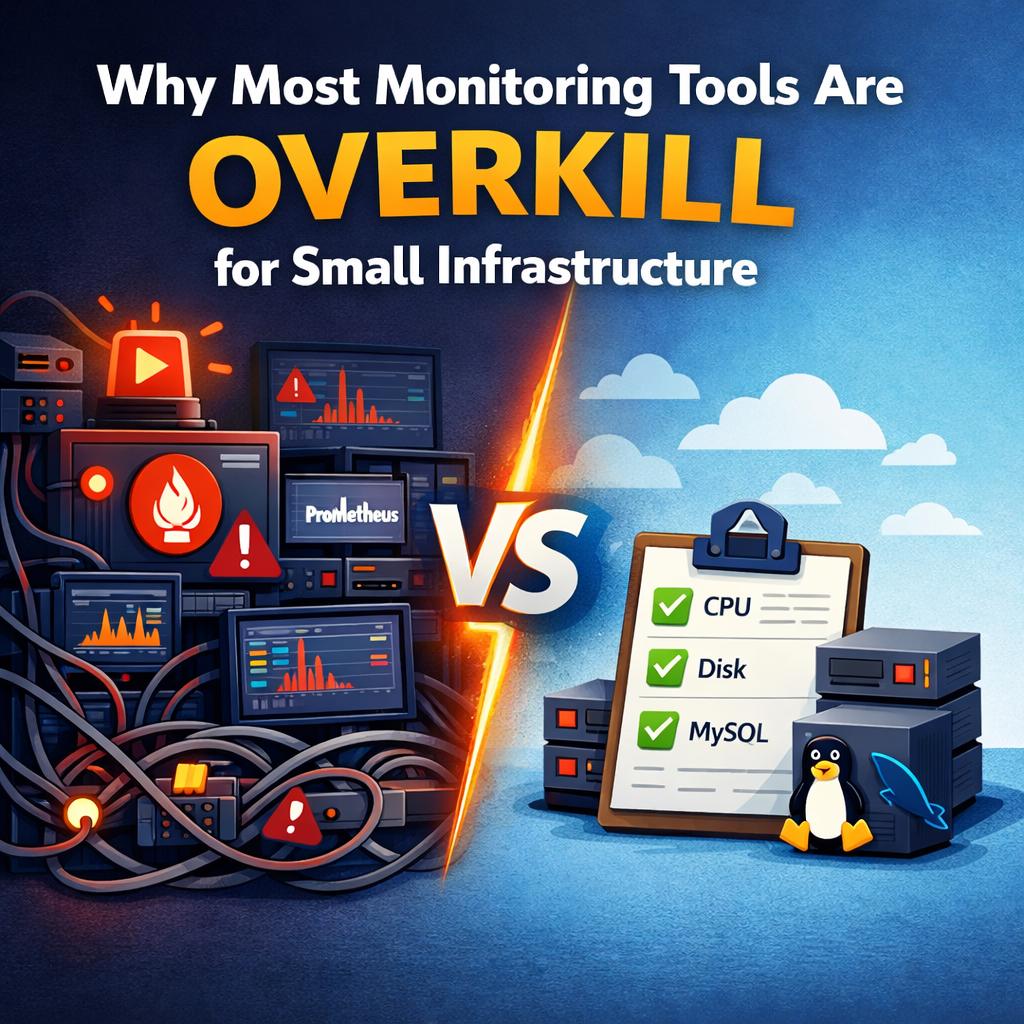
The Problem with Traditional Monitoring
Traditional monitoring systems are built around real-time alerts.
That sounds good in theory — but in small environments, it often leads to:
-
alert fatigue
-
constant interruptions
-
missed important signals
-
difficulty understanding long-term trends
You react to events instead of understanding your system.
Why Alerts Alone Are Not Enough
Alerts tell you when something is already wrong.
They do not tell you:
-
how your system is evolving
-
whether performance is degrading
-
if resource usage is trending upward
-
whether your database workload is changing
That means you often discover problems too late.
What Small Environments Actually Need
Small Linux and MySQL environments need something simpler:
👉 consistent, structured visibility into system health
Not constant monitoring noise.
Not complex dashboards.
A clear view of:
-
what changed
-
what is trending
-
what might become a problem
The Power of Weekly Health Reports
A weekly infrastructure health report solves this problem.
Instead of reacting to alerts, you review:
-
system health trends
-
disk usage growth
-
CPU and memory patterns
-
MySQL workload changes
-
slow query behavior
-
early warning signals
This creates a predictable rhythm:
-
review once a week
-
understand changes
-
take action early
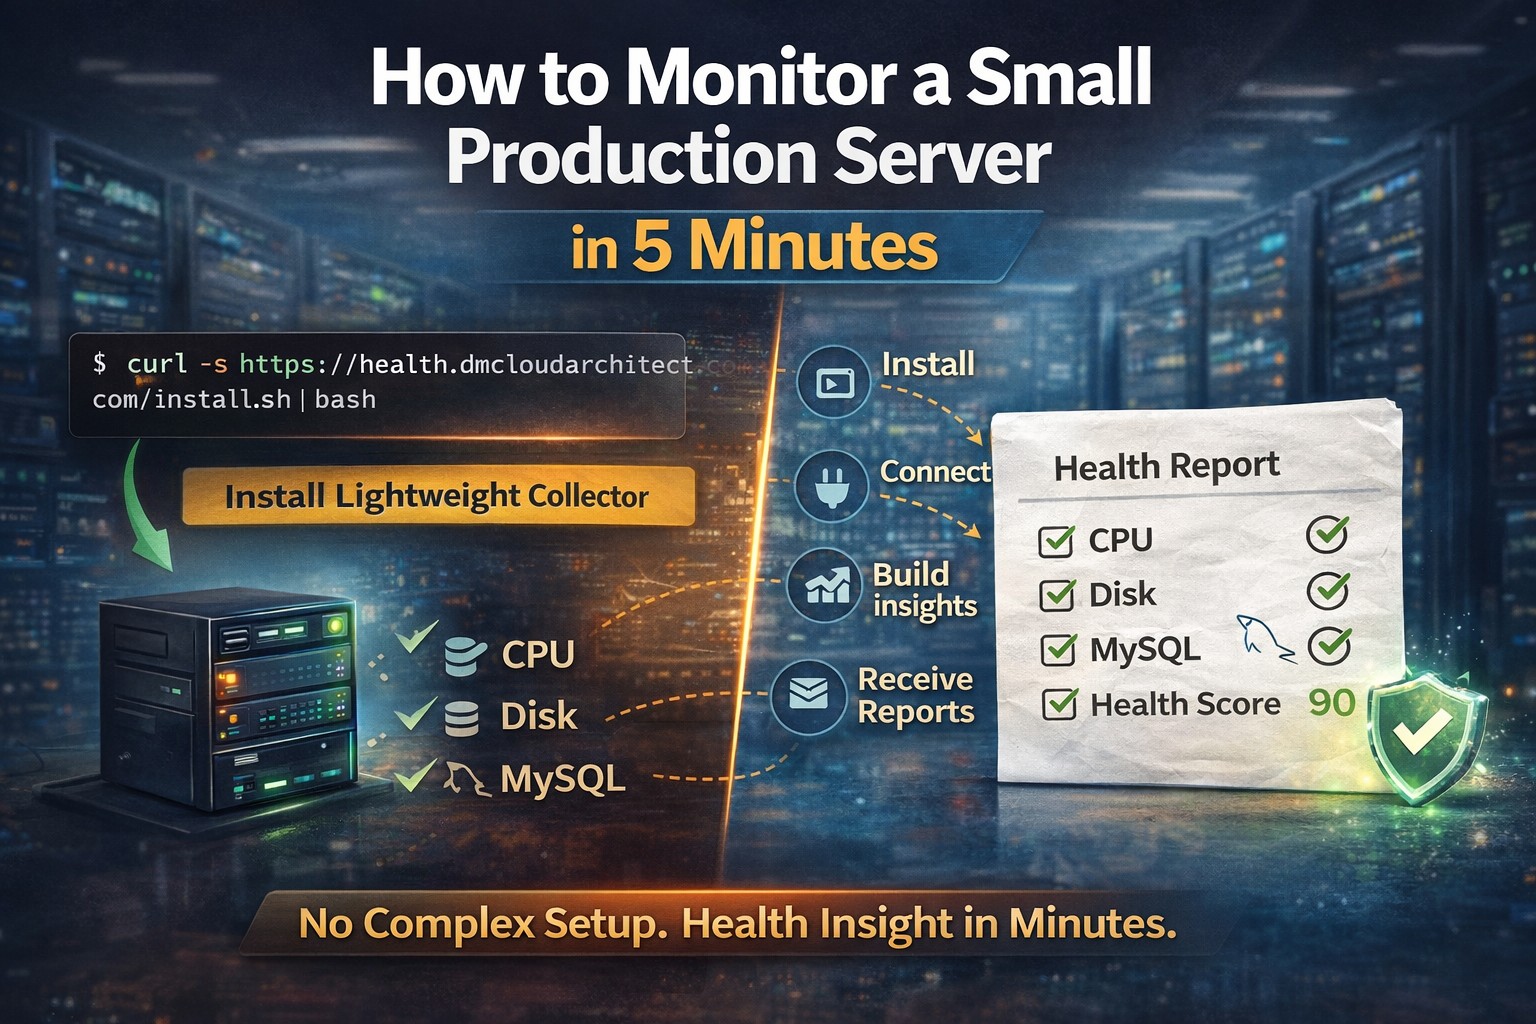
What a Good Health Report Should Include
A useful infrastructure report should be simple and actionable.
1. System Health Overview
-
CPU usage trends
-
memory usage patterns
-
load behavior
2. Disk Growth and Risk
-
current usage
-
growth trend
-
risk of exhaustion
3. MySQL Health Indicators
-
connections and activity
-
workload trends
-
slow query signals
4. Risk Detection
-
unusual changes
-
increasing pressure
-
early warning signs
5. Clear Summary
-
what is healthy
-
what needs attention
-
what can be ignored
Why Weekly Works Better Than Constant Alerts
Weekly reporting changes how you manage infrastructure.
Instead of:
❌ reacting to noise
❌ chasing alerts
❌ guessing system health
You:
✅ understand trends
✅ make planned improvements
✅ prevent problems early
✅ reduce stress
This is especially important for:
-
solo developers
-
consultants
-
small teams
-
business owners
Real Example: Catching Problems Early
With weekly reporting, you might notice:
-
disk growing faster than expected
-
MySQL connections increasing week-over-week
-
slow queries becoming more frequent
-
CPU peaks happening more often
None of these trigger immediate alerts.
But together, they show:
👉 a system moving toward risk
This is where action is most effective.
Designed for Small Linux and MySQL Environments
This is exactly the model behind DMCloudArchitect Health.
Instead of dashboards and alert storms, it provides:
-
structured weekly health reports
-
trend-based infrastructure insight
-
early detection of degradation
-
simple, readable summaries
Built specifically for:
-
small production environments
-
solo developers
-
consultants managing servers
-
small business infrastructure
Monitoring Without Alert Fatigue
The goal is not to eliminate monitoring.
The goal is to make it useful.
That means:
-
fewer alerts
-
more insight
-
less noise
-
better decisions
Final Thoughts
Monitoring should help you understand your system — not overwhelm you.
For small Linux and MySQL environments, a weekly infrastructure health report provides the right balance:
-
enough visibility to stay in control
-
without the complexity of large monitoring systems
Try Weekly Infrastructure Health Monitoring
If you want a simpler way to monitor your servers without alert fatigue:
👉 https://health.dmcloudarchitect.com
Get structured weekly infrastructure health reports designed for small environments.