Monitoring infrastructure sounds simple until you actually try to implement it. Suddenly you're dealing with complex tools, noisy alerts, and dashboards that no one checks. For small teams and growing environments, this quickly becomes a burden instead of a benefit.
That’s where easy infrastructure monitoring matters. The goal isn’t to track everything — it’s to track the right things, in a way that’s reliable, low maintenance, and actually useful in day-to-day operations.
Why Simple Monitoring Matters More Than Complex Setups
Many teams overbuild their monitoring stack early on. They deploy multiple tools, enable every metric, and configure dozens of alerts. It looks impressive, but it’s rarely sustainable.
A simple monitoring system focuses on:
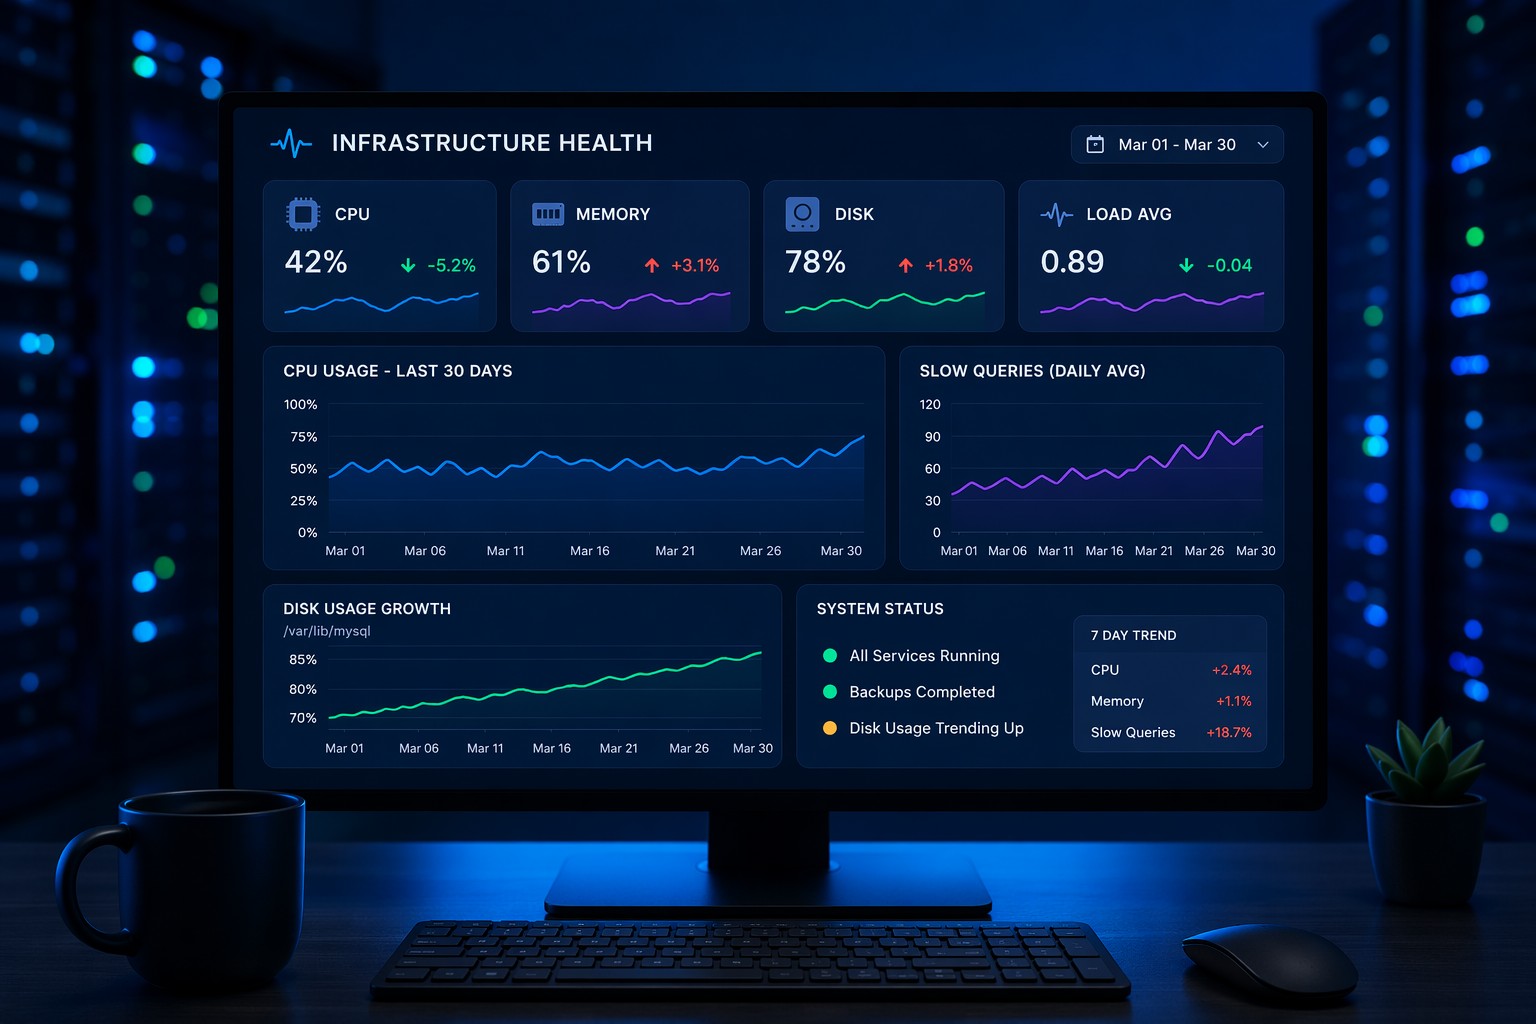
- Core system health (CPU, memory, disk)
- Service availability
- Basic performance indicators
- Clear, actionable alerts
This approach reduces noise and keeps your attention on what actually impacts uptime and performance.
What Easy Infrastructure Monitoring Looks Like
Easy doesn’t mean basic — it means intentional. A well-designed setup removes unnecessary complexity while still giving you visibility where it matters.
1. Start With Core Metrics Only
Focus on the fundamentals first:
- CPU utilization trends
- Memory usage and swap behavior
- Disk space and I/O activity
- Network traffic basics
You don’t need hundreds of metrics to understand system health. These alone can detect most real-world issues.
2. Monitor Services, Not Just Servers
Infrastructure health isn’t just about the server — it’s about what’s running on it. A practical server monitoring setup always includes service checks.
Examples:
- Web server responding on port 80/443
- Database accepting connections
- Background jobs running on schedule
This is where many setups fail. Systems look healthy, but services are down.
3. Keep Alerts Minimal and Meaningful
Alert fatigue is real. If everything triggers an alert, nothing gets attention.
Good monitoring without complexity means:
- Only alerting on real problems
- Avoiding overly sensitive thresholds
- Grouping related alerts
A simple rule: if an alert doesn’t require action, it shouldn’t exist.
4. Use Lightweight, Low Maintenance Tools
Choose tools that are easy to deploy and maintain. Avoid solutions that require constant tuning or heavy infrastructure just to run monitoring itself.
Low maintenance monitoring keeps your focus on systems, not the monitoring stack.
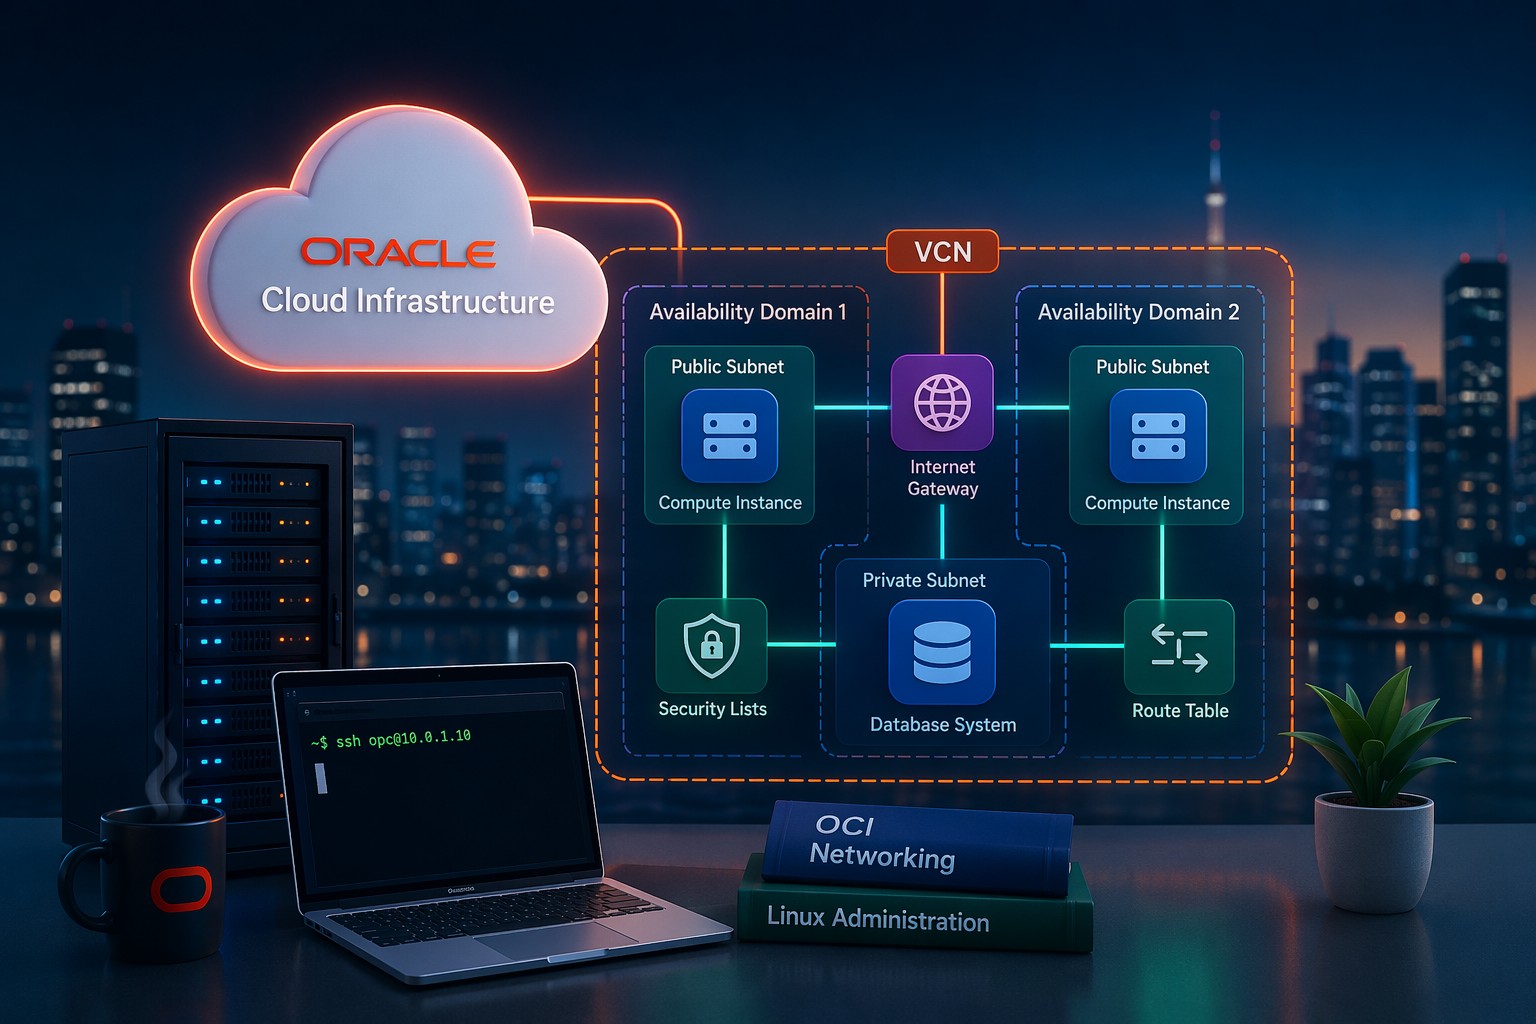
Practical Example: Small OCI Deployment
Consider a typical small Oracle Cloud setup:
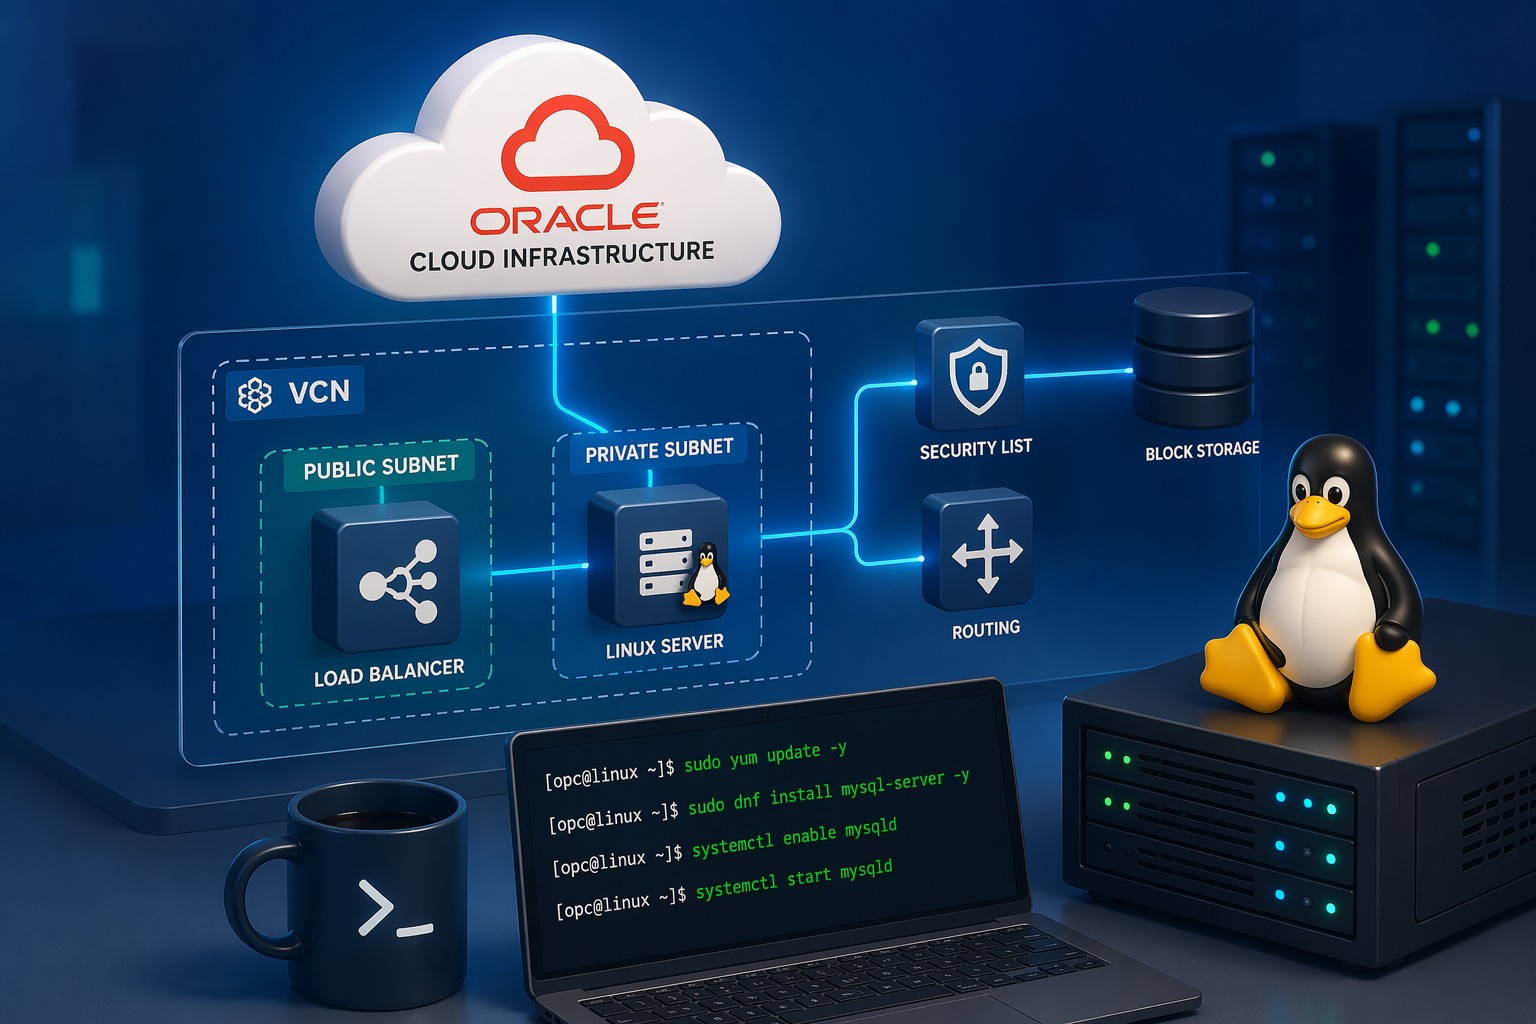
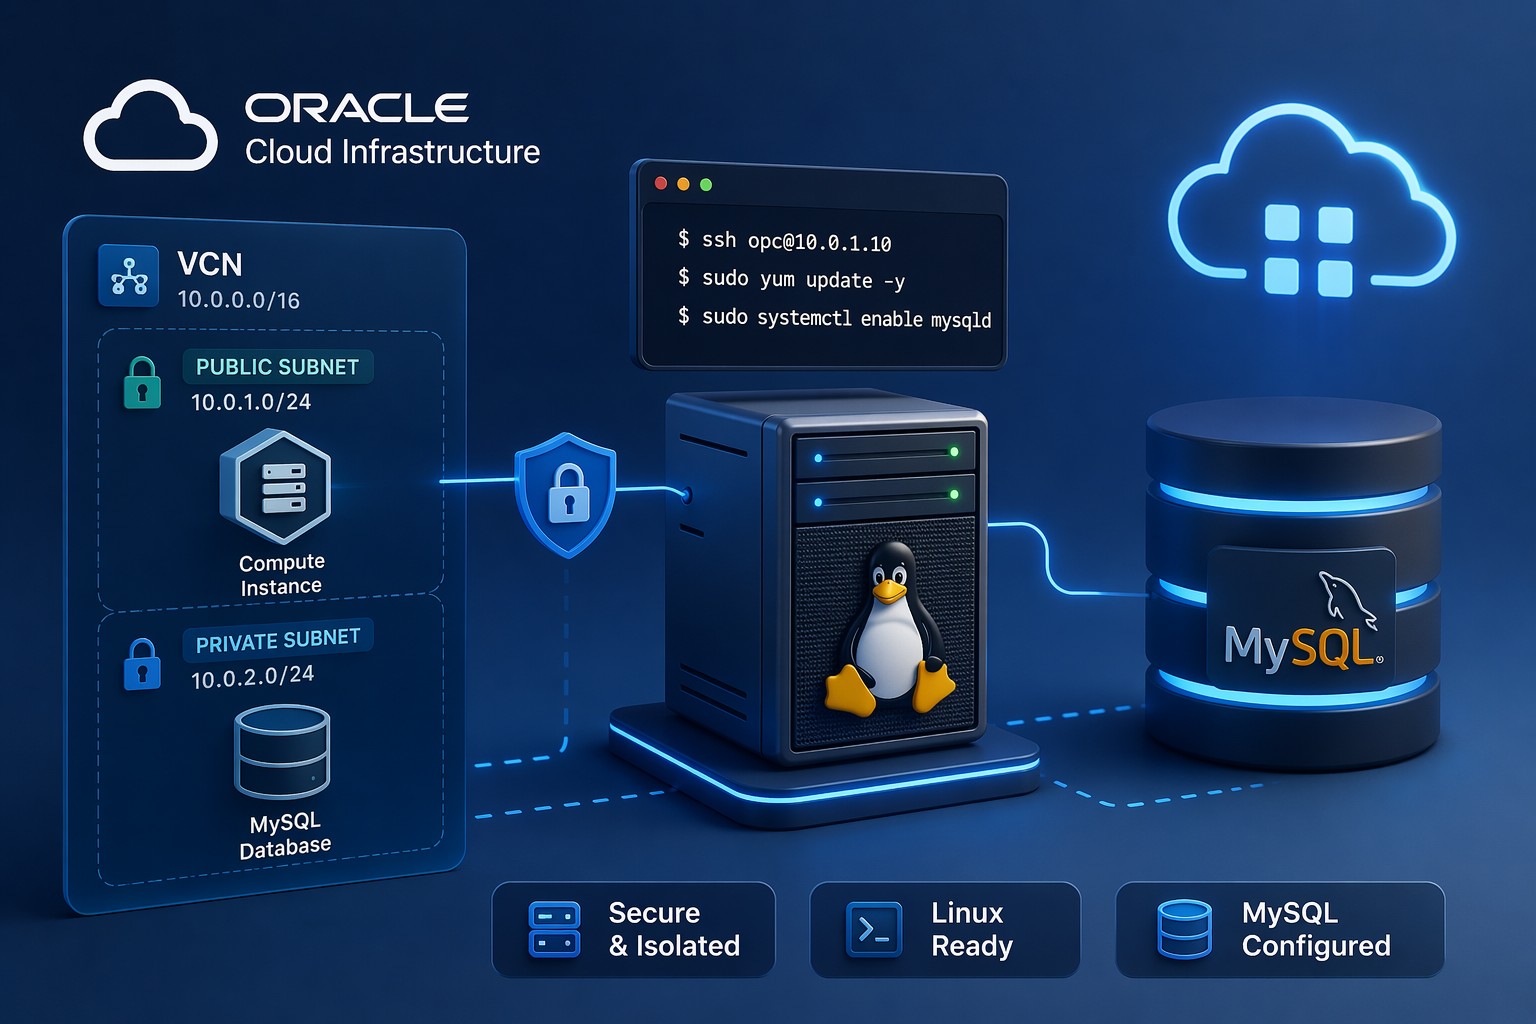
- One compute instance running a Linux application server
- A MySQL database on the same or separate instance
- Basic VCN with public and private subnets
A simple ops monitoring approach here would include:
- CPU and memory alerts for the compute instance
- Disk usage thresholds (especially for database storage)
- Service checks for the application and MySQL
- Basic uptime checks from outside the network
This setup covers the most common failure scenarios without introducing unnecessary complexity.
Common Mistakes to Avoid
- Monitoring everything from day one – start small and expand only when needed
- Ignoring alert tuning – default thresholds often create noise
- Overcomplicating dashboards – simple views are more actionable
- Forgetting maintenance – monitoring systems need periodic review
How to Keep Monitoring Simple Long-Term
Here’s the key: simplicity isn’t a one-time decision — it’s an ongoing discipline.
- Review alerts monthly and remove noise
- Add new checks only when you see real gaps
- Keep dashboards focused on operational decisions
- Document what each alert means and how to respond
Over time, this creates a monitoring system that evolves with your infrastructure without becoming unmanageable.
Summary
Easy infrastructure monitoring is about clarity, not compromise. By focusing on core metrics, meaningful alerts, and low maintenance tools, you get a system that actually supports operations instead of overwhelming them.
If you want a simpler way to keep track of infrastructure health without building a complex monitoring stack, you can Sign Up Now and start with a streamlined approach designed for real-world environments.