Introduction
If you're running Linux servers in a small or mid-sized environment, you've probably faced this dilemma: Prometheus feels too heavy, Grafana requires time you don’t have, and enterprise tools are overkill.
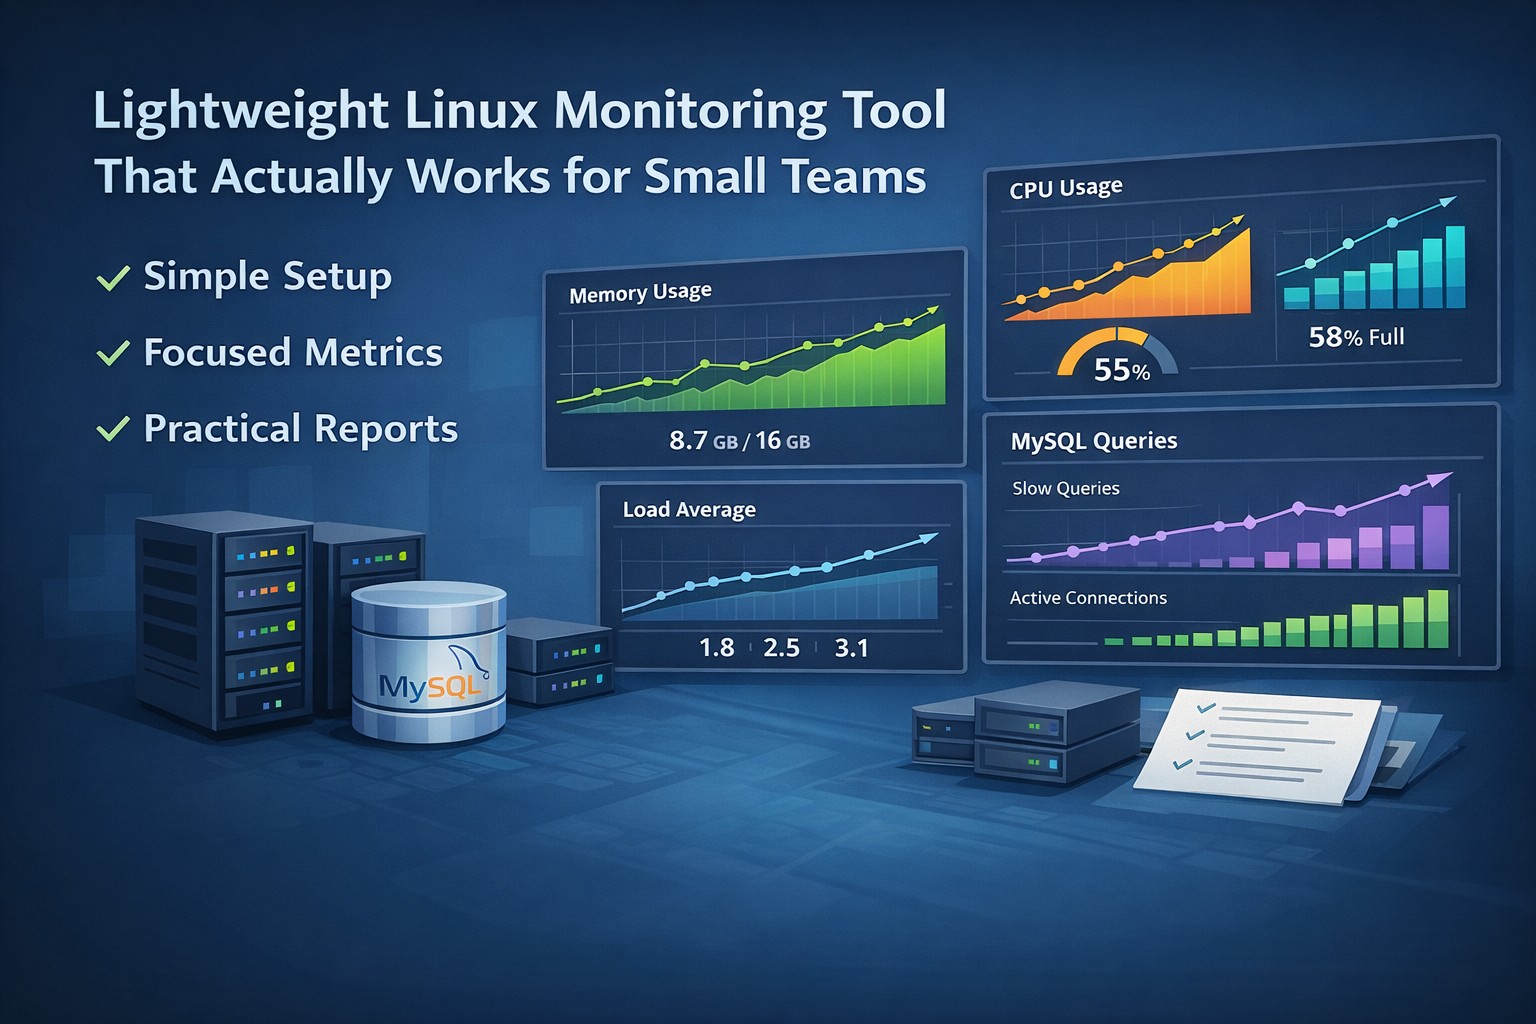
You don’t need more dashboards—you need clear, actionable insight without complexity. That’s where a lightweight Linux monitoring tool makes a real difference.
Why Most Monitoring Setups Fail Small Teams
Modern monitoring stacks are powerful but come with high setup and maintenance overhead, too many metrics, and alert fatigue.
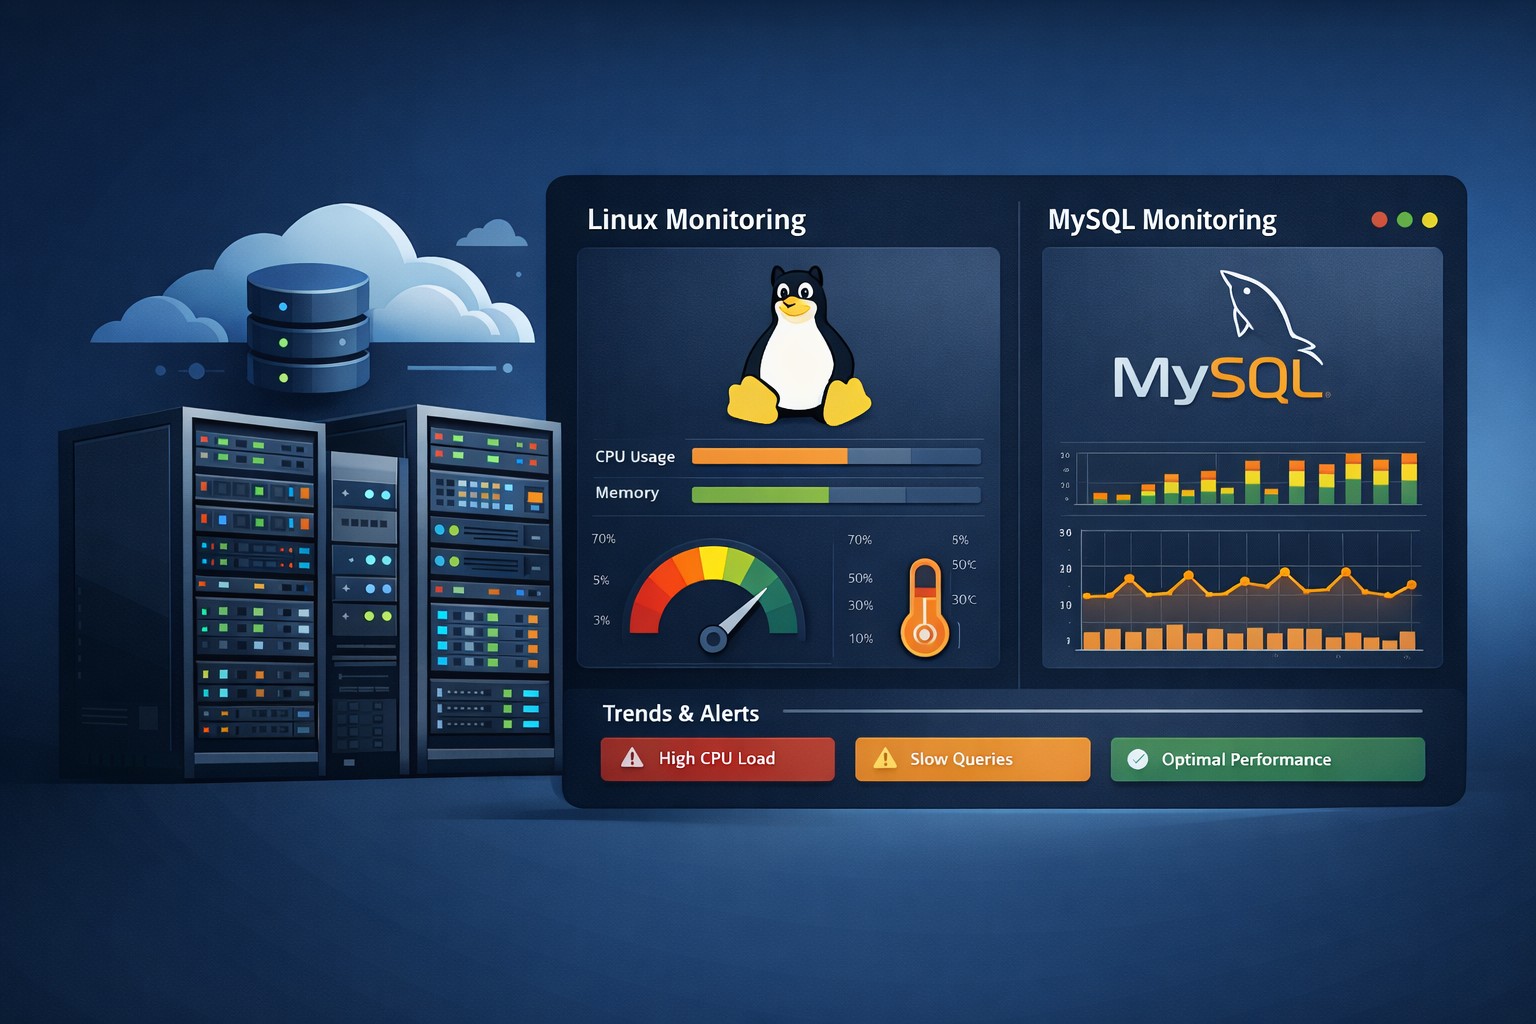
What “Lightweight” Monitoring Really Means
A lightweight Linux monitoring tool focuses on meaningful metrics, minimal setup, and trend-based insights instead of real-time noise.
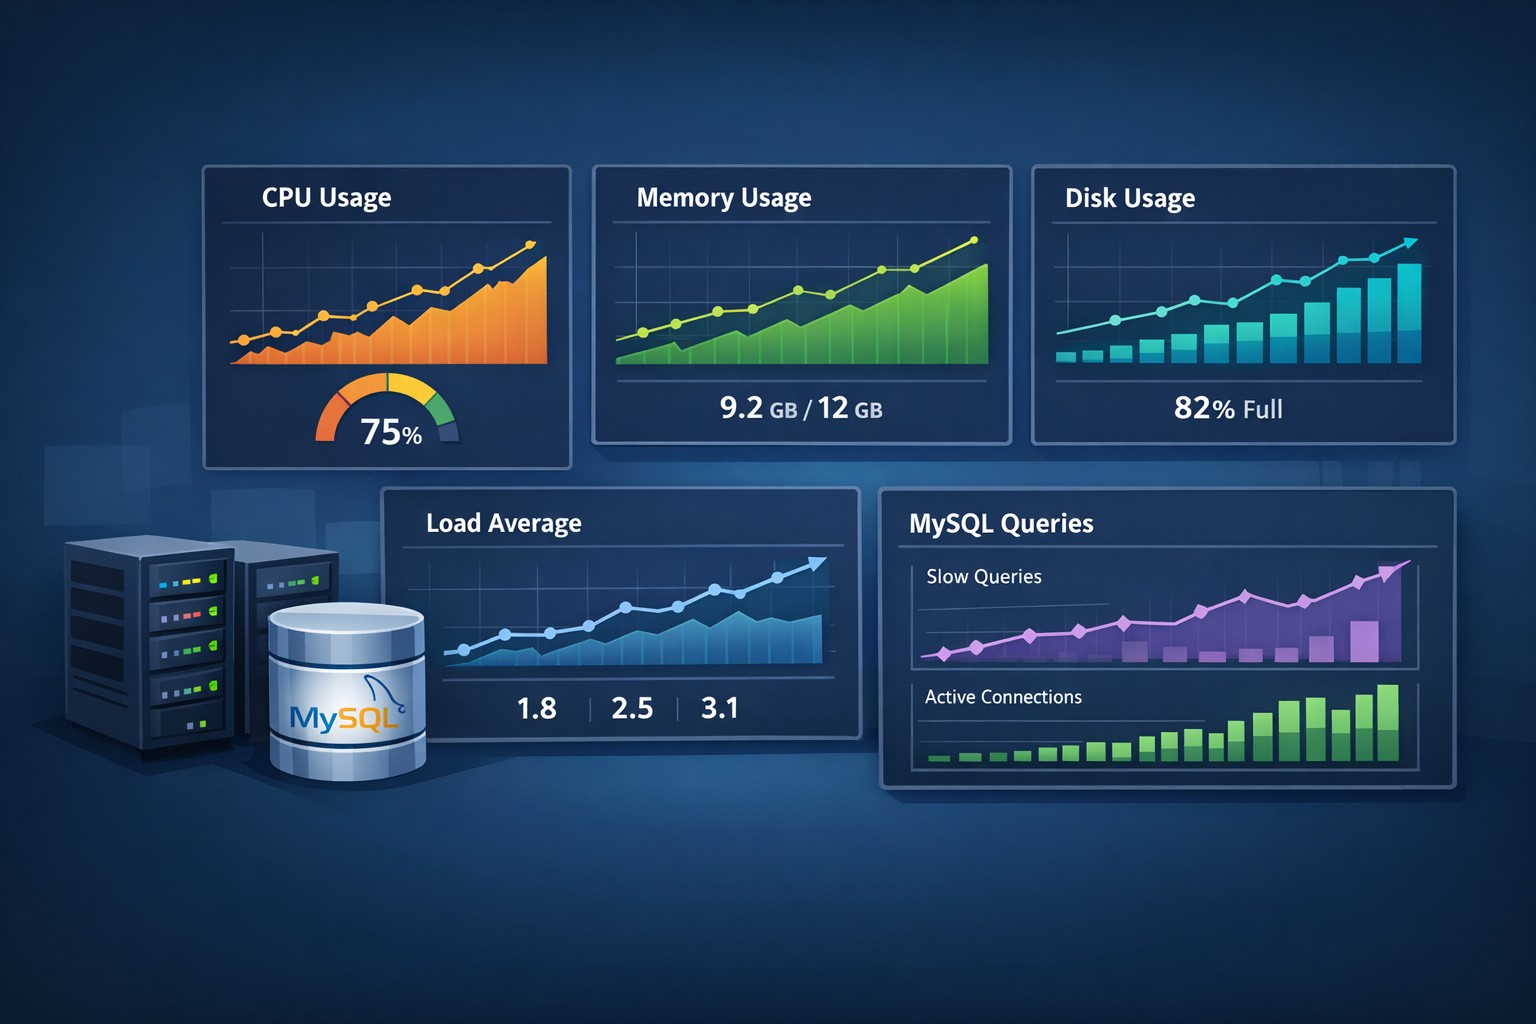
Core Metrics That Matter Most
- CPU trends
- Memory behavior
- Disk growth
- Load average
- MySQL metrics
Real-World Scenario
A small team identified disk growth, rising CPU, and slow queries early using a simple monitoring setup, preventing outages.
Minimal Linux Monitoring Setup
- Collect daily snapshots
- Store historical data
- Generate weekly reports
- Focus on changes
Summary
You don’t need a complex stack to monitor Linux effectively. A lightweight Linux monitoring tool gives you clear trends and actionable insights. For a structured approach, Infrastructure Health Reporting from DMCloudArchitect helps you stay ahead without added complexity.