A Linux fleet can cross from “simple” to “messy” quietly. One month, rsyslog and logrotate feel predictable. A few growth cycles later, new hosts are missing rotation rules, a central syslog box is overloaded during peak flushes, and no one is completely sure whether every server is forwarding the logs needed for the next incident.
That does not always mean you need a giant platform migration tomorrow. It does mean your linux server monitoring needs a log management checklist that covers collection, rollout consistency, buffering, retention, and review. Use the checklist below to stabilize the basics before choosing whether Loki, Elasticsearch, object storage, or a hybrid design should carry the long-term workload.
1. Inventory What Logs You Actually Depend On
Start with the logs that matter during real support and outage work. For most growing fleets, that means authentication events, sudo usage, systemd service failures, kernel messages, web server errors, application exceptions, deployment output, database errors, backup jobs, and security tooling alerts.
For each log source, record the producing service, file path or journald unit, expected format, owner, sensitivity level, and the question it helps answer. If a log stream has no owner and no operational purpose, it should not automatically receive the same retention and indexing budget as security or customer-facing application logs.
This inventory also exposes blind spots. If your team cannot quickly answer which logs prove a successful deployment, a failed SSH login, or a disk-related service crash, the problem is not just tooling. The problem is that the fleet has not defined what “observable enough” means.
2. Standardize Collection Before Debating Storage
It is tempting to jump straight into Loki versus Elasticsearch versus another backend. But storage decisions are much easier after collection is consistent. A fleet with uneven agents, mismatched config versions, and missing metadata will feel unreliable no matter where the logs land.
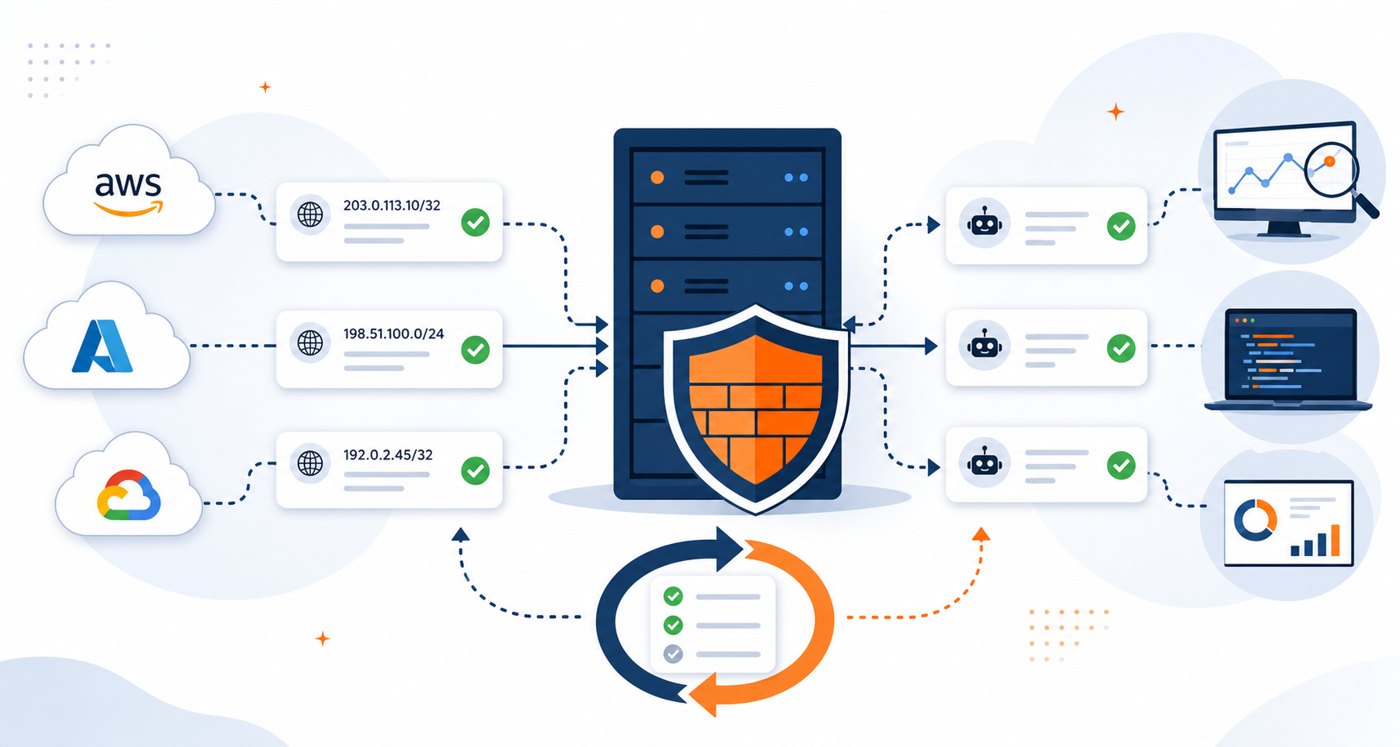
Choose one standard collection path for each server class. That could be rsyslog forwarding, Promtail, Filebeat, Vector, Fluent Bit, or another agent. The specific tool matters less than having a repeatable baseline: installed by automation, version pinned or tracked, configured from source control, and checked after every host provision.
Every event should carry enough metadata to be useful: environment, host, role, service, region or data center, and severity when available. Keep high-cardinality values such as request IDs, session IDs, and user IDs in the log body or fields, not as Loki labels that can damage performance.
3. Make New Host Enrollment Automatic
Log drift often starts when new servers are provisioned faster than the monitoring checklist is updated. A host joins the fleet, the application works, but forwarding, rotation, or retention rules are missing. Weeks later, the team discovers the gap during an incident.
Use your configuration management system to treat log enrollment as a required part of server creation. Ansible, Salt, Puppet, Terraform provisioners, cloud-init, or golden images can all work if they produce the same outcome: the agent is installed, the config is present, the service is running, and a test event reaches the expected destination.
Add a post-provision check. For example, a new server should not be considered production-ready until it has sent a heartbeat, one synthetic test log line, and its key system logs to the central platform. This small gate prevents “mostly configured” hosts from becoming silent during the exact week you need them most.
4. Separate Rotation, Buffering, and Shipping Responsibilities
Traditional logrotate protects local disks, but it is not a full log delivery strategy. If a server rotates or compresses a file before the shipper reads it, data can be delayed or missed. If hundreds of hosts flush at the same time, a central receiver can be hammered even though each individual host looks healthy.
Define clear responsibilities. Local rotation should protect host disk usage. The shipper should track offsets, survive restarts, and buffer when the destination is slow. The receiver or pipeline should absorb bursts, apply backpressure, and expose metrics when it falls behind.
For larger fleets, consider local or regional aggregation. A regional Vector, Fluent Bit, or syslog relay layer can smooth bursts, add metadata, perform safe filtering, and reduce pressure on the final backend. This is often less risky than forcing every server to talk directly to one central system across every network path.
5. Design Retention by Log Value, Not by Habit
One global retention setting is simple, but it gets expensive and noisy. Authentication logs, audit events, payment-impacting application errors, and database failure logs may deserve longer retention. Debug logs, health check noise, and repetitive successful request logs may only need days.
Create three retention classes. Critical logs get longer retention, tighter access control, and possibly immutable archive. Operational logs get enough retention for recent incident review and trend analysis. Low-value high-volume logs get short retention, sampling, or archive-only treatment.
This classification helps any backend. Loki becomes more predictable because labels and retention are intentional. Elasticsearch costs become easier to control because not everything is indexed forever. Object storage becomes useful for cheap archive instead of a dumping ground no one knows how to query.
6. Pick Backends by Workflow
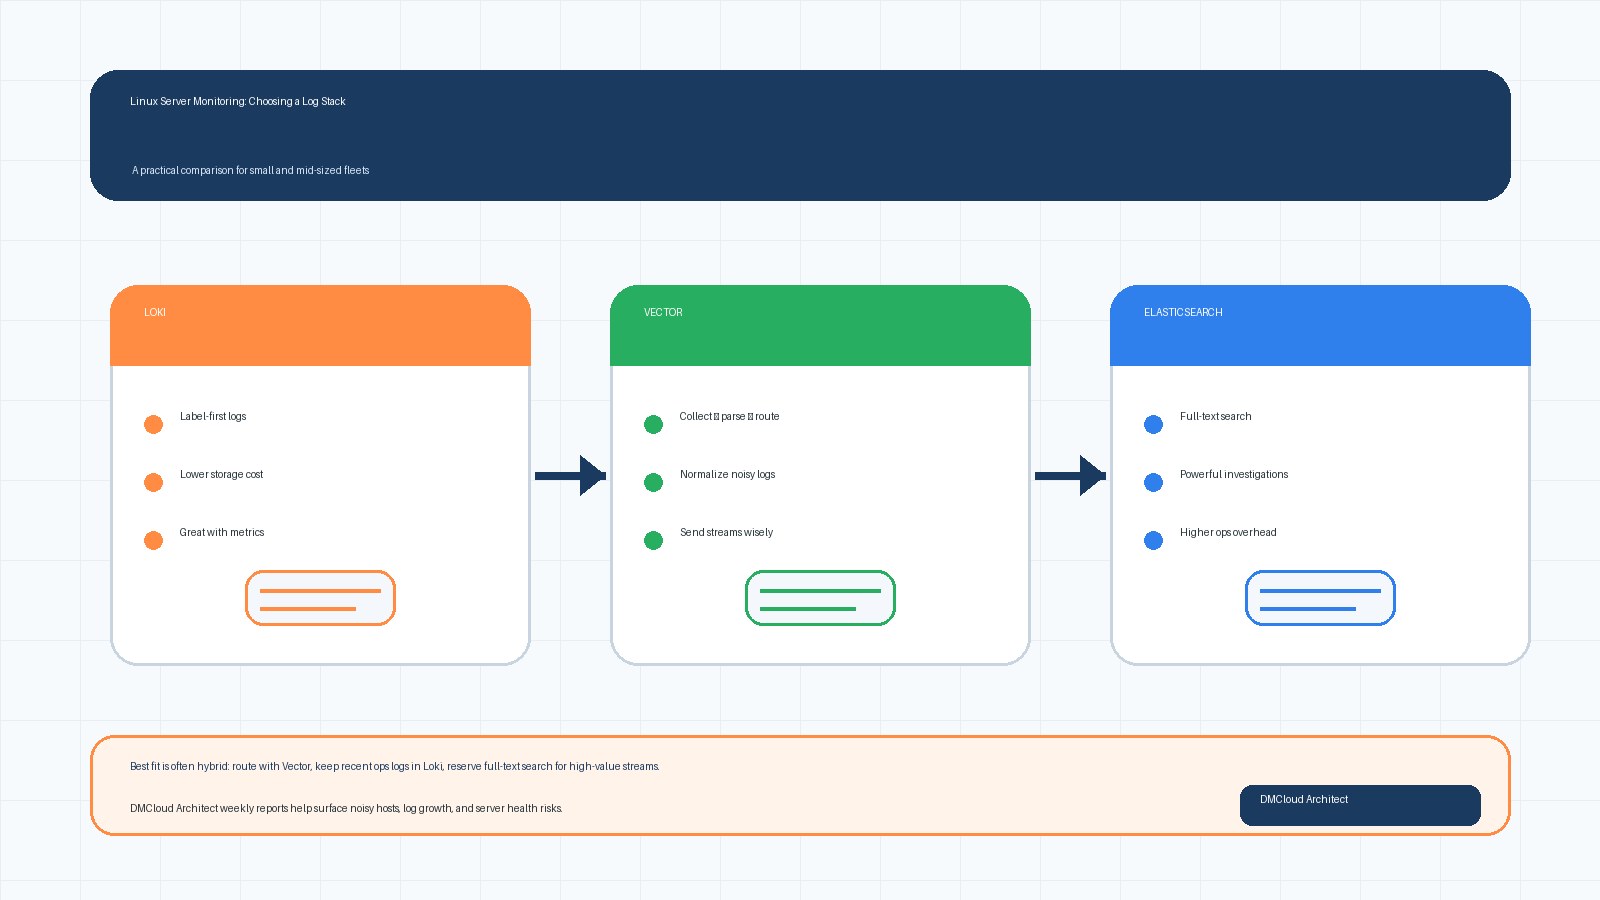
Loki is a strong fit when teams usually start with labels such as environment, service, host group, and time window. It works well alongside Prometheus and Grafana because metrics can point responders to the right slice of logs. The main discipline is label design: useful labels, but not unique values that explode cardinality.
Elasticsearch is still valuable when broad full-text search is central to support or incident workflows. If responders frequently search arbitrary exception text, request fragments, customer identifiers, or older unstructured logs, full indexing can save time. The trade-off is storage cost and cluster operations.
Many growing fleets land on a hybrid answer. Keep recent operational logs in Loki or Elasticsearch, route selected high-value streams to longer retention, and archive lower-value or compliance logs separately. A pipeline tool such as Vector or Fluent Bit can make that routing decision explicit instead of sending every byte to the most expensive place.
7. Monitor the Logging System Itself
Your logging pipeline is production infrastructure. It needs alerts, dashboards, and weekly review just like databases, web servers, and load balancers. Otherwise, the first sign of trouble may be the absence of logs during an outage.
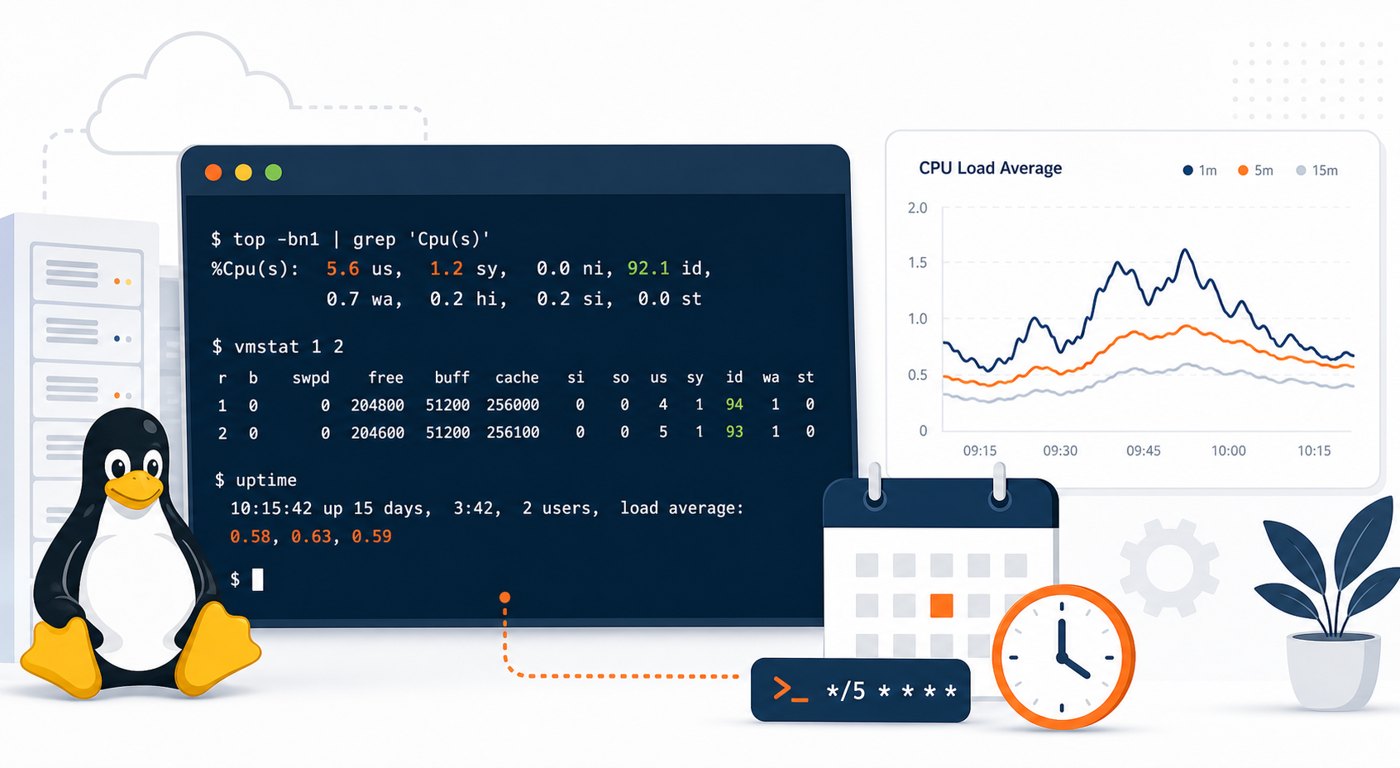
Track agent health, dropped events, retry counts, buffer usage, receiver latency, ingest volume, backend disk pressure, query latency, and retention policy errors. Also track sudden changes: one host that stops sending logs, one service that becomes unusually noisy, or one data center that starts buffering more than normal.
These checks turn linux server monitoring into a feedback loop. Instead of discovering a missing logrotate rule three months later, you see that a newly provisioned group is not matching the expected log baseline this week.
8. Review Config Drift Weekly
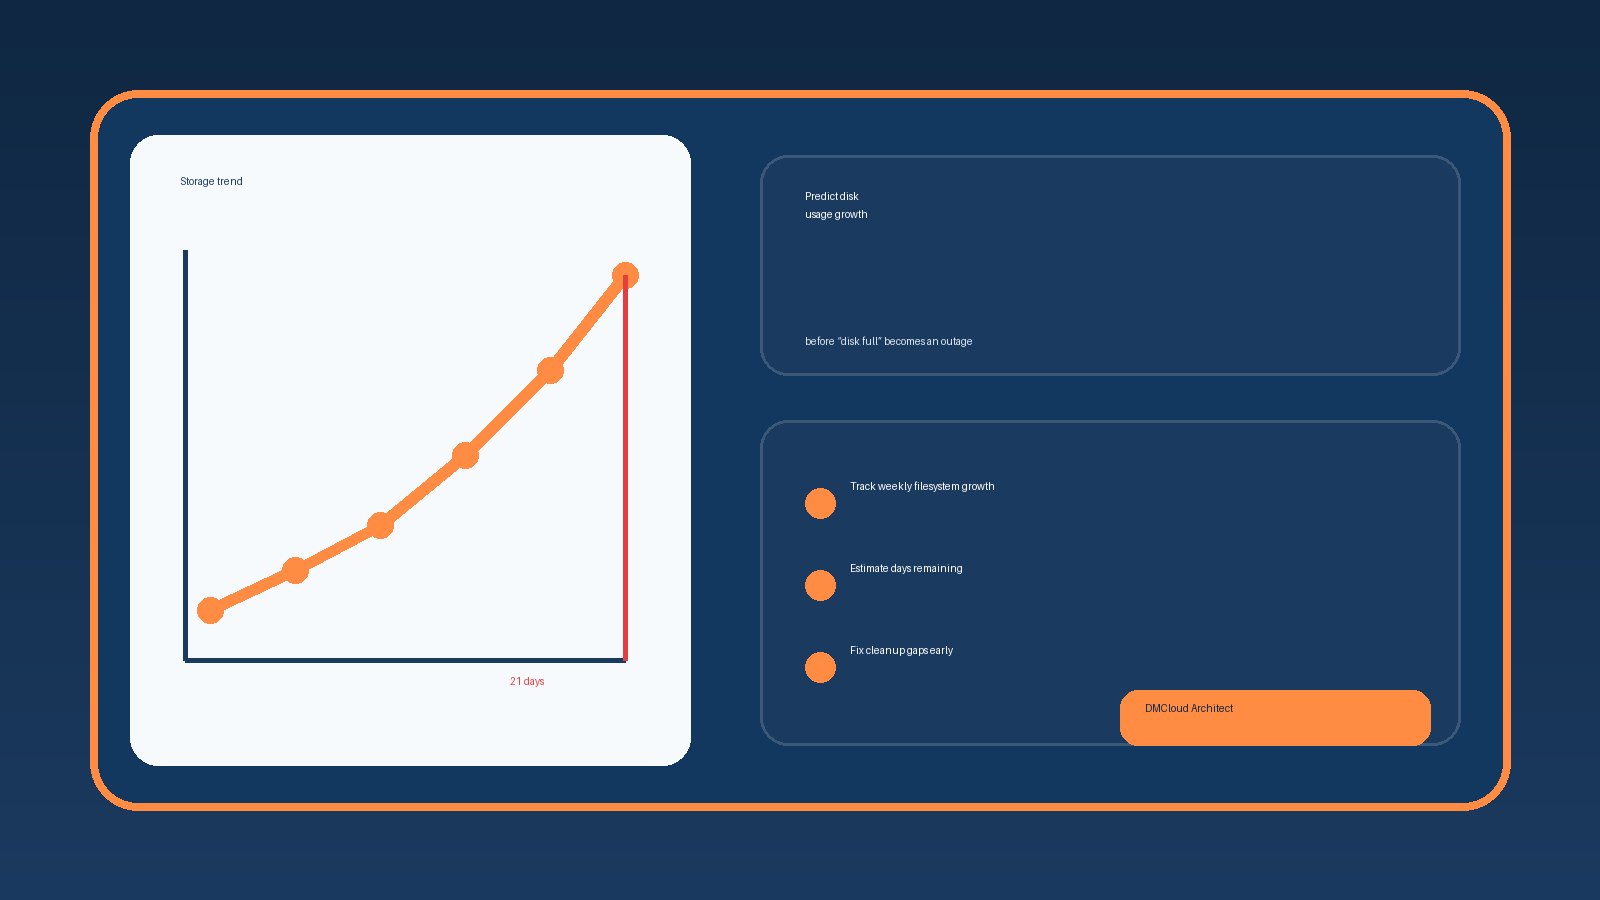
At a few hundred servers, config drift is not a rare exception. It is a normal operational risk. Build a weekly check that compares intended logging configuration against reality: installed agent version, running service state, config checksum, destination endpoint, rotation policy, and last successful delivery time.
This review does not need to be fancy at first. A report that lists missing agents, stale configs, quiet hosts, oversized local log directories, and unusual ingest spikes is enough to trigger useful maintenance. The point is to catch drift before the next incident turns it into a root-cause footnote.
9. Test Failure Modes Before You Need Them
A logging design is only trustworthy if you know what happens when parts fail. What does the agent do when the network is down? How much can it buffer locally? What happens when the central endpoint is slow? Are compressed rotations still read? Can a regional relay restart without losing offsets?
Run controlled tests on non-critical hosts. Stop the destination briefly, generate logs, restore connectivity, and confirm delivery. Force rotation and confirm the shipper continues from the right offset. Restart agents and aggregators. Check whether alerts fire when delivery falls behind.
Document the results in plain language. Developers and small business owners do not need every internal setting, but they do need confidence that the system fails predictably and recovers without silent data loss.
10. A Practical 30-Day Improvement Plan
Week one: inventory critical logs, define required metadata, and identify hosts with missing or inconsistent forwarding. Week two: standardize agent installation and create a post-provision test event. Week three: define retention classes and reduce obvious noise. Week four: add weekly drift reporting and test one failure scenario.
This plan avoids the trap of turning log management into a never-ending platform rewrite. It gives your team visible improvements while preserving room for a later backend decision. By the end of the month, you should know which logs matter, which hosts are drifting, which backend costs are growing, and where automation will save the most time.
Summary
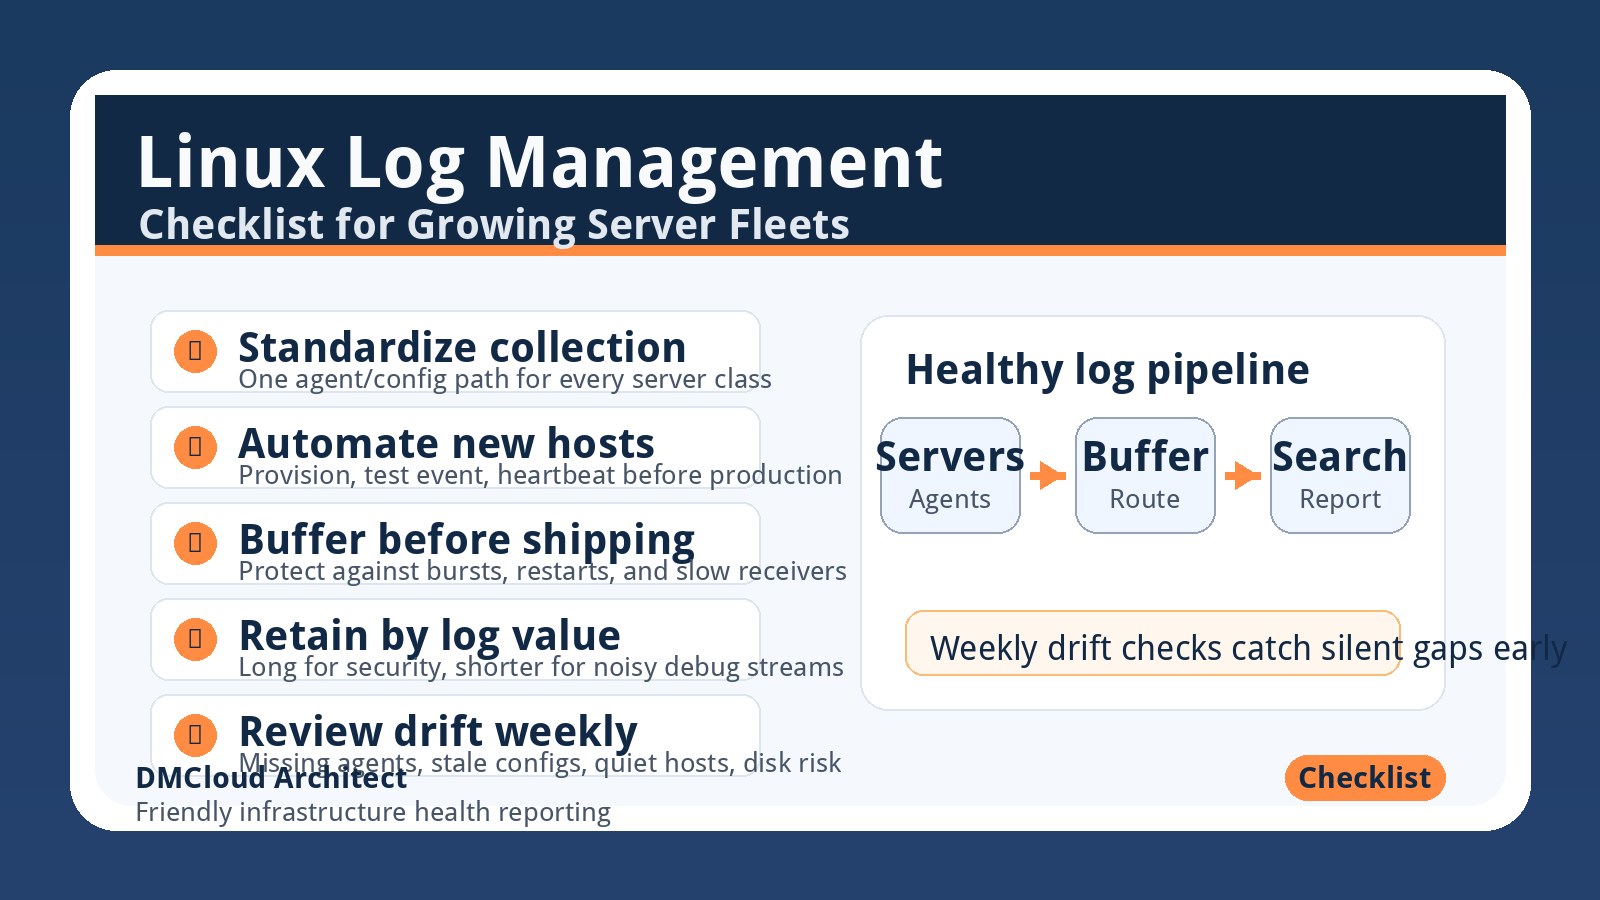
Growing Linux fleets need more than rsyslog and logrotate on autopilot, but they do not always need a rushed migration to the biggest observability stack either. Start by standardizing collection, automating host enrollment, separating buffering from rotation, designing retention by value, and reviewing drift every week.
Once those basics are in place, the backend decision becomes clearer. Loki, Elasticsearch, object storage, and hybrid pipelines all work better when the fleet sends consistent, useful, well-classified logs. That is the foundation of practical linux server monitoring.
If you want a simple weekly check for noisy hosts, missing log forwarding, disk pressure, and other server health risks, use Get the free starter plan for weekly infrastructure health reports and catch small infrastructure issues before they become urgent.