Introduction: Why CPU Spikes Aren’t the Real Problem
Most Linux administrators notice CPU issues only when something breaks—slow applications, lagging queries, or overloaded systems. But by the time CPU spikes are visible in real time, the underlying problem has often been building for days or even weeks.
This is where understanding cpu usage trends linux becomes critical. Instead of reacting to isolated spikes, you can see how CPU behavior evolves over time and catch problems early.
Why CPU Usage Trends Matter
Looking at a single CPU snapshot doesn’t tell you much. A server running at 85% CPU might be normal during peak hours. But if that same server used to average 40% just a month ago, you’re dealing with a growing issue.
Trend-based monitoring helps you:
- Identify gradual performance degradation
- Spot capacity limits before outages occur
- Understand workload growth patterns
- Correlate CPU behavior with deployments or traffic changes
What to Track Over Time
To effectively monitor CPU usage over time in Linux, you need more than just average usage. A few key metrics provide much deeper insight:
1. Average CPU Utilization
This is your baseline. Track daily and weekly averages to understand normal behavior and detect upward trends.
2. Peak CPU Usage
Short spikes may not matter, but increasing peak frequency often signals growing load or inefficient processes.
3. Load Average
Load average shows how many processes are waiting for CPU. If this rises steadily, your system may be under-provisioned.
4. CPU Wait Time (I/O Wait)
High CPU wait doesn’t always mean CPU pressure—it often points to disk or database bottlenecks.
5. Per-Process CPU Usage
Tracking which processes consume CPU over time helps identify problematic services, especially in MySQL-heavy environments.
How to Track CPU Utilization on a Linux Server
There are many tools available, but most only provide real-time data. Commands like top, htop, and mpstat are useful for immediate visibility but don’t help you track CPU usage history in Linux.
To build trends, you need to collect and store metrics over time. This typically involves:
- Scheduling periodic metric collection (every 1–5 minutes)
- Storing results in logs or a time-series database
- Aggregating data into hourly, daily, and weekly views
Even simple scripts combined with cron jobs can provide a basic historical view. However, without structured reporting, it becomes difficult to interpret long-term behavior.
Real-World Example: Gradual CPU Growth
Consider a MySQL server handling a growing application workload. At first, CPU usage averages around 35%. Over several weeks, this increases to 50%, then 65%.
No single spike triggers an alert. Everything appears stable in real time. But trend analysis reveals a clear pattern: the server is steadily approaching its limits.
Without tracking cpu growth trend server behavior, this issue might only be discovered when performance degrades or queries start timing out.
Common Causes Behind CPU Trends
When you observe rising CPU usage trends, the root cause is usually one of the following:
- Application growth or increased traffic
- Inefficient queries or missing indexes in MySQL
- Background jobs or cron tasks scaling up
- Resource contention across services
- Hardware limitations becoming visible under load
Trend data helps you separate temporary spikes from systemic issues.
From Monitoring to Decision-Making
Tracking cpu usage history linux is not just about visibility—it’s about making better operational decisions.
With clear trend data, you can:
- Plan infrastructure upgrades with confidence
- Optimize workloads before performance degrades
- Prioritize tuning efforts based on real impact
- Avoid emergency scaling and downtime
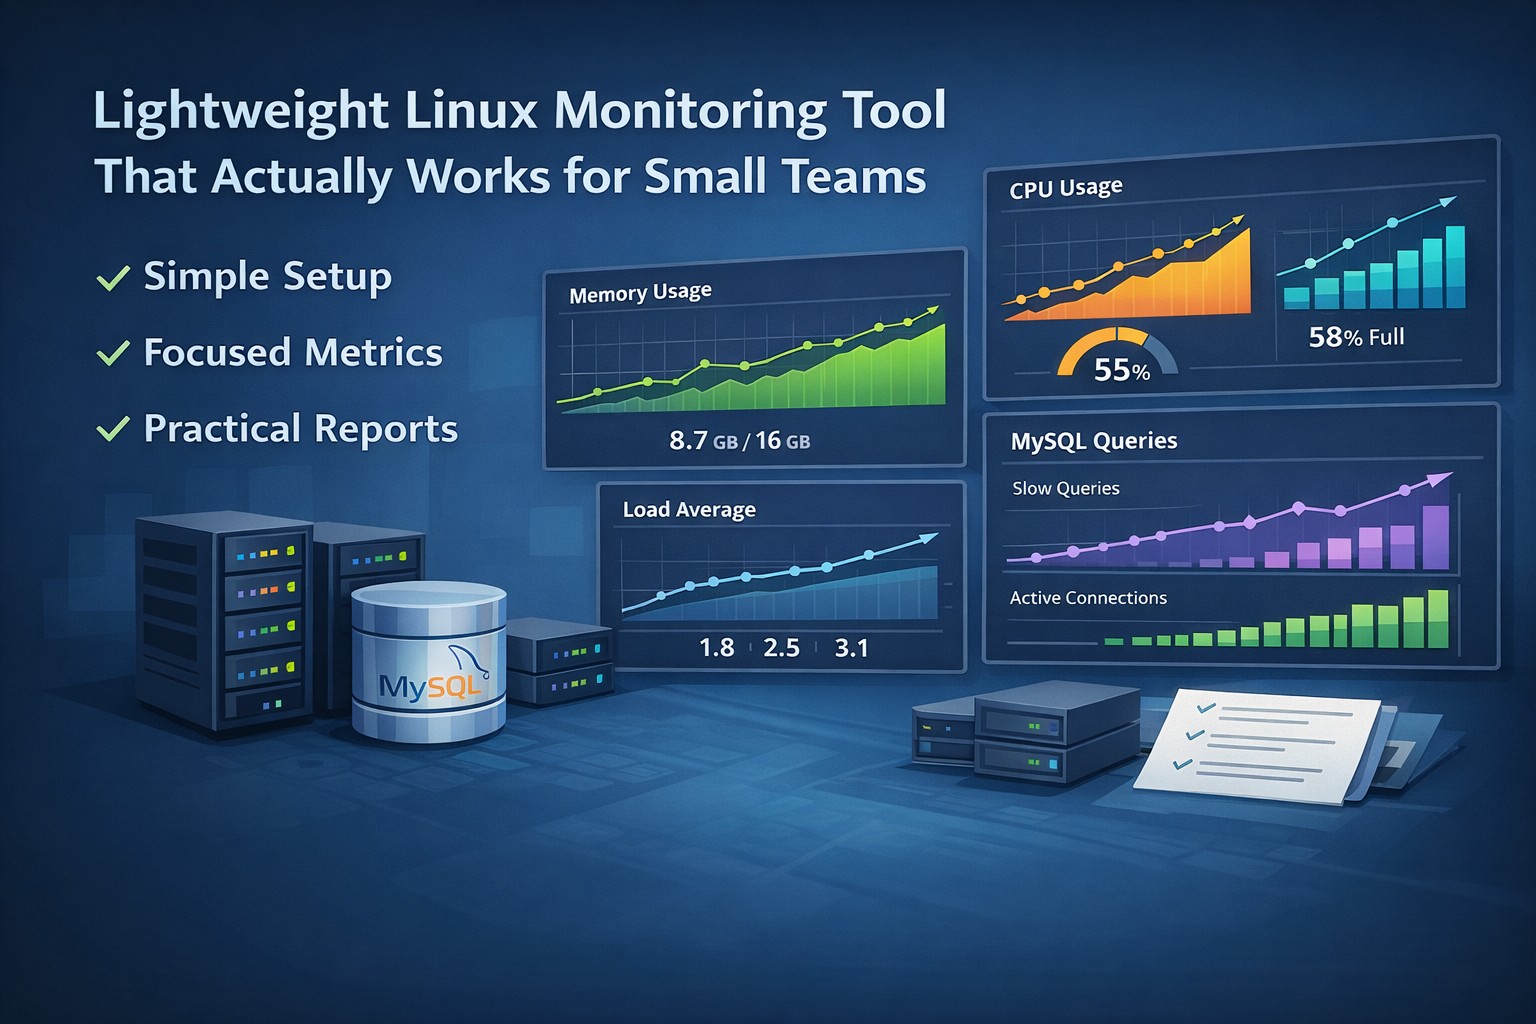
Why Lightweight Trend Reporting Works Better
Many teams adopt complex monitoring stacks that generate noise but fail to highlight long-term patterns. For smaller teams, a lightweight approach focused on trend reporting is often more effective.
Instead of reacting to alerts, you gain a clear weekly view of how CPU usage evolves across your servers.
Summary
Understanding cpu usage trends linux gives you a proactive edge. Instead of chasing spikes, you can identify patterns, predict capacity issues, and maintain stable performance over time.
If you want a simpler way to monitor cpu usage over time linux without building complex tooling, structured reporting can make a significant difference. Explore Infrastructure Health Reporting to see how trend-based visibility can help you stay ahead of performance issues.