Introduction
Most infrastructure issues don’t start as outages—they start as small, quiet signals. A disk slowly filling up. CPU usage creeping higher each week. MySQL queries taking slightly longer than usual.
The problem is that traditional monitoring rarely catches these early. Alerts are designed for thresholds, not trends. By the time something triggers, you’re already reacting instead of preventing.
This is where Linux server health trends become critical.
Why Trend-Based Monitoring Matters
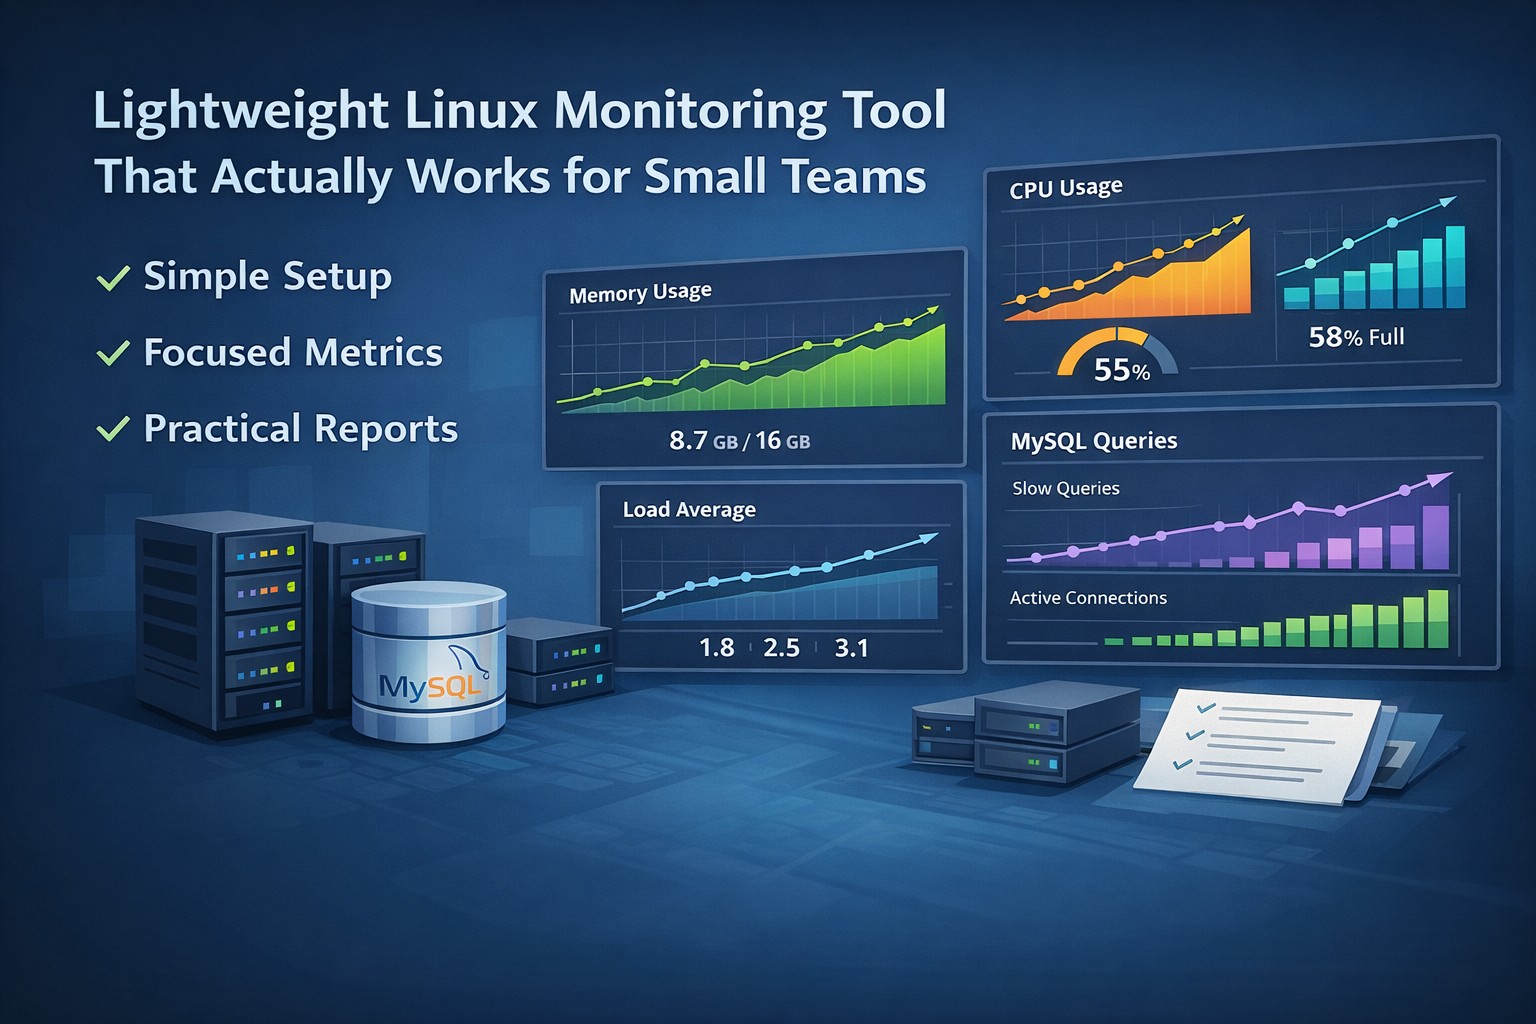
Reactive monitoring tells you when something is broken. Trend-based health reporting shows you how things are evolving over time, which is far more valuable for small teams managing growing infrastructure.
Instead of asking: “Is CPU above 90% right now?” you start asking: “Why has CPU increased 15% over the last 3 weeks?”
With trend visibility, you can predict capacity issues, identify inefficiencies early, and reduce firefighting.
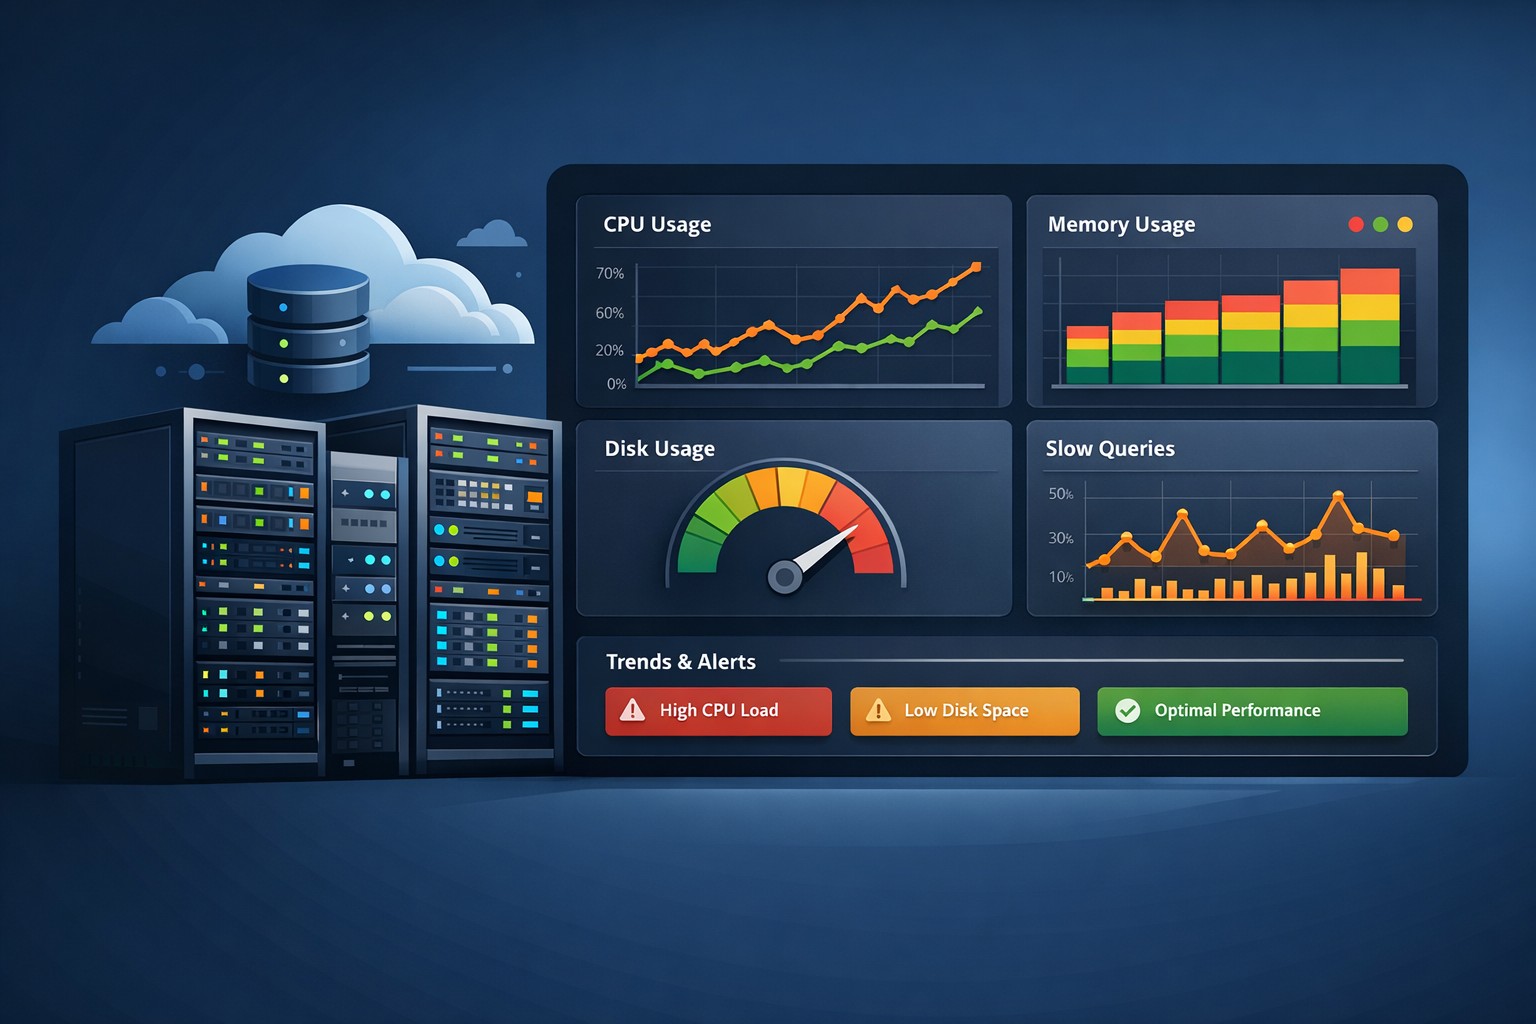
Key Linux Metrics That Reveal Trends
CPU Utilization Patterns
Watch for increasing baseline usage and reduced idle time.
Memory Consumption
Look for gradual increases and swap activity.
Disk Usage Growth
Track weekly growth rates and log expansion.
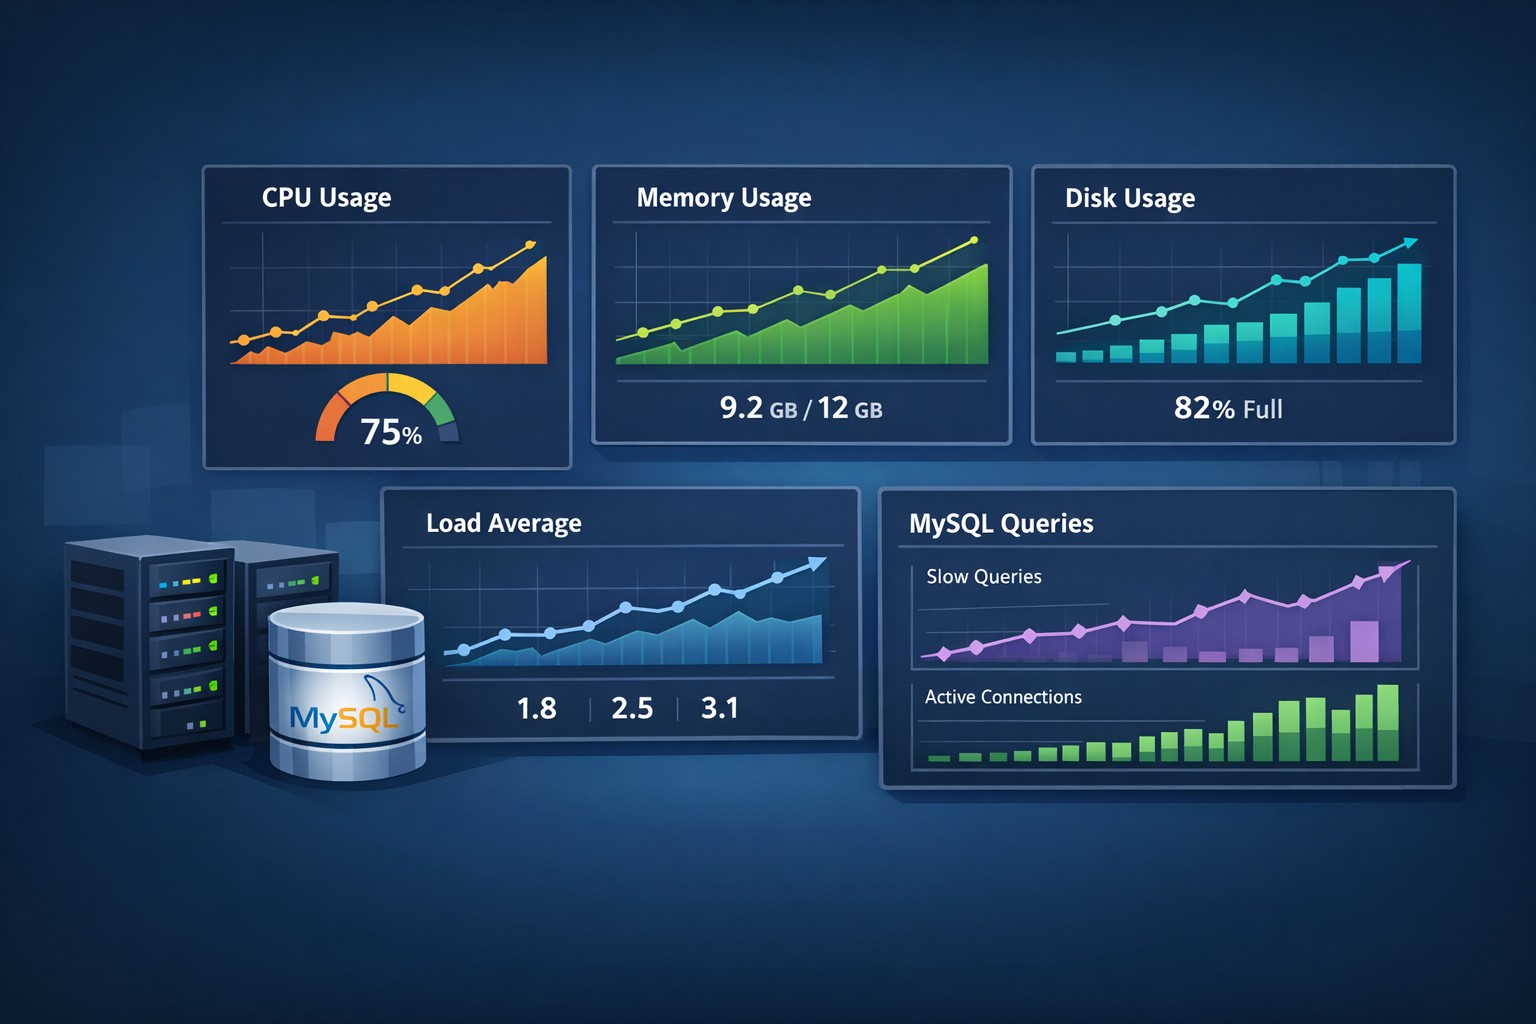
Load Average Trends
A rising trend can indicate scaling issues or contention.
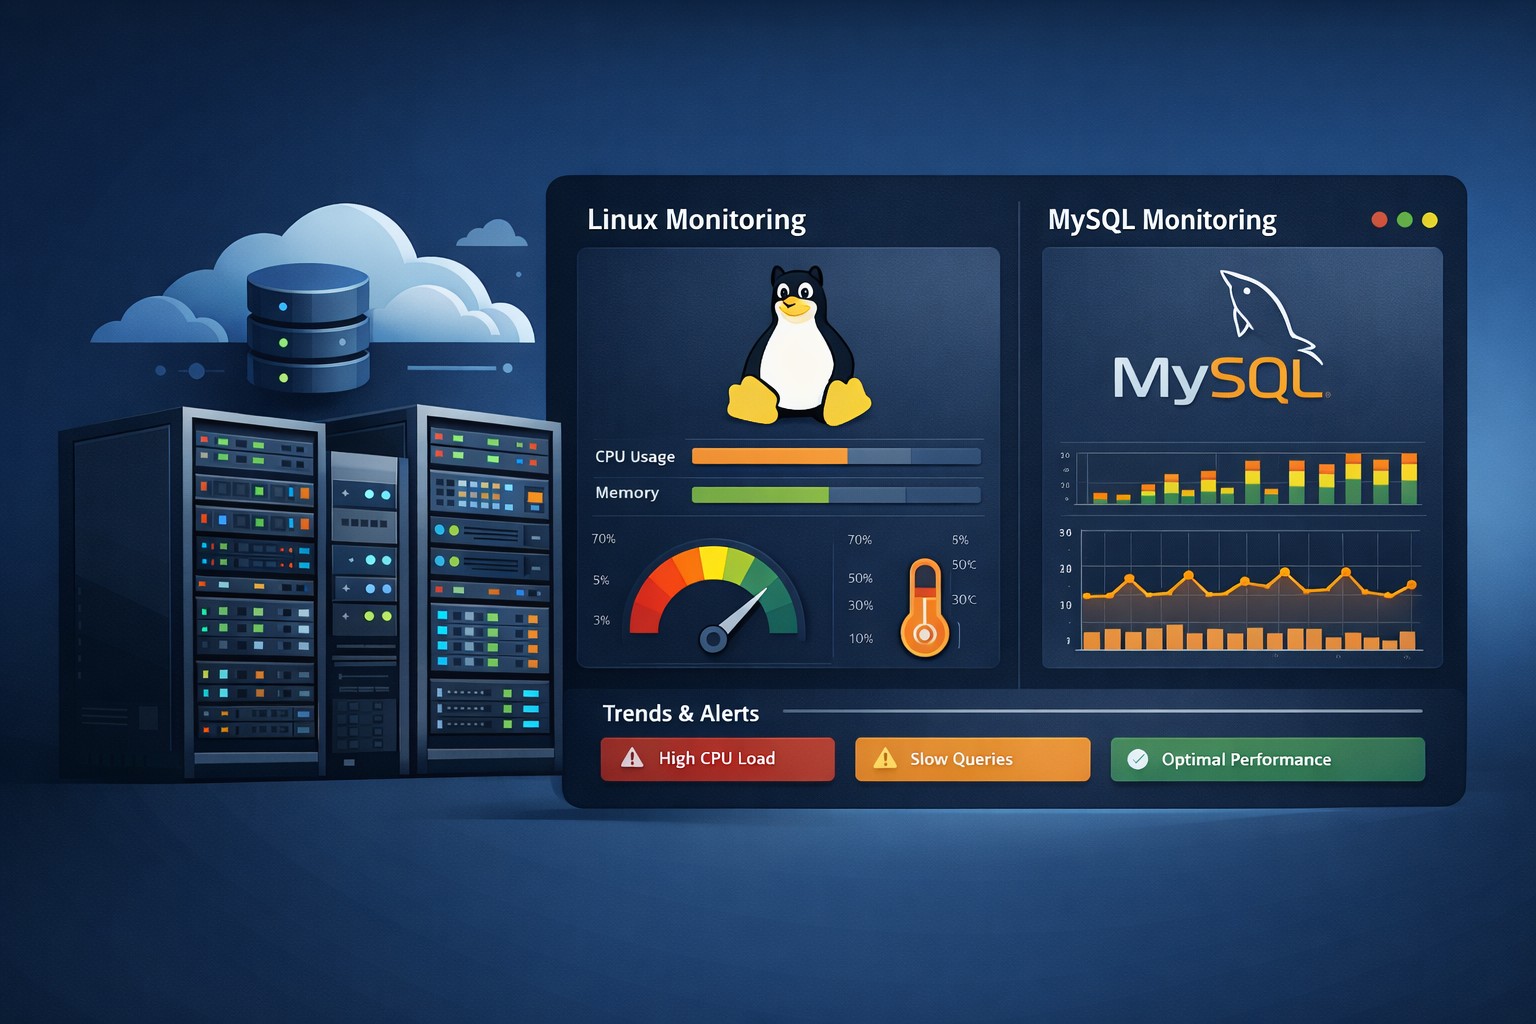
MySQL Trends That Often Go Unnoticed
Slow queries, rising connections, and longer execution times are early warning signs of database stress.
Real-World Example
A small team identified rising CPU, disk growth, and slow queries early. Fixing a misconfigured job, log rotation, and missing index prevented outages.
How to Start Tracking Health Trends
- Collect daily snapshots
- Store historical data
- Generate weekly reports
- Focus on trends, not just thresholds
Summary
Linux server issues build slowly. Trend-based visibility helps you catch them early and stay ahead. If you want a simple way to turn system data into actionable weekly insights, DMCloudArchitect helps you get there without adding complexity.