Introduction: The Visibility Gap Most Teams Struggle With
Many infrastructure teams rely on real-time monitoring tools, dashboards, and alerts. Yet despite all this tooling, problems still seem to appear unexpectedly—CPU saturation, disk bottlenecks, or slow database performance.
The issue isn’t a lack of data. It’s a lack of clear, structured insight over time. This is where infrastructure health reporting becomes essential.
What Is Infrastructure Health Reporting?
Infrastructure health reporting is the practice of collecting, summarizing, and analyzing system metrics over time—typically in daily or weekly reports. Instead of focusing on real-time alerts, it emphasizes trends, patterns, and long-term system behavior.
A well-designed infrastructure monitoring report answers key operational questions:
- Is CPU usage steadily increasing?
- Are memory or disk resources approaching limits?
- Are database queries becoming slower over time?
- Which servers show early signs of performance degradation?
Why Traditional Monitoring Falls Short
Most monitoring tools are optimized for real-time visibility and alerting. While useful, they often create noise and miss gradual changes.
For example:
- A server running at 90% CPU for a few minutes triggers alerts
- A server slowly rising from 40% to 75% CPU over weeks does not
The second scenario is far more dangerous—but harder to detect without trend-based reporting.
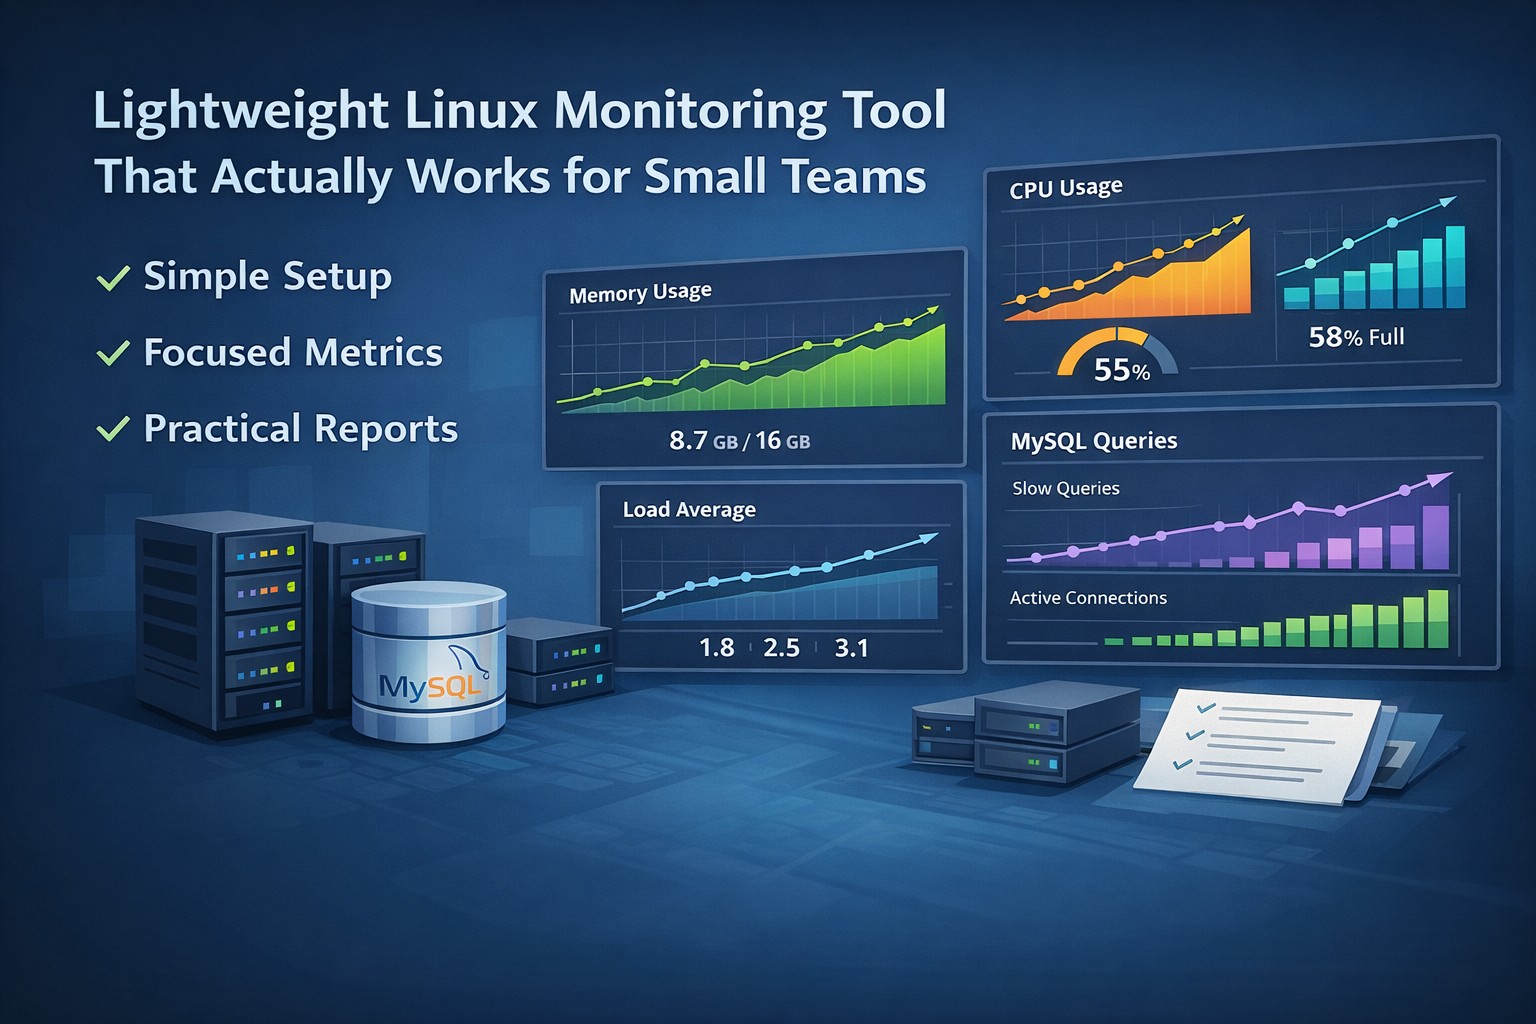
What Should a Server Health Report Include?
An effective server health reporting system focuses on a few critical areas:
CPU Trends
Weekly averages, peak usage, and growth patterns help identify capacity issues early.
Memory Usage
Tracking memory pressure over time reveals leaks, inefficient applications, or growing workloads.
Disk Utilization
Disk usage trends are essential for avoiding outages caused by full volumes.
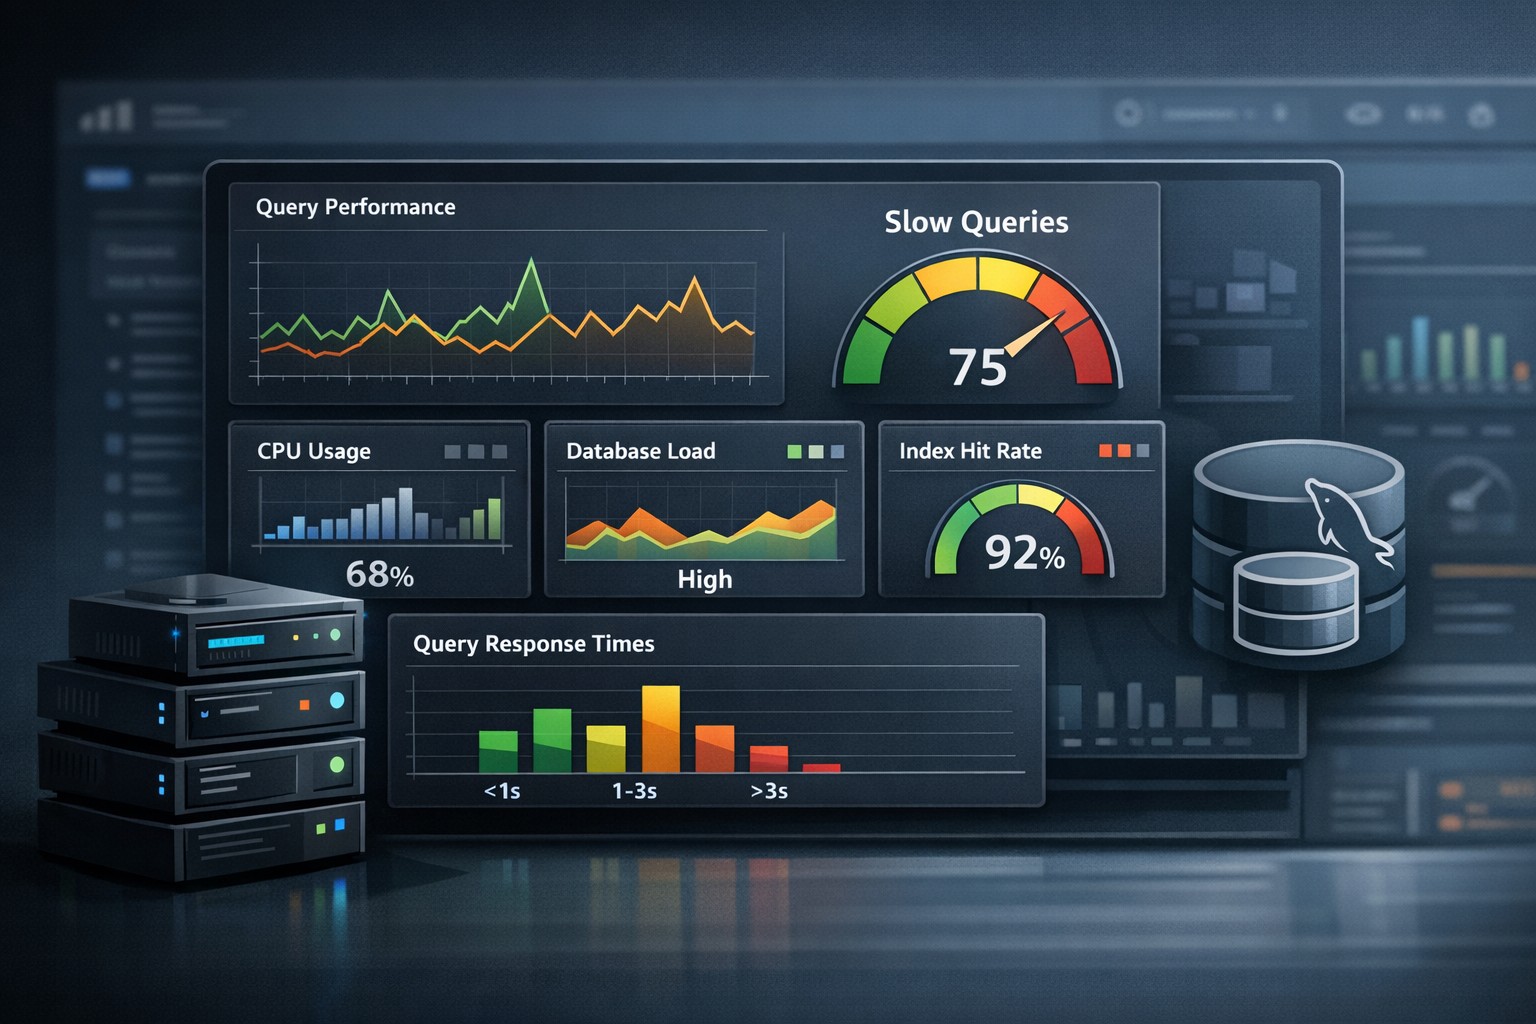
MySQL Performance
Metrics such as slow queries, connections, and query throughput provide insight into database health.
Load and System Pressure
Load averages and I/O wait metrics help detect resource contention before it impacts users.
Real-World Example: Weekly Reporting in Action
Consider a small operations team managing several Linux and MySQL servers. They receive a weekly server health weekly report summarizing:
- CPU usage trends across all servers
- Top processes consuming resources
- Disk growth projections
- Slow query trends in MySQL
One week, they notice a steady increase in CPU usage on a database server. No alerts were triggered, but the trend is clear. Investigation reveals a missing index causing inefficient queries.
Because the issue was caught early, they fix it before users experience slow performance.
Benefits of Infrastructure Health Reporting
Implementing structured system health reporting provides several advantages:
- Proactive issue detection before outages occur
- Better capacity planning based on real data
- Reduced alert fatigue by focusing on trends
- Improved decision-making for infrastructure changes
Infrastructure Health Dashboard vs Reports
An infrastructure health dashboard provides real-time visibility, while reports provide context over time. Both are useful, but they serve different purposes.
Dashboards answer: “What is happening right now?”
Reports answer: “How has the system been behaving over time?”
For small teams, reports are often more actionable because they highlight patterns without requiring constant attention.
Why Lightweight Reporting Works Best
Many organizations adopt complex observability platforms that require significant setup and maintenance. For smaller teams, this can become overwhelming.
A lightweight infrastructure monitoring report approach focuses on clarity:
- Weekly summaries instead of constant alerts
- Key metrics instead of excessive data
- Trend analysis instead of isolated events
This makes it easier to understand system behavior and take action.
Summary
Infrastructure health reporting shifts your approach from reactive firefighting to proactive management. By focusing on trends and structured reporting, you gain clear visibility into how your systems evolve over time.
If you want a simple way to implement system health reporting without building complex monitoring stacks, you can get started quickly. Sign Up Now to see how structured weekly reports can help you stay ahead of infrastructure issues.