If you've ever set up Grafana for a small Linux environment, you know the feeling: thirty minutes in, you're configuring data sources, installing Prometheus exporters, and wondering if this is really the right tool for two servers and a cron job. Grafana is powerful — genuinely useful for large, complex infrastructure — but for smaller setups, it often brings more overhead than visibility.
Linux monitoring without Grafana is not only possible, it's sometimes the smarter choice. There are solid, lightweight options that give you meaningful insight into your systems without requiring a full observability stack to be running in the background.
This guide covers practical alternatives — tools and approaches that work well for small infrastructure teams, solo administrators, and developers who also run their own servers.
Why Grafana Isn't Always the Right Fit
Grafana is designed to visualize data from sources like Prometheus, InfluxDB, or Loki. That means to use it meaningfully, you're usually running at least two or three services alongside it. For enterprise teams with dozens of servers and dedicated operations staff, that stack makes sense. For a team managing five servers? It's often overkill.
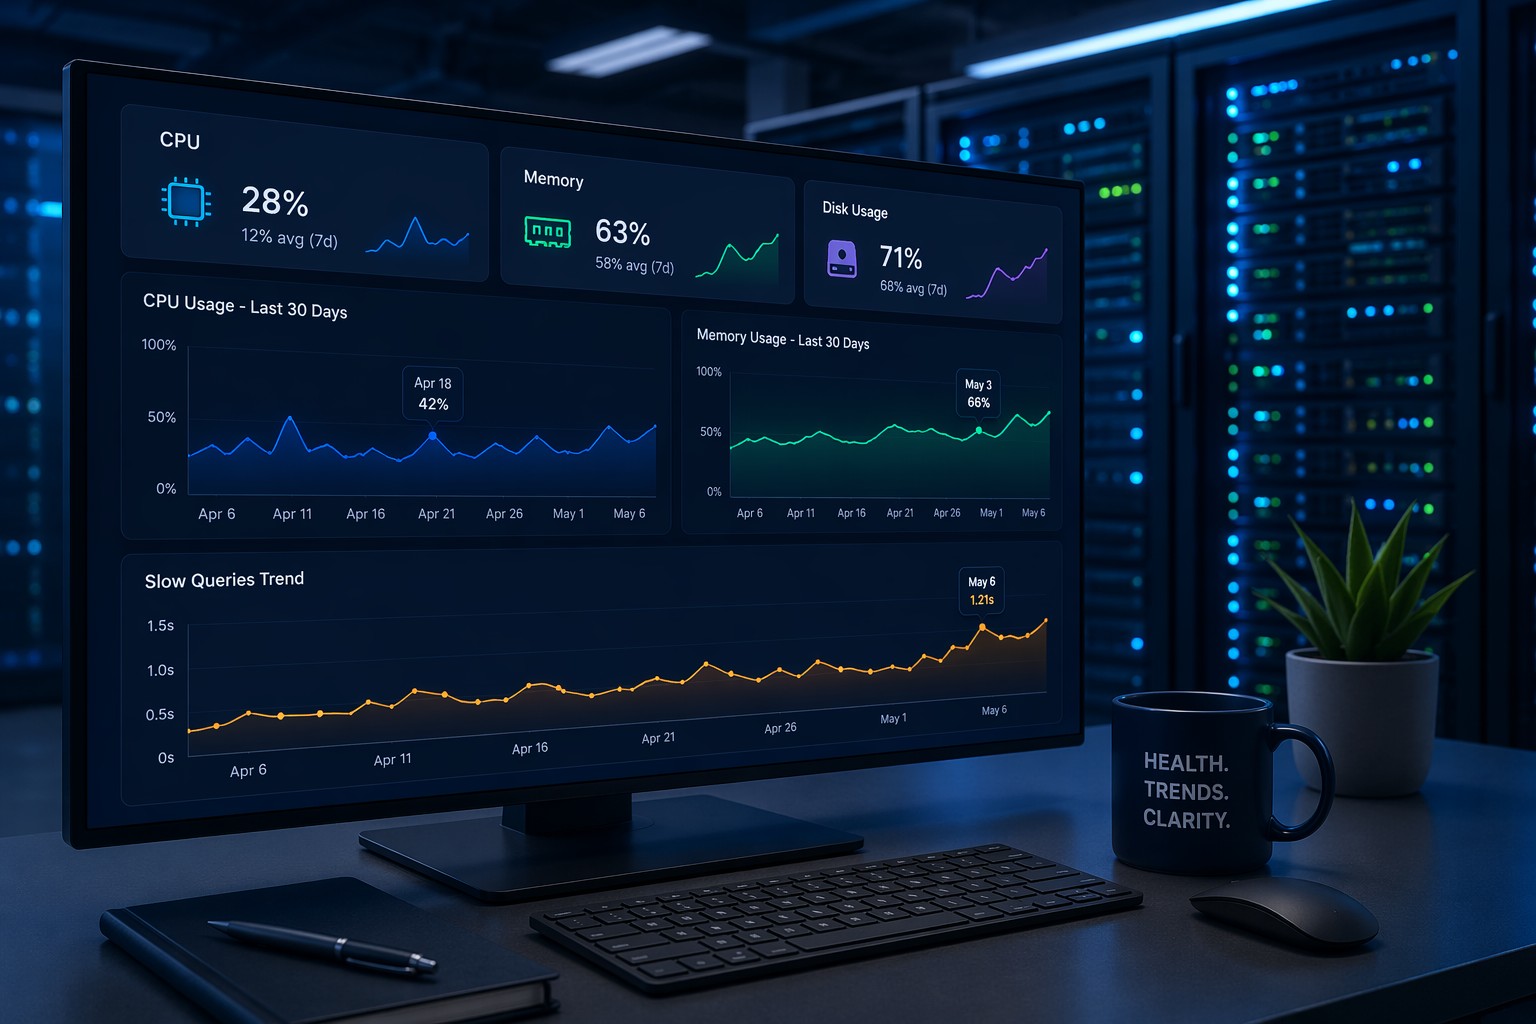
Here's the thing: most small infrastructure teams don't need real-time dashboards with millisecond-resolution graphs. What they need is a clear picture of whether their systems are healthy — CPU trending up over the last week, disk filling faster than expected, memory pressure building between deployments. That kind of trend-based visibility doesn't require Grafana's full feature set.
The heavier the monitoring stack, the more time you spend maintaining the monitoring itself instead of the infrastructure it's supposed to watch. That's a real tradeoff worth taking seriously.
Lightweight Linux Monitoring Tools Worth Knowing
Several tools offer useful visibility with far less setup than a full Grafana + Prometheus deployment.
netdata
Netdata is one of the most capable lightweight linux monitoring tools available. Install it on a server with a single command, and you immediately get a local web UI showing CPU, memory, disk I/O, network, and dozens of other metrics in real time. It's resource-light, self-contained, and requires no external database. For quick operational awareness, it's hard to beat. The free tier runs entirely on your server with no external dependencies.
Glances
Glances is a Python-based system monitor that runs in the terminal or through a browser interface. It gives you an at-a-glance view of CPU, memory, disk, network, processes, and more. It's useful both for interactive troubleshooting and as a quick health check when you SSH into a server. Low setup friction — often one pip install away.
Munin
Munin is older, but it's specifically built for trend monitoring rather than real-time dashboards. It polls metrics at regular intervals and generates time-series graphs showing how resources change over days and weeks. If you've been running Grafana primarily to understand trends, Munin covers that use case with far simpler infrastructure — just a cron job and a web server.
Telegraf + Local Storage
If you want metric collection without Prometheus's complexity, Telegraf can collect system metrics and write them to local files or a lightweight backend like SQLite. This is a minimal linux monitoring setup that scales up gracefully if you later decide you need more.
Going Even Simpler: Shell Scripts and Scheduled Reports
For some environments, the right answer isn't another monitoring tool — it's a scheduled script that reads /proc and emails you a summary once a day. This sounds rudimentary, but consider what it actually delivers: a consistent record of your system's state at a known point in time, no ongoing service to maintain, and zero alert noise.
A basic shell script can capture:
- CPU load averages (1, 5, 15 minute)
- Available memory and swap usage
- Disk usage per mount point
- Top memory-consuming processes
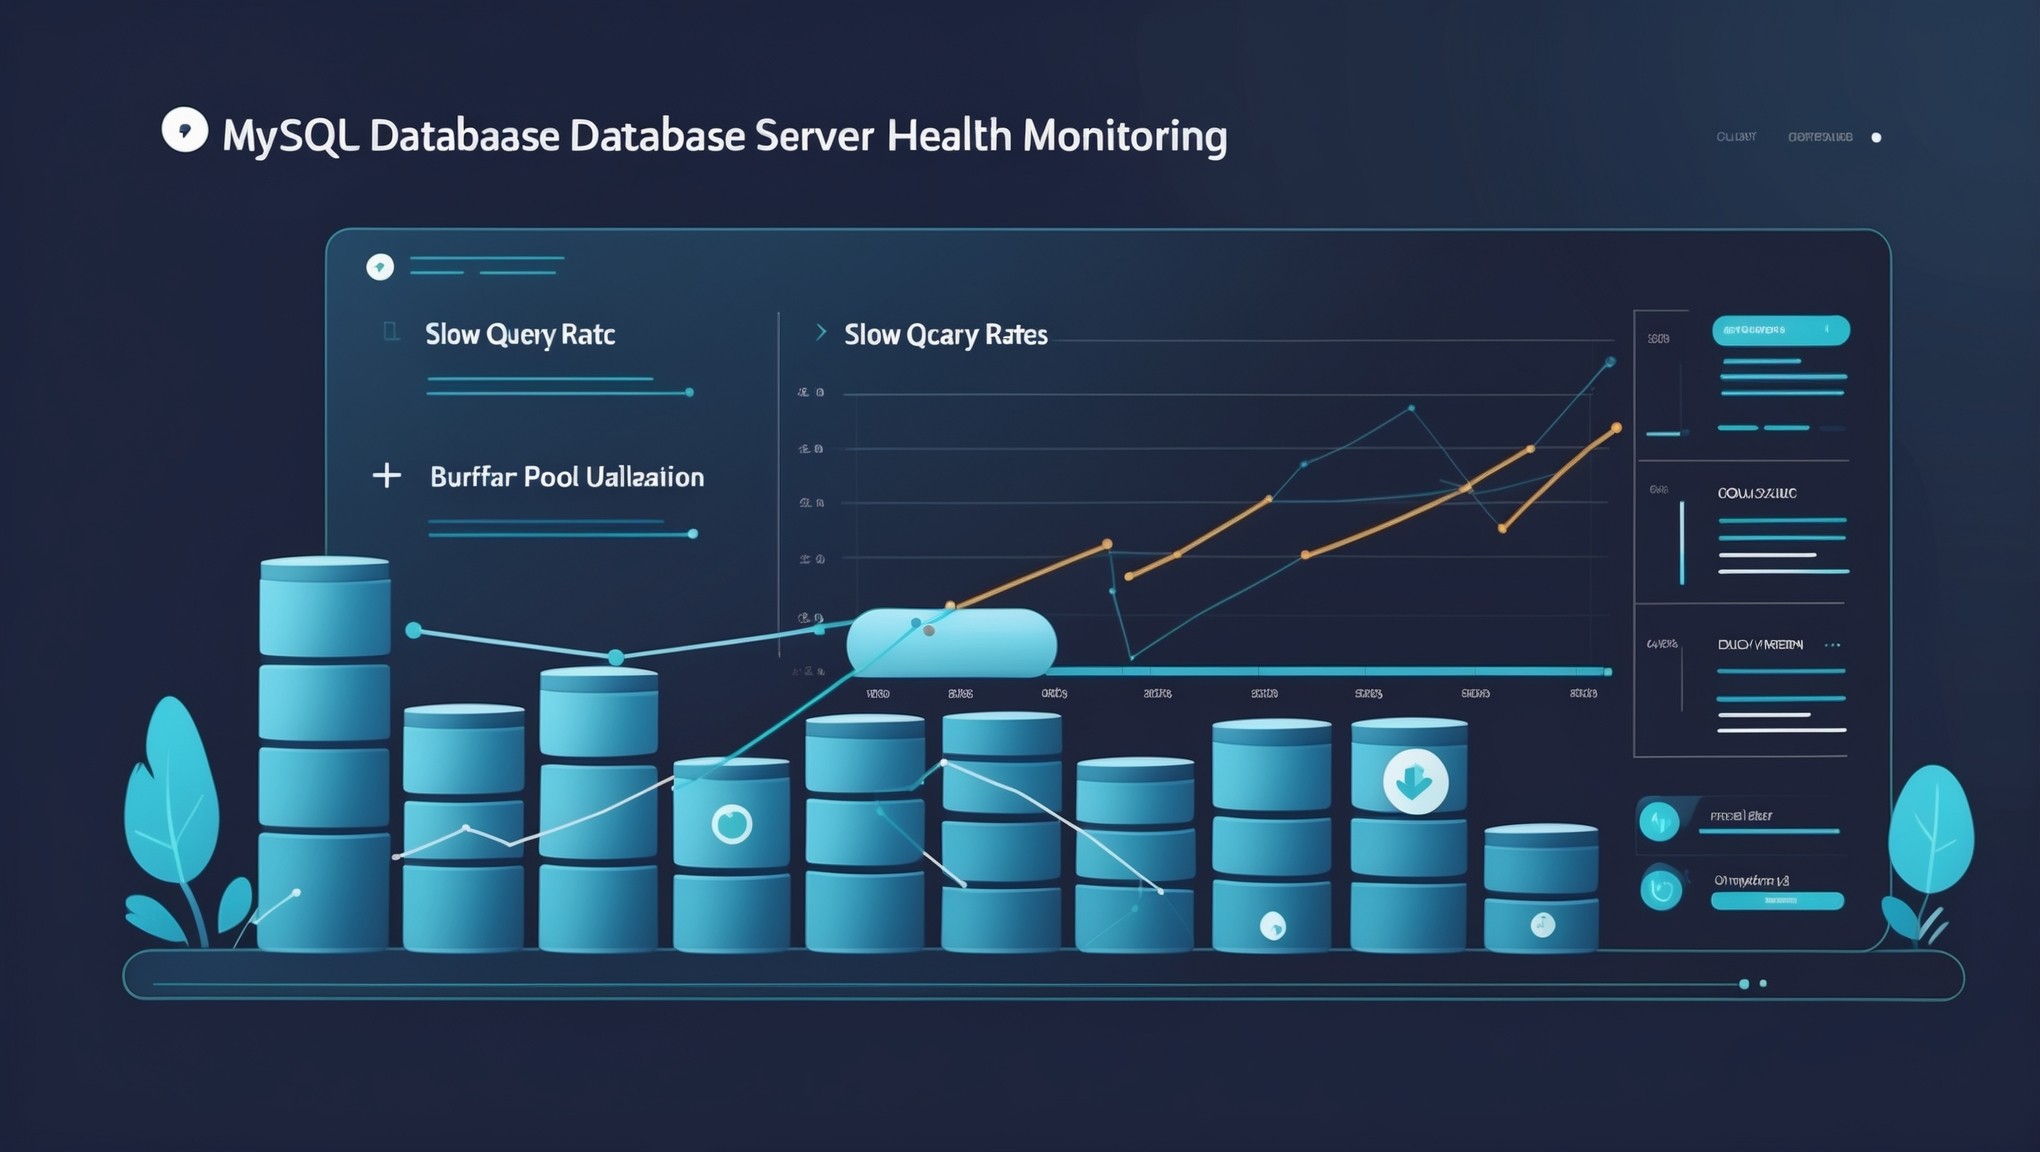
- MySQL slow query counts if applicable
Scheduled via cron and delivered to your inbox each morning, this becomes a lightweight health report. You read it in two minutes, spot anything abnormal, and move on. No dashboard, no alert noise, no stack to maintain.
In most setups, this works fine until the environment grows complex enough that manual review becomes impractical — at which point you've earned the right to evaluate heavier tooling.
A Real Operational Example
Consider a small team running eight Linux servers for a SaaS application. They set up Grafana early on because that's what everyone seemed to be using. Six months later, nobody was looking at the dashboards. Alerts were ignored because they fired too often. The Prometheus retention was consuming disk space faster than the application itself.
They replaced the whole stack with Netdata on each server (for interactive troubleshooting) and a daily shell-based health report delivered by email. Within a week, they were actually reading their system health data again — because it arrived in a format that took two minutes to process, not thirty minutes to interpret.
That's not a knock on Grafana. It's a recognition that a simple linux monitoring solution, matched to your actual environment size, is often more effective than a sophisticated one that nobody uses.
Choosing the Right Approach for Your Setup
Here's a practical way to think about it:
- 1–5 servers, minimal ops time: Shell reports via cron, or Glances for interactive checks.
- 5–15 servers, want trend visibility: Netdata per server, or Munin for longer-range trends.
- 15+ servers with growth trajectory: Start evaluating Prometheus at this scale — it begins to earn its complexity.
Linux monitoring for small business environments should be proportional to the environment. The goal is visibility, not infrastructure to support your monitoring infrastructure.
Wrapping Up
Linux monitoring without Grafana is a completely reasonable choice for most small infrastructure teams. Lighter tools like Netdata, Glances, and Munin cover the majority of operational needs — and scheduled health reports can cover the rest without requiring a running service at all.
The best monitoring setup is one that your team actually reads and acts on. If you're looking for a structured way to track how your infrastructure health trends over time, you can explore how trend-based reporting fits into your workflow with Infrastructure Health Reporting.