Introduction: When “Small” Infrastructure Still Breaks
Many small teams assume that monitoring is something only large-scale systems need. After all, if you’re running just a few Linux servers or a single MySQL instance, how complicated can it get?
In reality, small infrastructure environments often fail in quieter, more subtle ways. Disk usage creeps up. CPU spikes become more frequent. Queries slow down gradually. Without visibility, these issues go unnoticed until they cause real downtime.
This is where small infrastructure monitoring becomes essential—not as a heavy, complex system, but as a practical way to understand how your systems behave over time.
Why Small Infrastructure Monitoring Matters
Unlike large enterprises, small teams usually don’t have dedicated DevOps engineers watching dashboards all day. Monitoring needs to be simple, focused, and actionable.
The goal is not constant alert noise. It’s about identifying trends early:
- CPU usage slowly increasing over weeks
- Disk space gradually filling up
- Memory pressure becoming more frequent
- MySQL queries taking longer than before
These are not one-time events—they’re patterns. And patterns are what cause outages if ignored.
What to Monitor in a Small Environment
For effective small server monitoring, focus on a few core areas instead of trying to track everything.
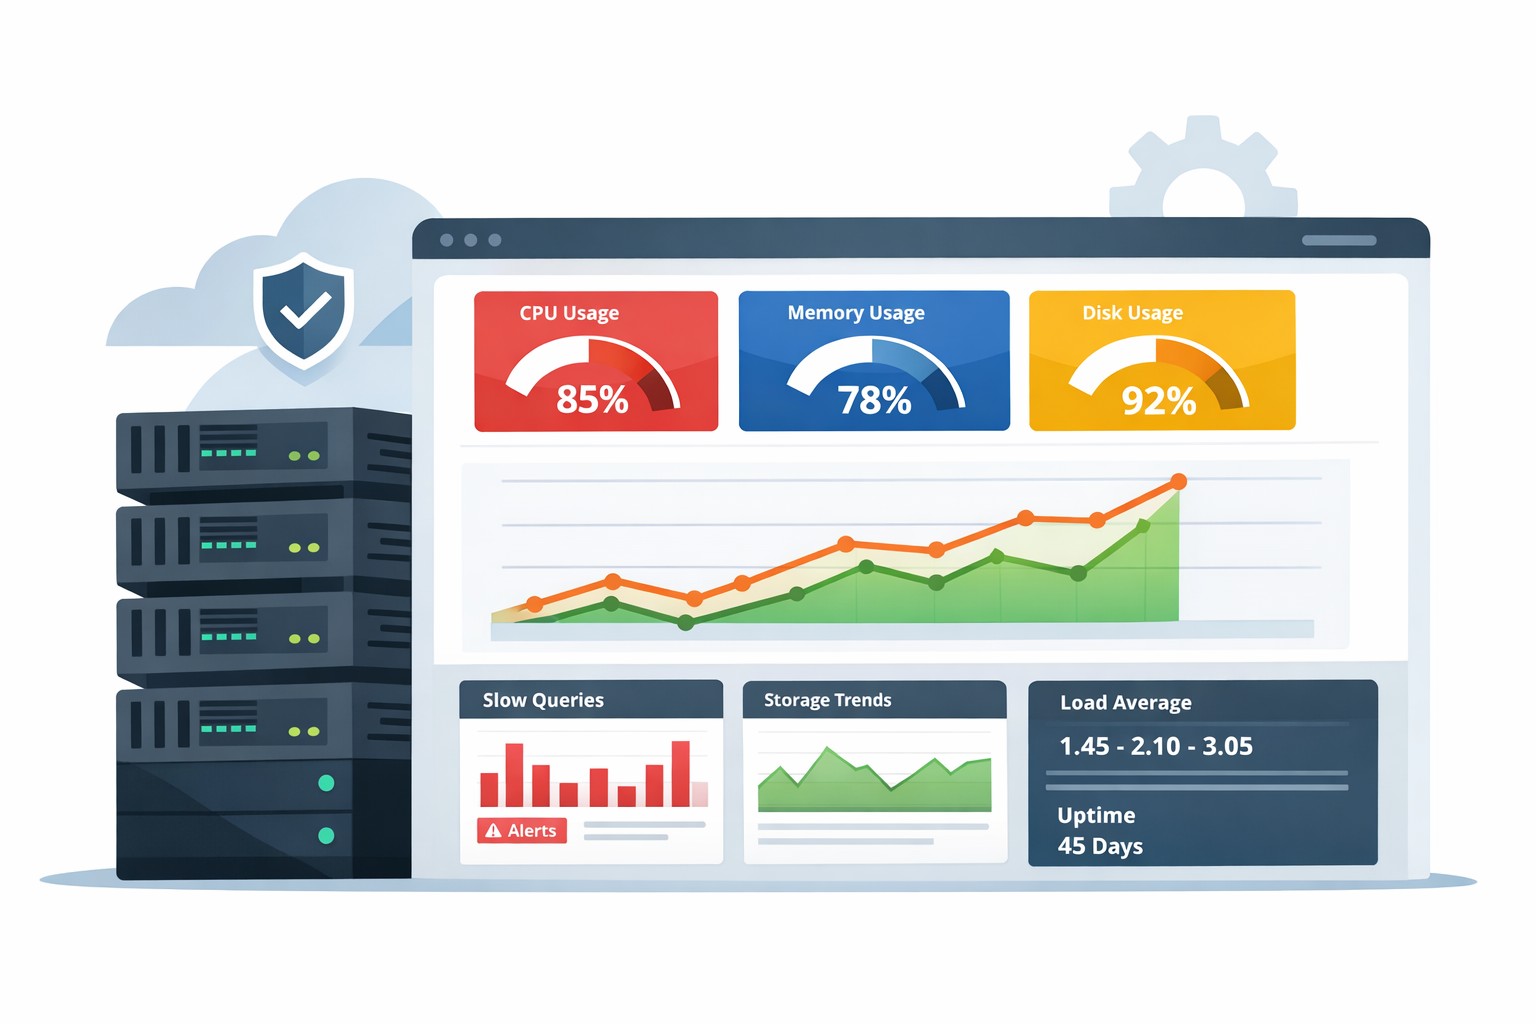
1. System Resources
- CPU usage trends (not just spikes)
- Memory utilization and swap usage
- Disk usage and growth rate
2. Application Health
- Web response times
- Error rates
- Background job performance
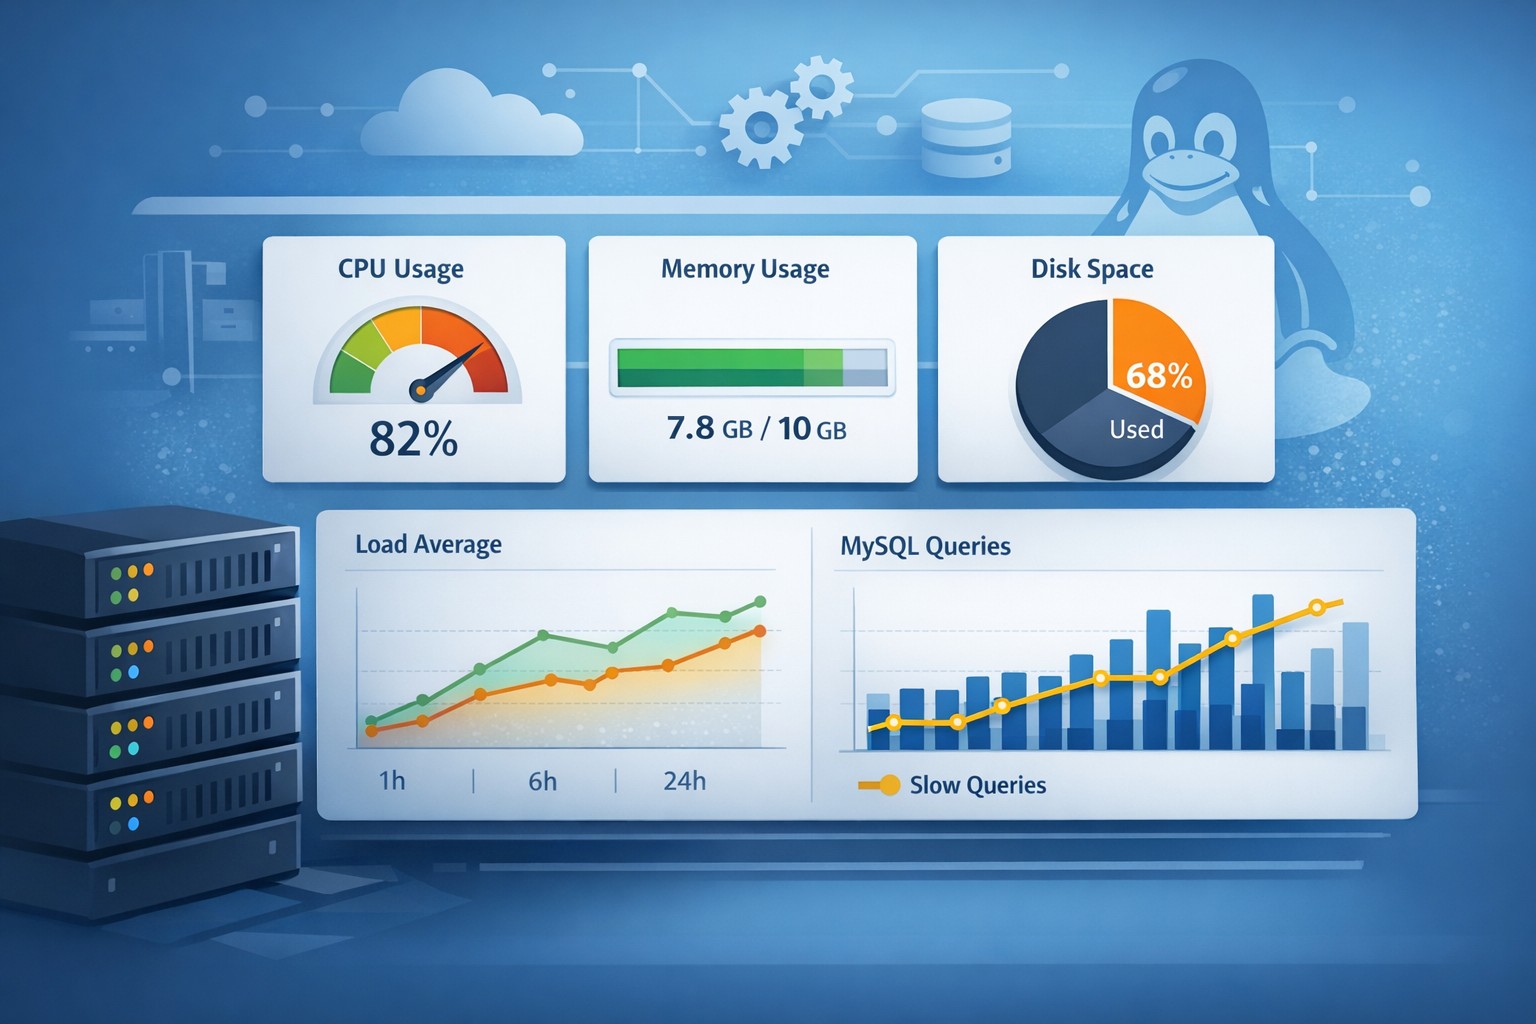
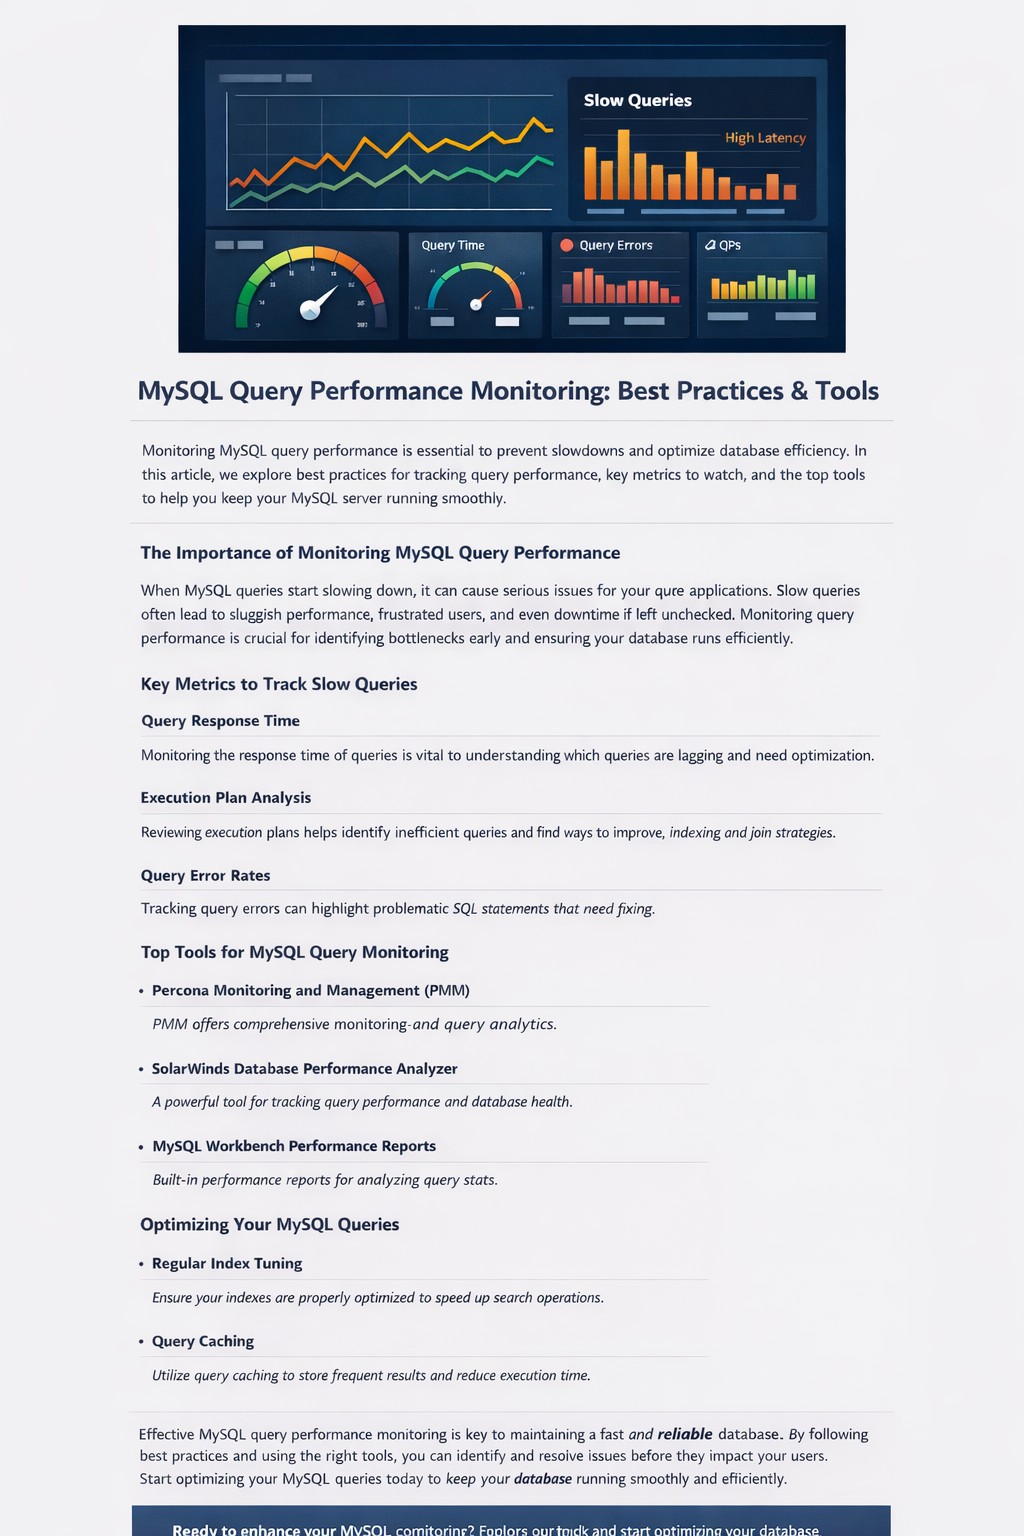
3. Database Performance (MySQL)
- Slow query trends
- Connection usage
- Table growth over time
This approach keeps monitoring lightweight while still giving you meaningful insight.
Why Traditional Monitoring Tools Don’t Fit Small Teams
Many monitoring tools are designed for large-scale environments. They assume:
- Dedicated teams to manage alerts
- Complex alert rules and dashboards
- Time to continuously tune thresholds
For small businesses, this often leads to two problems:
- Too many alerts that get ignored
- Too much setup effort for little practical value
That’s why a lightweight monitoring solution focused on reporting—not constant alerting—is often a better fit.
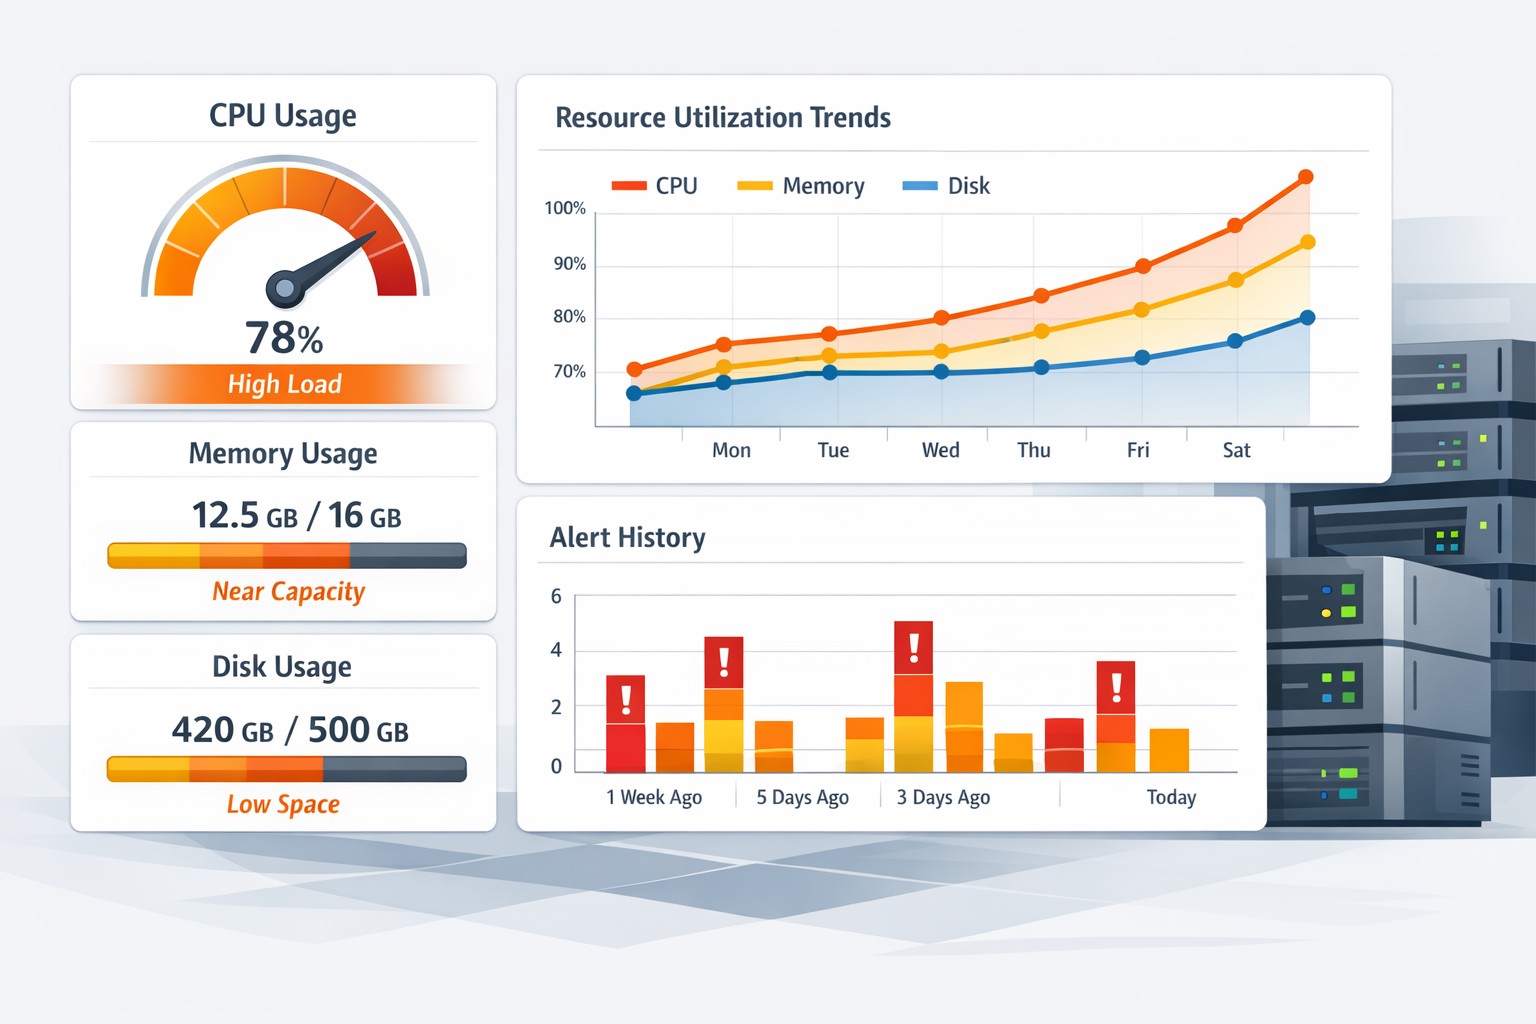
Trend-Based Monitoring: A Better Approach
Instead of reacting to every spike, trend-based monitoring helps you understand how your infrastructure evolves over time.
For example:
- A disk growing at 5% per week can be predicted to fill up
- CPU usage increasing month-over-month signals scaling needs
- Slow queries trending upward indicate database optimization issues
This approach is especially useful when you need to monitor a small production server without constant manual oversight.
Real-World Example
Consider a small e-commerce application running on a single Linux server with MySQL.
Everything appears stable day-to-day. But over several weeks:
- Disk usage increases due to growing logs
- MySQL queries slow down as tables expand
- CPU spikes become more frequent during peak hours
Without monitoring, these changes are invisible. Then one day, the disk fills up, and the application crashes.
With simple monitoring in place, you would have seen:
- Disk growth trends weeks in advance
- Gradual degradation in query performance
- Increasing load patterns tied to traffic
That’s the difference between reactive firefighting and proactive management.
How to Keep Monitoring Simple
If you’re implementing simple monitoring for a small business, focus on these principles:
- Track trends, not just real-time metrics
- Avoid alert overload
- Use weekly or daily summaries
- Focus on capacity and performance growth
You don’t need a full observability stack to achieve this. In fact, simpler systems often provide clearer insights.
Summary
Small infrastructure monitoring is not about complexity—it’s about clarity. By focusing on trends instead of noise, small teams can gain visibility into how their systems behave and prevent problems before they become outages.
If you’re looking for a practical way to monitor small production environments without heavy tooling, tools designed for infrastructure health reporting can provide exactly the right level of insight. You can explore how this works in practice here: https://health.dmcloudarchitect.com/.