Infrastructure Monitoring Report: What to Track and Why It Matters
Most infrastructure issues don’t appear suddenly. CPU saturation, disk pressure, or slow MySQL queries usually build up quietly over days or weeks. By the time alerts fire, the problem has already impacted performance or availability.
This is where an infrastructure monitoring report becomes critical. Instead of reacting to isolated alerts, teams can understand how systems behave over time and catch early warning signs before they become outages.
Why Infrastructure Monitoring Reports Matter
Traditional monitoring focuses on real-time alerts. While useful, alerts only tell you when something is already wrong. A structured report, on the other hand, shows trends and patterns across your environment.
For small infrastructure teams, this shift is especially valuable. Instead of managing noisy dashboards, you get a clear weekly or daily summary of system health.
- Spot gradual CPU or memory increases
- Identify growing disk usage before capacity issues
- Track slow database queries over time
- Understand workload patterns across servers
What Should an Infrastructure Monitoring Report Include?
A useful report focuses on a few key areas rather than overwhelming you with raw metrics.
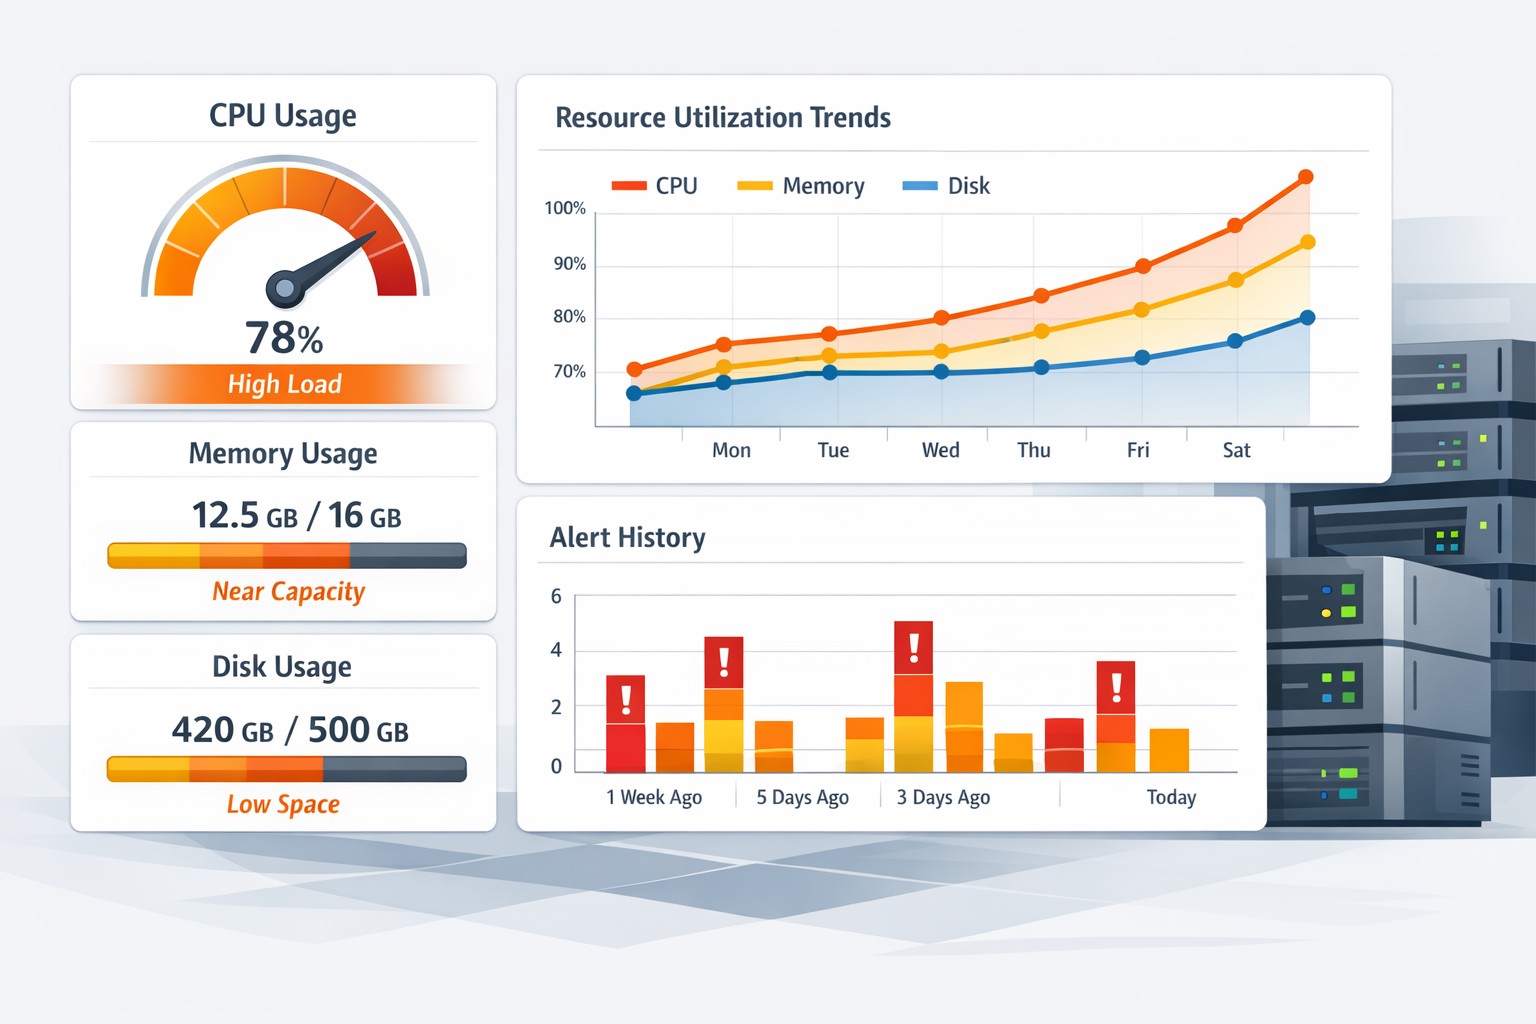
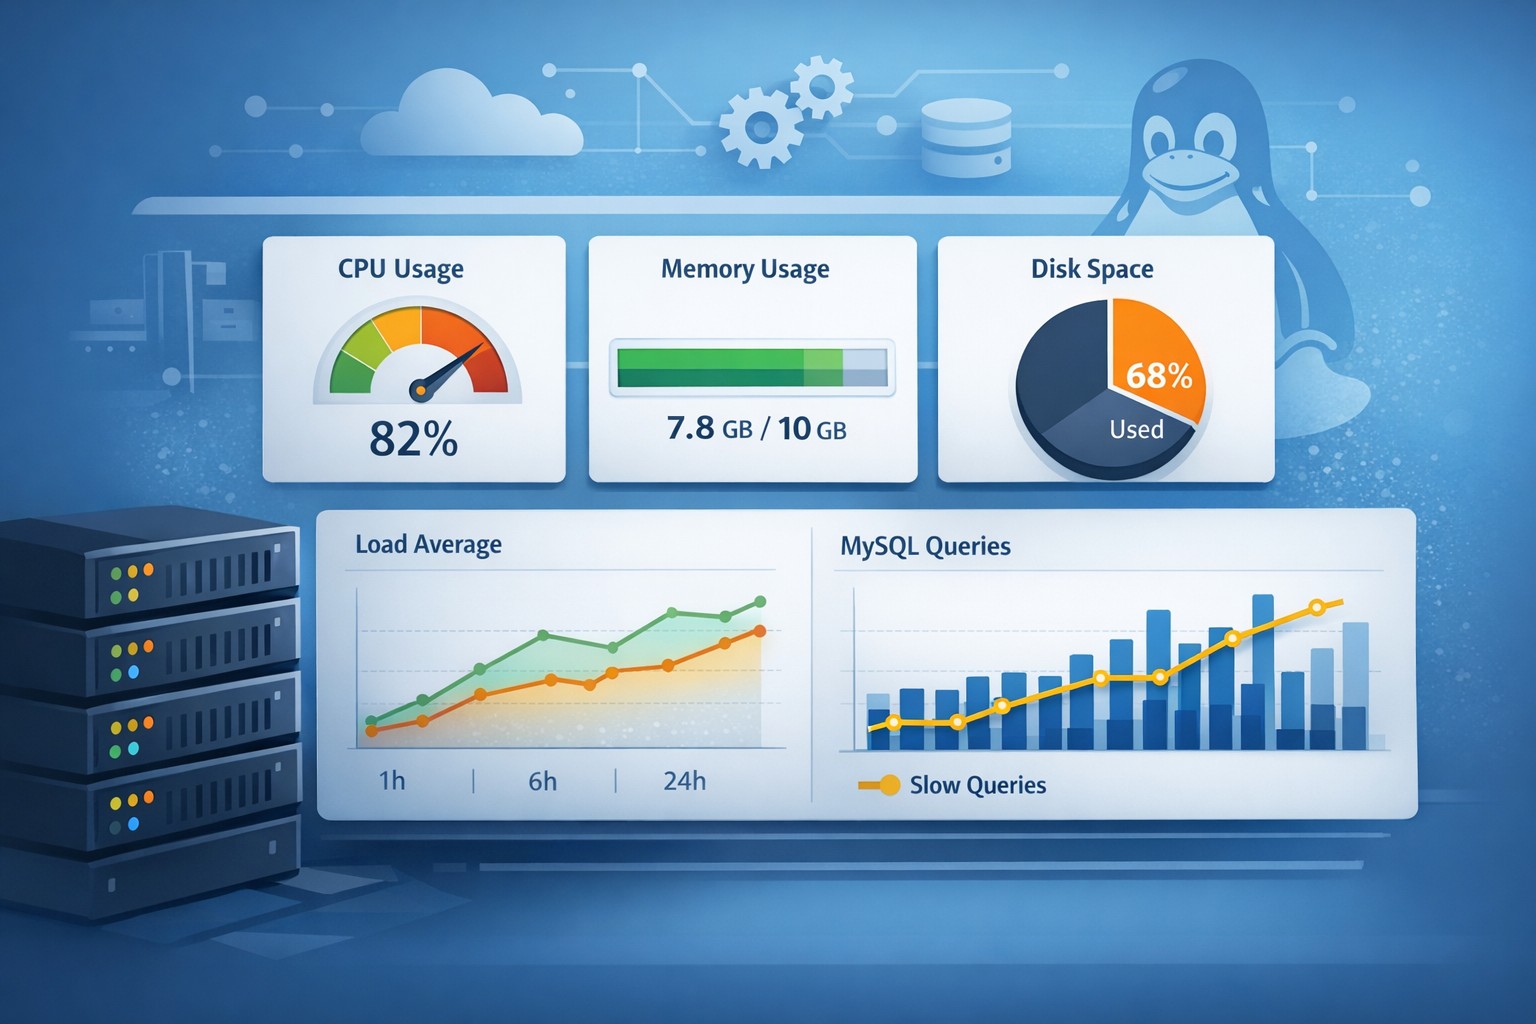
1. CPU and Load Trends
Instead of looking at current CPU usage, reports should show how load evolves. A steady increase in load average may indicate inefficient processes or growing traffic.
2. Memory Utilization
Memory pressure often builds slowly. Reports help identify when systems are consistently nearing limits or relying heavily on swap.
3. Disk Usage and Growth
Disk space issues rarely happen overnight. A server health weekly report can highlight growth rates and predict when action is needed.
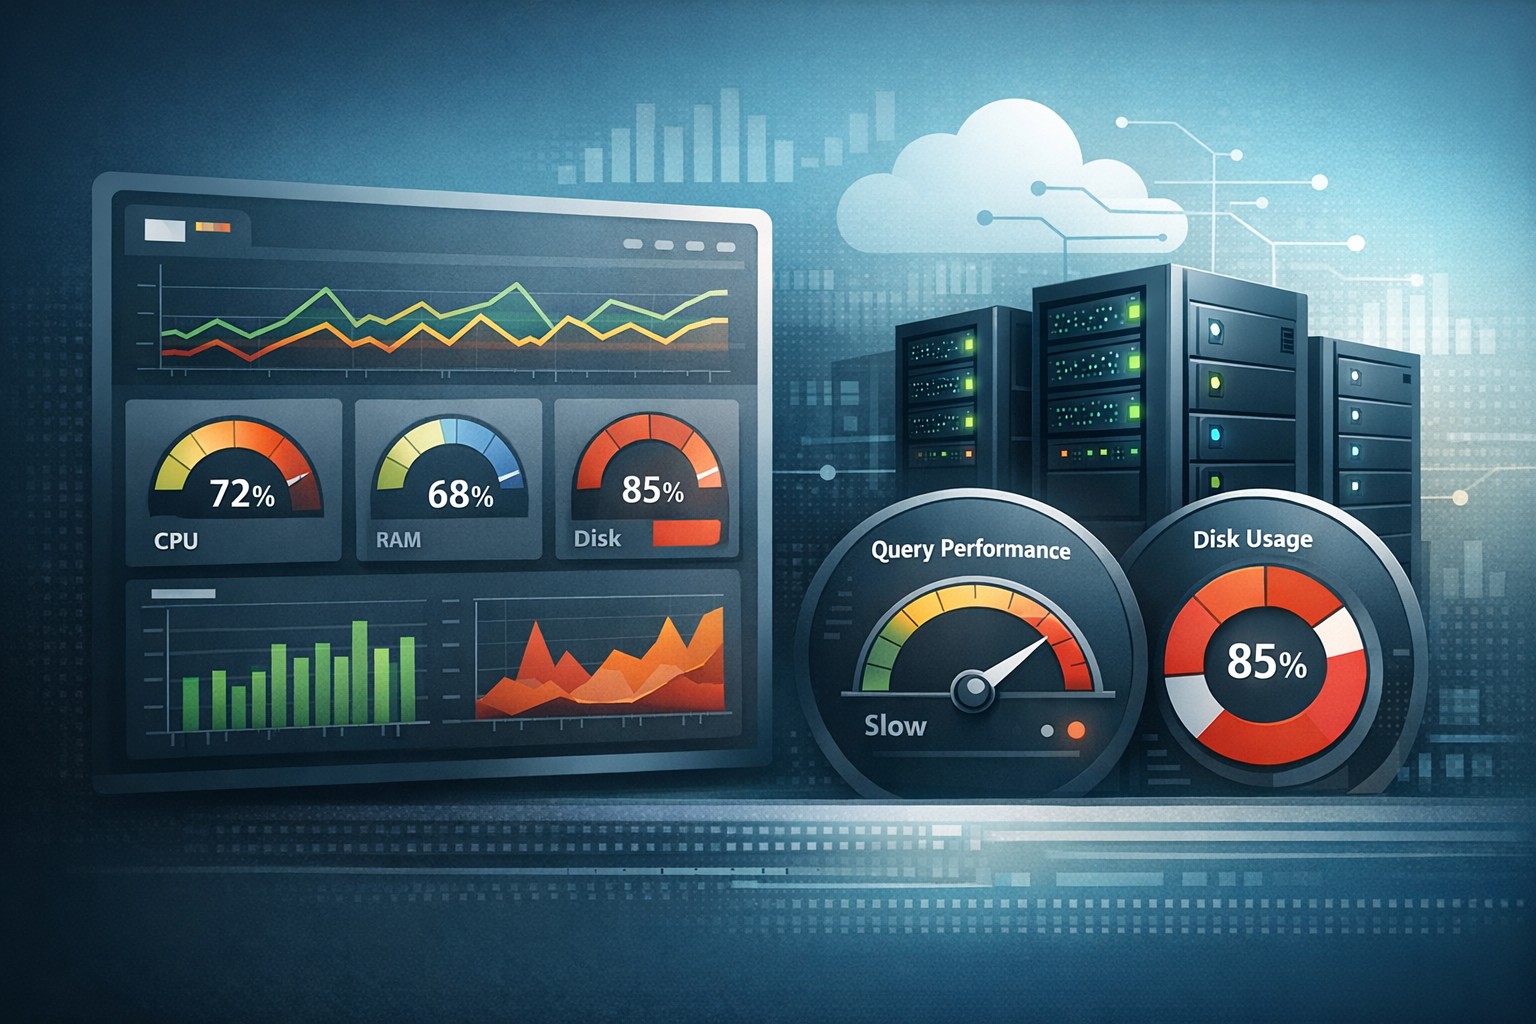
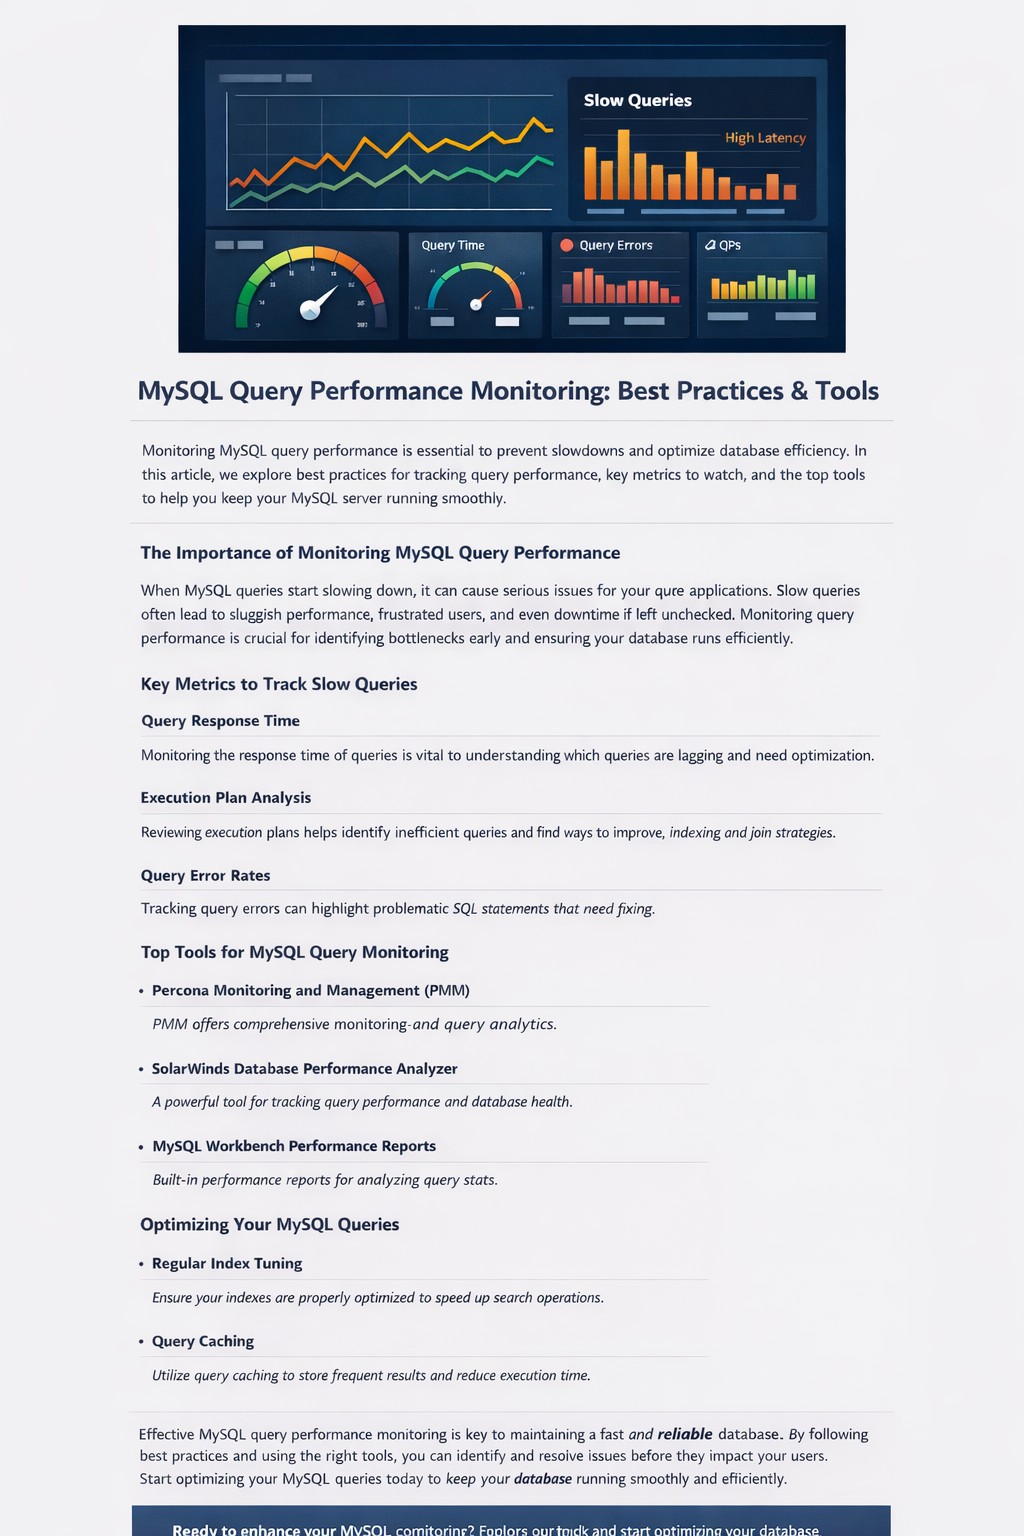
4. MySQL Performance Metrics
For database-driven systems, slow queries and connection patterns are critical. Tracking these over time reveals optimization opportunities.
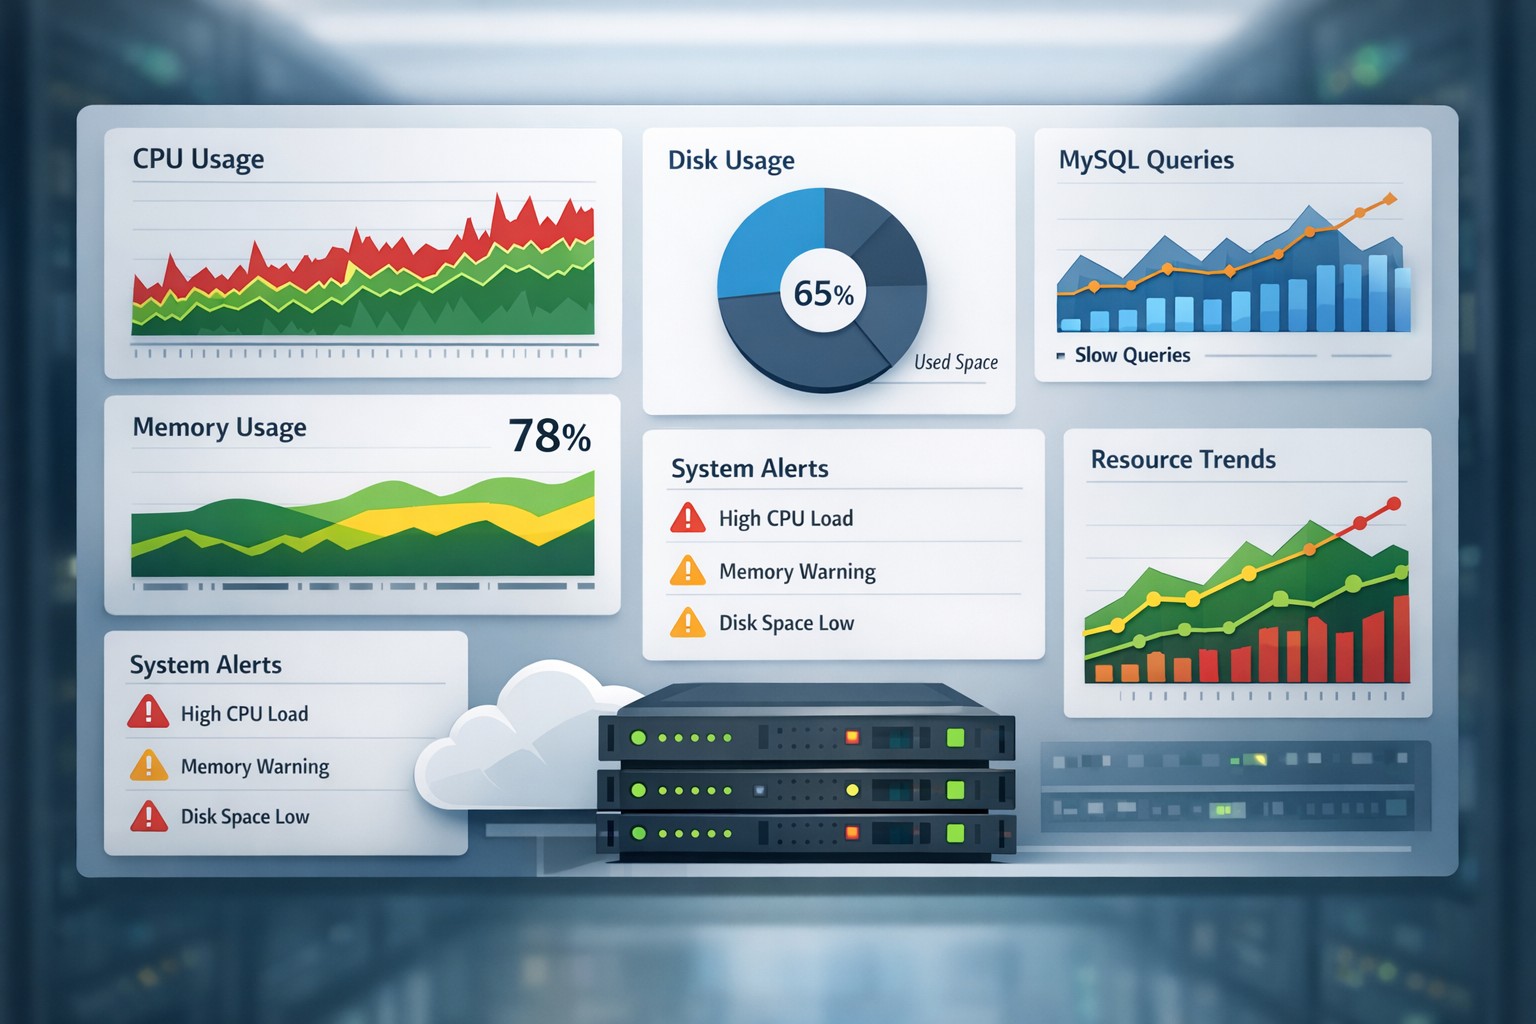
5. System-Level Health Indicators
Basic signals like uptime, I/O wait, and process counts provide context for deeper analysis.
From Raw Metrics to Meaningful Insights
The difference between data and insight is context. A spike in CPU usage may not be a problem if it’s expected during peak hours. But a consistent upward trend over weeks is a warning sign.
This is why system health reporting should focus on trends, not just snapshots. Reports should answer questions like:
- Is performance getting better or worse?
- Are workloads increasing?
- Where are bottlenecks forming?
Real-World Example: Preventing a Disk Outage
Consider a Linux server running a growing application. Daily monitoring shows no issues, but a weekly report reveals disk usage increasing by 5% every week.
Without reporting, this trend could go unnoticed until the disk is full. With a proper infrastructure health dashboard and report, the team can plan storage expansion weeks in advance.
How to Build a Practical Reporting Process
You don’t need a complex observability stack to get value from reporting. A lightweight approach often works better for small teams.
Focus on:
- Collecting key metrics from Linux and MySQL systems
- Aggregating them into daily or weekly summaries
- Highlighting trends instead of raw logs
- Keeping reports simple and actionable
This approach reduces noise while improving visibility.
Reporting vs Real-Time Monitoring
It’s not about choosing one over the other. Real-time monitoring helps you respond to incidents, while reporting helps you prevent them.
A balanced strategy includes both:
- Alerts for immediate issues
- Reports for long-term health tracking
For many teams, reporting is the missing piece.
Summary
An effective infrastructure monitoring report gives you clarity, not just data. It helps you understand how systems evolve, where risks are forming, and what actions to take before problems escalate.
If you’re looking to move beyond reactive monitoring and gain better visibility into your systems, explore Infrastructure Health Reporting to see how lightweight reporting can make infrastructure management simpler and more predictable.