Most Linux networking sysctls are not “faster server” switches. They are trade-offs. net.ipv4.tcp_mtu_probing is a good example: it can help TCP recover from broken Path MTU Discovery, but it can also hide a network problem that should be fixed closer to the source.
For an internet-facing file storage server, the practical answer is usually this: do not change it just because a tuning guide says so. Leave the default alone unless your linux server monitoring, packet captures, or customer reports point to MTU black holes or path-specific stalls. If the evidence is real, test a conservative change with clear rollback criteria.
What tcp_mtu_probing actually does
Path MTU Discovery is supposed to let a host learn the largest packet size that can travel across a path without fragmentation. When routers, firewalls, VPNs, tunnels, or cloud networks block the required ICMP feedback, large TCP segments can disappear. The connection may look “mysteriously slow” or hang on larger transfers while smaller requests work.
tcp_mtu_probing tells Linux whether TCP should probe for a working maximum segment size when that discovery process appears broken. The common values are:
- 0: disabled, which is the default on many systems.
- 1: enable probing only when TCP detects signs of a black-hole path.
- 2: always start with probing behavior for TCP connections.
That distinction matters. Value 1 is a fallback for suspicious paths, not a general performance booster. Value 2 is much more aggressive and is rarely the first choice for a production file server unless you have a controlled reason to use it.
Why Linux does not simply default it to 1
Kernel defaults have to work across laptops, servers, data centers, appliances, cloud networks, and unusual middleboxes. A default also has to avoid changing TCP behavior for everyone just to help the subset of paths where PMTU feedback is broken. That is why “safe for one environment” does not automatically become “best global default.”
There is also an operational philosophy behind the default. If a network path is dropping the ICMP messages needed for PMTU Discovery, the cleaner fix is usually to allow the required ICMP, correct tunnel MTUs, clamp MSS where appropriate, or repair the firewall rule. Probing can be a useful safety net, but it should not become a substitute for root-cause work when you control the network.
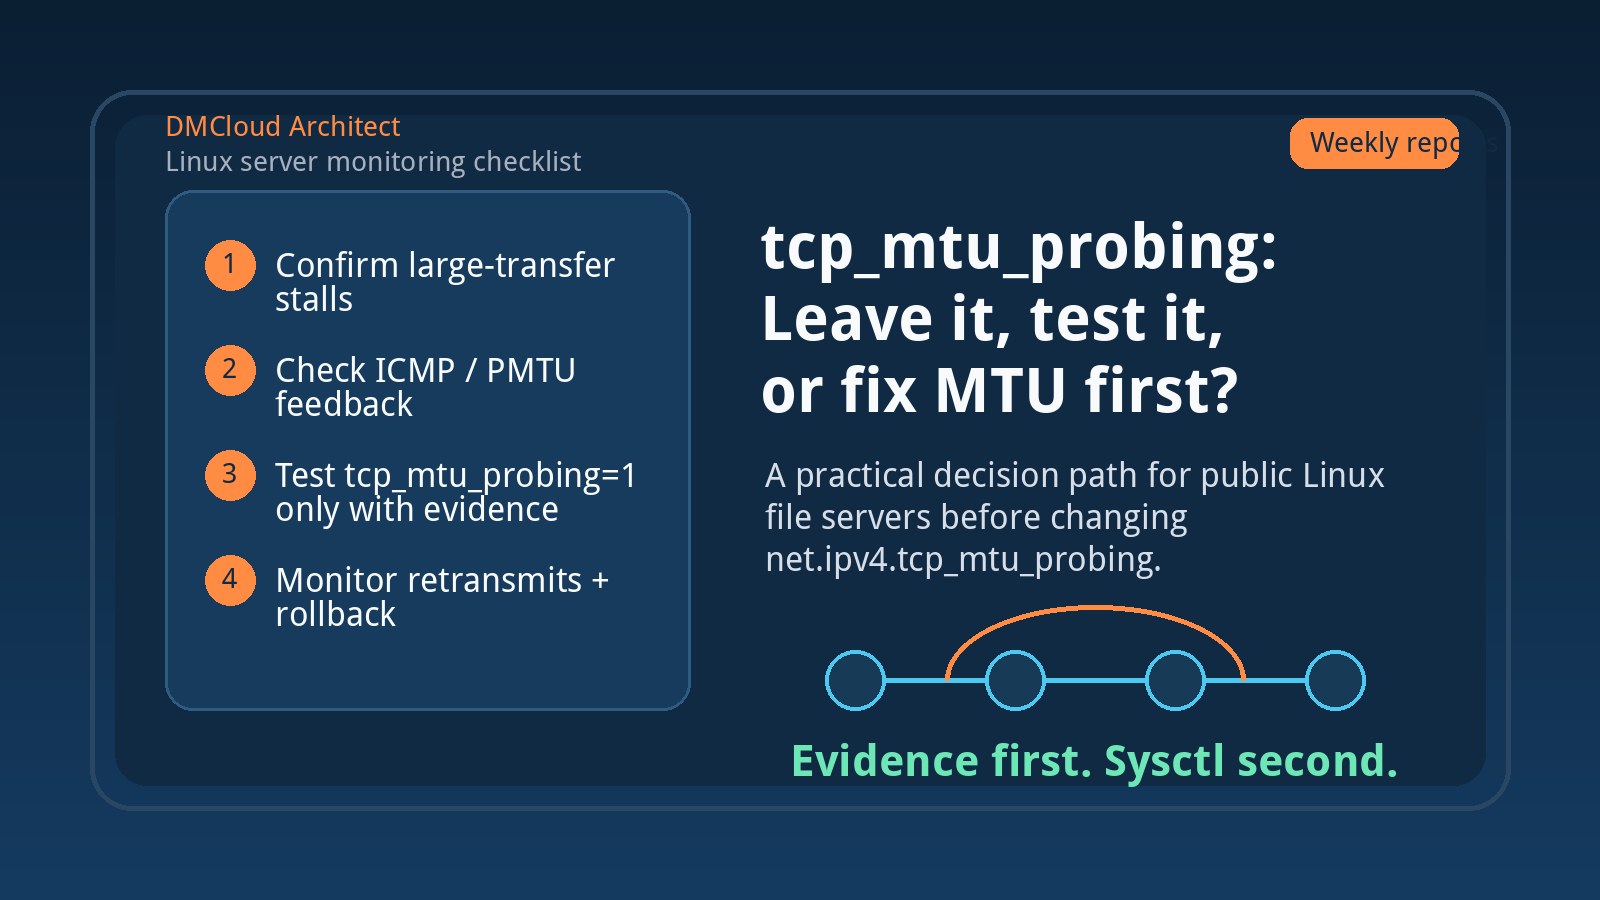
Use this decision checklist before changing it
- Confirm the symptom: Are large transfers stalling, or are you only trying to improve a benchmark?
- Check the pattern: Does the problem affect specific customers, networks, VPNs, regions, or tunnel paths?
- Measure retransmits: Review TCP retransmissions, timeouts, zero-window events, and connection resets before and during problem periods.
- Look for MTU clues: Test path MTU with tools such as
tracepath, controlledpingsizes, packet captures, and firewall logs. - Review ICMP filtering: Make sure “Fragmentation Needed” / Packet Too Big style feedback is not being blocked by a firewall, security group, appliance, or upstream provider.
- Check tunnels and overlays: VPNs, GRE, WireGuard, VXLAN, PPPoE, and cloud overlays often reduce effective MTU.
- Test MSS clamping: If you operate the gateway, MSS clamping may be a cleaner fix than asking every endpoint to adapt.
- Define success: Decide what should improve: fewer stalled uploads, lower retransmits, fewer support tickets, or better throughput for affected paths.
If you cannot describe the symptom and the expected improvement, you are not tuning yet. You are guessing.
When leaving the default at 0 is the right call
Leave tcp_mtu_probing at 0 when your server is healthy, transfers are stable, and monitoring does not show path-MTU-like failures. This is especially reasonable when you control both ends of the important network path or when your bottleneck is clearly disk, CPU, application code, database latency, or general congestion.
Your concerns about masking the real problem make sense. If blocked ICMP, an incorrect tunnel MTU, or a firewall rule is the root cause, fixing that root cause is better than silently adapting around it. A clean network path is easier to troubleshoot, explain, and support over time.
When testing value 1 is reasonable
Testing net.ipv4.tcp_mtu_probing=1 is reasonable when you have evidence that some paths black-hole larger packets and you cannot immediately fix every network segment involved. For example, customer traffic may cross unknown VPNs, consumer routers, carrier networks, or corporate firewalls. In that case, a conservative fallback can reduce user-visible pain while you continue investigating.
Treat the change like any production experiment:
- Record the current value with
sysctl net.ipv4.tcp_mtu_probing. - Apply the change temporarily first, not as a permanent config file edit.
- Test known problem transfers from affected networks.
- Watch retransmits, throughput, connection duration, CPU load, and customer error reports.
- Roll back if the monitored indicators do not improve or if new connection problems appear.
If value 1 improves the affected paths without hurting the general population, then make the setting persistent and document why it exists. The note should include the symptom, test date, expected benefit, and rollback command.
Be cautious with value 2
Value 2 is not a normal “make TCP smarter” baseline for most small teams. It changes behavior for all TCP connections rather than only suspicious black-hole cases. That may be acceptable in a specialized environment, but for a public file server it should come after controlled testing, not before.
If a guide recommends 2 without explaining your network path, workload, kernel version, and failure mode, treat it as a hint to investigate rather than a command to paste. Throughput tuning should be tied to measurements from your own server.
What to monitor after any MTU-related change
A single speed test is not enough. MTU problems can be path-specific, intermittent, and customer-specific. Build a small monitoring view that compares before and after behavior.
- TCP retransmission rate and timeout counters.
- Large file upload and download success rates.
- 95th percentile transfer time for representative objects.
- Network interface errors, drops, and queue pressure.
- Firewall logs for blocked ICMP or unusual TCP resets.
- Customer-facing error rates by region, ISP, or client network when available.
- Kernel and sysctl configuration drift so the setting does not become tribal knowledge.
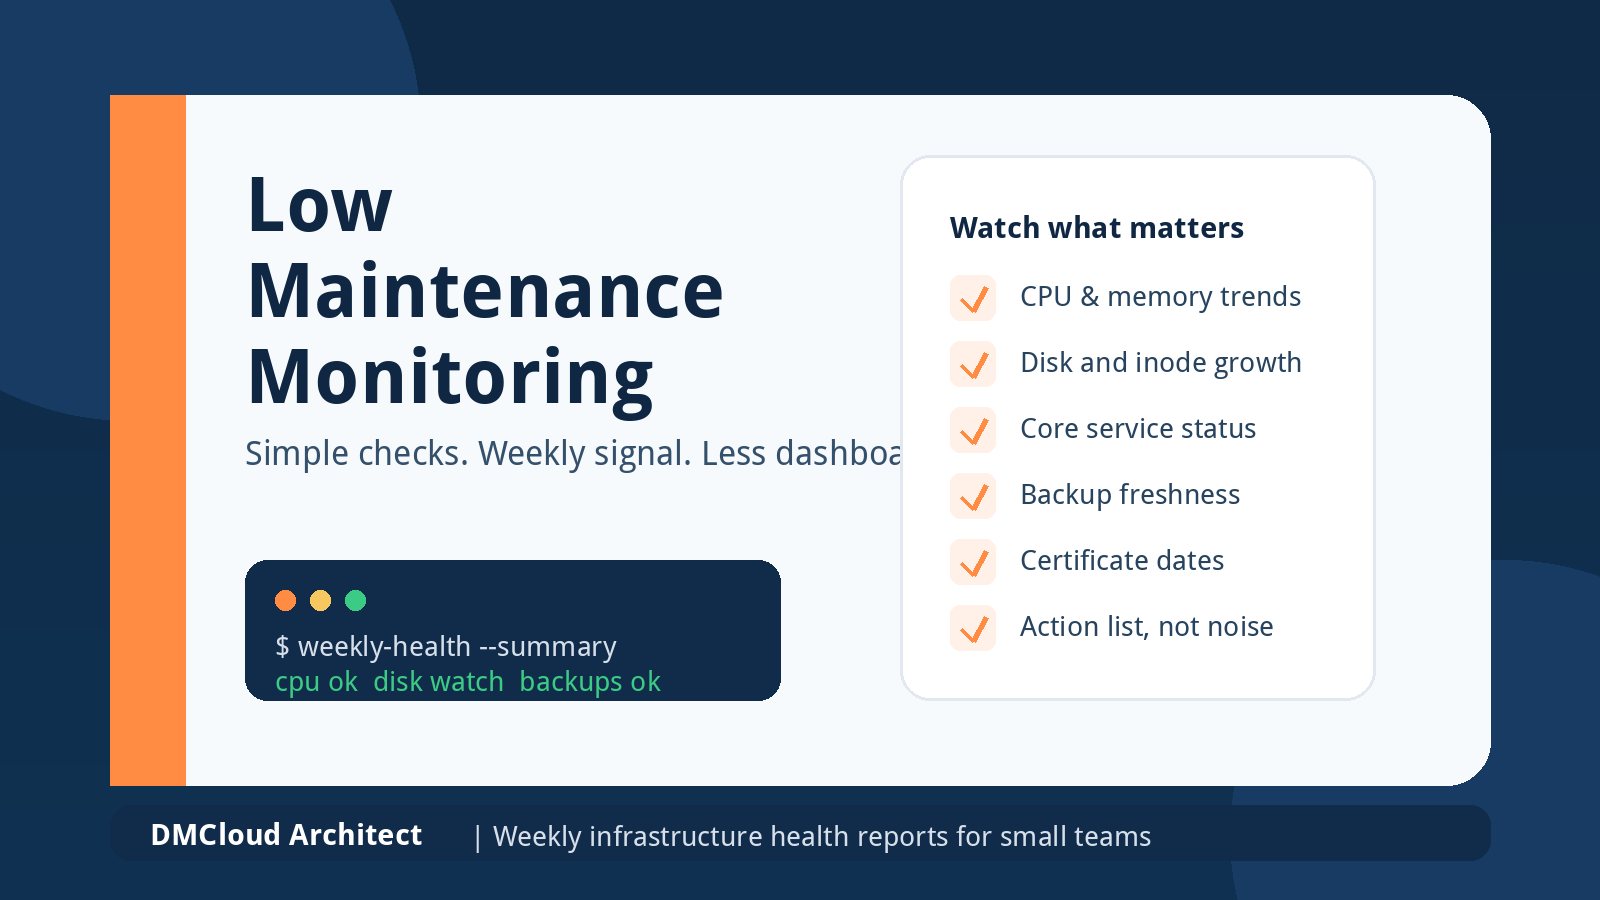
This is where weekly infrastructure reporting can be more useful than another dashboard. Dashboards are good during an incident. A weekly report is better for catching the slow pattern: retransmits creeping up, disk throughput becoming the real bottleneck, backups crowding the network window, or a sysctl change that nobody remembers making.
A practical recommendation for public file servers
For most internet-facing file storage servers, start with this policy:
- Keep
tcp_mtu_probing=0when there is no evidence of PMTU black holes. - Fix ICMP filtering, tunnel MTUs, and gateway MSS behavior when you control the path.
- Test
tcp_mtu_probing=1only when affected paths are real and not fully under your control. - Avoid
2unless you can justify it with measured results and a rollback plan. - Document the decision in the same place you track server health, not only in a forgotten tuning file.
That approach respects both sides of the issue. It does not dismiss TCP MTU probing as useless, and it does not treat it as magic. It uses the Linux default as the baseline, monitoring as the evidence, and a reversible change as the safety mechanism.
Bottom line
Your hesitation is healthy. Packet-layer probing can make a broken path more survivable, but it should not replace understanding the network. If your monitoring points to black-holed PMTU feedback that you cannot fully repair, value 1 is the conservative test. If your server is already stable, the best tuning move is often to keep the default and improve the visibility around throughput, retransmits, and path-specific failures.
Want weekly infrastructure health checks without dashboard fatigue?
DMCloud Architect sends Linux and MySQL infrastructure health reports directly to your inbox, so you can spot risks early without adding another monitoring dashboard to watch.
Get the free starter plan for weekly infrastructure health reports.